2016 United States presidential election in South Carolina
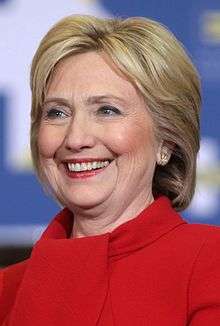
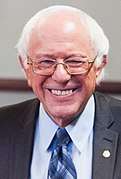
The 2016 United States presidential election was held on November 8, 2016, as part of the 2016 General Election in which all 50 states plus the District of Columbia participated. South Carolina voters chose electors to represent them in the Electoral College via a popular vote pitting the Republican Party's nominee, businessman Donald Trump, and running mate Indiana Governor Mike Pence against Democratic Party nominee, former Secretary of State Hillary Clinton and her running mate, Virginia Senator Tim Kaine.
| ||||||||||||||||||||||||||
| Turnout | 67.86%[1] | |||||||||||||||||||||||||
|---|---|---|---|---|---|---|---|---|---|---|---|---|---|---|---|---|---|---|---|---|---|---|---|---|---|---|
| ||||||||||||||||||||||||||
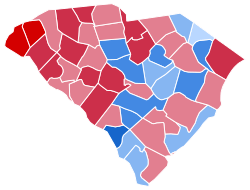 County results Trump: 50–60% 60–70% 70–80% Clinton: 40–50% 50–60% 60–70% 70–80% | ||||||||||||||||||||||||||
| ||||||||||||||||||||||||||
.jpg)

On February 20 and 27, 2016, in the presidential primaries, South Carolina voters expressed their preferences for the Republican and Democratic parties' respective nominees for president. Registered members of each party could only vote in their party's primary, while voters who were unaffiliated could choose any one primary in which to vote.
Out of 3.12 million registered voters, 2.10 million voted, a turnout of 67.86%.[1]
Donald Trump continued the Republican tradition in South Carolina, carrying the state with 54.9% of the vote. Hillary Clinton received 40.7% of the vote, underperforming Obama by about 4%. [2]
Republicans have only lost South Carolina once since the assassination of John F. Kennedy, in 1976 (by a double-digit percentage margin).
Trump became the first Republican to win the White House without carrying Charleston County since Herbert Hoover in 1928.
Background
The former President of the United States, Barack Obama, a Democrat and former U.S. Senator from Illinois, was first elected president in the 2008 election, running with former Senator Joe Biden of Delaware. Defeating the Republican nominee, Senator John McCain of Arizona, with 52.9% of the popular vote and 68% of the electoral vote,[3][4] Obama succeeded two-term Republican President George W. Bush, the former Governor of Texas. Obama and Biden were reelected in the 2012 presidential election, defeating former Massachusetts Governor Mitt Romney with 51.1% of the popular vote and 61.7% of electoral votes.[5] Although Barack Obama's approval rating in the RealClearPolitics poll tracking average remained between 40 and 50% for most of his second term, it has experienced a surge in early 2016 and reached its highest point since 2012 during June of that year.[6][7] Analyst Nate Cohn has noted that a strong approval rating for President Obama would equate to a strong performance for the Democratic candidate, and vice versa.[8]
Following his second term, President Obama was not eligible for another reelection. In October 2015, Obama's running-mate and 2-term Vice President Biden decided not to enter the race for the Democratic presidential nomination either.[9] With their terms expiring on January 20, 2017, the electorate was asked to elect a new president, the 45th president and 48th vice president of the United States, respectively.
Political landscape in South Carolina
The Republican party's ticket has carried South Carolina in every election since 1980, and with the exception of Jimmy Carter and Walter Mondale's carrying the state in 1976, the Republicans have carried the state since 1964. In the 2012 election, Mitt Romney and Paul Ryan defeated Democrats Barack Obama and Joe Biden by a margin of 54% to 44%. The state has not had a Democratic Senator since Ernest Hollings retired in 2005. The state has had a Republican majority in the United States House of Representatives since the so-called "Republican Revolution" of 1994. However, some have suggested that South Carolina may become a battleground state in this election cycle because of Clinton's lead in the national polling.[10] A poll released on August 10 by Public Policy Polling had Trump leading Clinton by a margin of only 2 points,[10] and an internal poll commissioned for the South Carolina Democratic Party had the race tied.[11] This led Larry Sabato's political prediction website Sabato's Crystal Ball to move the rating of the South Carolina contest from "Safe Republican" to "Likely Republican" on August 18.[12]
Primary elections
Democratic primary
| |||||||||||||||||||
| |||||||||||||||||||
 South Carolina results by county
Hillary Clinton | |||||||||||||||||||
The 59 delegates for the Democratic National Convention from South Carolina are allocated in this way. There are 53 pledged delegates and 6 unpledged delegates. For the pledged delegates, each district gets 5 delegates that are allocated proportionally. There are then 18 at-large delegates awarded proportionally.[13]
| South Carolina Democratic primary, February 27, 2016 | |||||
|---|---|---|---|---|---|
| Candidate | Popular vote | Estimated delegates | |||
| Count | Percentage | Pledged | Unpledged | Total | |
| Hillary Clinton | 272,379 | 73.44% | 39 | 5 | 44 |
| Bernie Sanders | 96,498 | 26.02% | 14 | 0 | 14 |
| Willie Wilson | 1,314 | 0.35% | |||
| Martin O'Malley (withdrawn) | 713 | 0.19% | |||
| Uncommitted | 0 | 1 | 1 | ||
| Total votes | 370,904 | 100% | 53 | 6 | 59 |
| Sources: The Green Papers, South Carolina State Election Commission | |||||
Republican primary
| |||||||||||||||||||||||||||||||||||||||||||||||||||||
| |||||||||||||||||||||||||||||||||||||||||||||||||||||
 South Carolina results by county
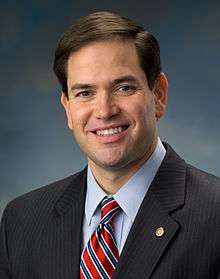
Donald Trump
Marco Rubio | |||||||||||||||||||||||||||||||||||||||||||||||||||||
.jpg)
.jpg)
Delegates from South Carolina to the Republican National Convention are awarded in this way. 29 delegates are awarded to the candidate that wins the plurality of the vote in the South Carolina primary. The remaining 21 delegates are allocated by giving the winner of each of the seven congressional districts 3 delegates. [14]
| South Carolina Republican primary, February 20, 2016 | |||||
|---|---|---|---|---|---|
| Candidate | Votes | Percentage | Actual delegate count | ||
| Bound | Unbound | Total | |||
| Donald Trump | 240,882 | 32.51% | 50 | 0 | 50 |
| Marco Rubio | 166,565 | 22.48% | 0 | 0 | 0 |
| Ted Cruz | 165,417 | 22.33% | 0 | 0 | 0 |
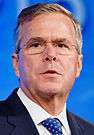
| Jeb Bush | 58,056 | 7.84% | 0 | 0 | 0 |
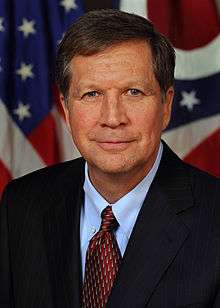
| John Kasich | 56,410 | 7.61% | 0 | 0 | 0 |
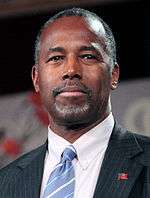
| Ben Carson | 53,551 | 7.23% | 0 | 0 | 0 |
| Chris Christie (withdrawn) | 0 | 0 | 0 | ||
| Carly Fiorina (withdrawn) | 0 | 0 | 0 | ||
| Rand Paul (withdrawn) | 0 | 0 | 0 | ||
| Mike Huckabee (withdrawn) | 0 | 0 | 0 | ||
| Rick Santorum (withdrawn) | 0 | 0 | 0 | ||
| Jim Gilmore (withdrawn) | 0 | 0 | 0 | ||
| George Pataki (withdrawn) | 0 | 0 | 0 | ||
| Lindsey Graham (withdrawn) | 0 | 0 | 0 | ||
| Unprojected delegates: | 0 | 0 | 0 | ||
| Total: | 740,881 | 100.00% | 50 | 0 | 50 |
| Source: The Green Papers | |||||
Green state convention
On April 30, the Green Party of South Carolina held its state convention. The public was welcome, but only members and delegates were eligible to vote.[15]
On April 30, it was announced that William Kreml had won the primary.
| South Carolina Green Party presidential convention, April 17, 2016 | |||
|---|---|---|---|
| Candidate | Votes | Percentage | National delegates |
| William Kreml | - | - | 5 |
| Jill Stein | - | - | 3 |
| Sedinam Kinamo Christin Moyowasifza Curry | - | - | - |
| Darryl Cherney | - | - | - |
| Kent Mesplay | - | - | - |
| Total | - | 100.00% | 8 |
Polling
General election
Predictions
- CNN: Solid Trump[16]
- Cook Political Report: Likely Trump[17]
- Electoral-vote.com: Leans Trump[18]
- Los Angeles Times: Solid Trump[19]
- NBC: Leans Trump[20]
- RealClearPolitics: Leans Trump[21]
- Sabato's Crystal Ball: Safe Trump[22]
Results
| United States presidential election in South Carolina, 2016 | ||||||
|---|---|---|---|---|---|---|
| Party | Candidate | Running mate | Votes | Percentage | Electoral votes | |
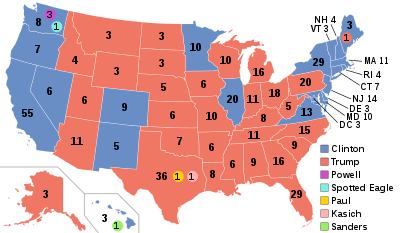
| Republican | Donald Trump | Mike Pence | 1,155,389 | 54.94% | 9 | |
| Democratic | Hillary Clinton | Tim Kaine | 855,373 | 40.67% | 0 | |
| Libertarian | Gary Johnson | Bill Weld | 49,204 | 2.34% | 0 | |
| Independence | Evan McMullin | Nathan Johnson | 21,016 | 1.00% | 0 | |
| Green | Jill Stein | Ajamu Baraka | 13,034 | 0.62% | 0 | |
| Constitution | Darrell Castle | Scott Bradley | 5,765 | 0.27% | 0 | |
| American (South Carolina)[23] | Peter Skewes | Michael Lacy | 3,246 | 0.15% | 0 | |
| Totals | 2,103,027 | 100.00% | 9 | |||
By congressional district
Trump won 6 of 7 congressional districts.
| District | Trump | Clinton | Representative |
|---|---|---|---|
| 1st | 53% | 41% | Mark Sanford |
| 2nd | 57% | 38% | Joe Wilson |
| 3rd | 67% | 29% | Jeff Duncan |
| 4th | 60% | 34% | Trey Gowdy |
| 5th | 57% | 39% | Mick Mulvaney |
| 6th | 30% | 67% | Jim Clyburn |
| 7th | 58% | 39% | Tom Rice |
By county
| County | Clinton% | Clinton# | Trump% | Trump# | Others% | Others# | Total |
|---|---|---|---|---|---|---|---|
| Abbeville | 34.72% | 3,741 | 62.77% | 6,763 | 2.52% | 271 | 10,775 |
| Aiken | 34.01% | 25,455 | 61.49% | 46,025 | 4.50% | 3,371 | 74,851 |
| Allendale | 76.14% | 2,735 | 21.97% | 789 | 1.89% | 68 | 3,592 |
| Anderson | 26.21% | 21,097 | 69.87% | 56,232 | 3.92% | 3,154 | 80,483 |
| Bamberg | 62.73% | 3,898 | 35.47% | 2,204 | 1.80% | 112 | 6,214 |
| Barnwell | 46.39% | 4,400 | 51.54% | 4,889 | 2.07% | 196 | 9,485 |
| Beaufort | 40.93% | 32,138 | 54.66% | 42,922 | 4.41% | 3,464 | 78,524 |
| Berkeley | 38.61% | 30,705 | 56.07% | 44,587 | 5.31% | 4,225 | 79,517 |
| Calhoun | 47.33% | 3,573 | 50.17% | 3,787 | 2.50% | 189 | 7,549 |
| Charleston | 50.64% | 89,299 | 42.78% | 75,443 | 6.58% | 11,603 | 176,345 |
| Cherokee | 28.00% | 6,092 | 69.70% | 15,167 | 2.30% | 500 | 21,759 |
| Chester | 46.36% | 6,579 | 51.19% | 7,265 | 2.45% | 348 | 14,192 |
| Chesterfield | 41.36% | 6,858 | 56.16% | 9,312 | 2.48% | 411 | 16,581 |
| Clarendon | 50.22% | 7,732 | 47.98% | 7,386 | 1.80% | 277 | 15,395 |
| Colleton | 44.21% | 7,627 | 52.70% | 9,091 | 3.09% | 533 | 17,251 |
| Darlington | 46.80% | 13,888 | 50.51% | 14,989 | 2.69% | 797 | 29,674 |
| Dillon | 49.87% | 5,834 | 48.19% | 5,637 | 1.94% | 227 | 11,698 |
| Dorchester | 38.45% | 24,055 | 55.92% | 34,987 | 5.63% | 3,525 | 62,567 |
| Edgefield | 38.57% | 4,491 | 58.76% | 6,842 | 2.67% | 311 | 11,644 |
| Fairfield | 61.64% | 6,945 | 35.74% | 4,027 | 2.62% | 295 | 11,267 |
| Florence | 46.11% | 26,710 | 51.05% | 29,573 | 2.84% | 1,648 | 57,931 |
| Georgetown | 42.04% | 13,310 | 54.93% | 17,389 | 3.03% | 958 | 31,657 |
| Greenville | 34.62% | 74,483 | 59.41% | 127,832 | 5.97% | 12,850 | 215,165 |
| Greenwood | 37.24% | 10,711 | 58.97% | 16,961 | 3.79% | 1,091 | 28,763 |
| Hampton | 58.71% | 5,170 | 39.61% | 3,488 | 1.68% | 148 | 8,806 |
| Horry | 29.65% | 39,410 | 67.17% | 89,288 | 3.18% | 4,222 | 132,920 |
| Jasper | 52.12% | 5,956 | 45.39% | 5,187 | 2.49% | 284 | 11,427 |
| Kershaw | 35.63% | 10,330 | 60.50% | 17,542 | 3.87% | 1,123 | 28,995 |
| Lancaster | 35.47% | 13,812 | 60.91% | 23,719 | 3.61% | 1,407 | 38,938 |
| Laurens | 33.46% | 8,889 | 63.30% | 16,816 | 3.24% | 861 | 26,566 |
| Lee | 63.74% | 5,199 | 34.37% | 2,803 | 1.89% | 154 | 8,156 |
| Lexington | 28.86% | 35,230 | 65.55% | 80,026 | 5.60% | 6,837 | 122,093 |
| Marion | 60.02% | 8,569 | 38.14% | 5,444 | 1.84% | 263 | 14,276 |
| Marlboro | 57.31% | 5,954 | 41.07% | 4,267 | 1.62% | 168 | 10,389 |
| McCormick | 47.53% | 2,479 | 50.84% | 2,652 | 1.63% | 85 | 5,216 |
| Newberry | 36.99% | 6,217 | 59.60% | 10,017 | 3.41% | 573 | 16,807 |
| Oconee | 23.78% | 7,998 | 71.88% | 24,178 | 4.34% | 1,459 | 33,635 |
| Orangeburg | 67.64% | 26,318 | 30.66% | 11,931 | 1.70% | 661 | 38,910 |
| Pickens | 21.11% | 10,354 | 73.88% | 36,236 | 5.01% | 2,459 | 49,049 |
| Richland | 64.01% | 108,000 | 31.10% | 52,469 | 4.89% | 8,253 | 168,722 |
| Saluda | 32.85% | 2,813 | 64.53% | 5,526 | 2.63% | 225 | 8,564 |
| Spartanburg | 33.03% | 39,997 | 62.99% | 76,277 | 3.98% | 4,816 | 121,090 |
| Sumter | 54.55% | 24,047 | 42.52% | 18,745 | 2.94% | 1,294 | 44,086 |
| Union | 39.11% | 4,729 | 58.39% | 7,061 | 2.50% | 302 | 12,092 |
| Williamsburg | 66.12% | 9,953 | 32.31% | 4,864 | 1.57% | 237 | 15,054 |
| York | 36.37% | 41,593 | 58.37% | 66,754 | 5.26% | 6,010 | 114,357 |
Counties that swung from Democratic to Republican
- Barnwell (largest city: Barnwell)
- Calhoun (largest town: St. Matthews)
- Chester (largest city: Chester)
- Colleton (largest city: Walterboro)
- Darlington (largest city: Hartsville)
- McCormick (largest town: McCormick)
Electors
Technically the voters of South Carolina cast their ballots for electors: representatives to the Electoral College. South Carolina is allocated 9 electors because it has 7 congressional districts and 2 senators. All candidates who appear on the ballot or qualify to receive write-in votes must submit a list of 9 electors, who pledge to vote for their candidate and his or her running mate. Whoever wins the majority of votes in the state is awarded all 9 electoral votes. Their chosen electors then vote for president and vice president. Although electors are pledged to their candidate and running mate, they are not obligated to vote for them. An elector who votes for someone other than his or her candidate is known as a faithless elector.
The electors of each state and the District of Columbia met on December 19, 2016, to cast their votes for president and vice president. The Electoral College itself never meets as one body. Instead the electors from each state and the District of Columbia met in their respective capitols.
The following were the members of the Electoral College from the state. All 9 were pledged for Trump/Pence.
- Glenn McCall
- Matt Moore
- Terry Hardesty
- Jim Ulmer
- Brenda Bedenbaugh
- Bill Conley
- Shery Smith
- Moye Graham
- Jerry Rovner[24]
References
- "South Carolina Voter Registration Demographics". scvotes.org. Retrieved 13 June 2017.
- "South Carolina Results". New York Times. Retrieved 13 June 2017.
- "United States House of Representatives floor summary for Jan 8, 2009". Clerk.house.gov. Archived from the original on April 2, 2012. Retrieved January 30, 2009.
- "Federal elections 2008" (PDF). Federal Election Commission. Retrieved May 11, 2015.
- "President Map". The New York Times. November 29, 2012. Retrieved May 11, 2015.
- "Election Other – President Obama Job Approval". RealClearPolitics. Retrieved December 24, 2015.
- Byrnes, Jesse (2016-06-15). "Poll: Obama approval rating highest since 2012". TheHill. Retrieved 2016-06-19.
- Cohn, Nate (2015-01-19). "What a Rise in Obama's Approval Rating Means for 2016". The New York Times. ISSN 0362-4331. Retrieved 2016-06-19.
- "Joe Biden Decides Not to Enter Presidential Race". The Wall Street Journal. Retrieved October 21, 2015.
- "Clinton/Trump Race Tight in South Carolina". Public Policy Polling. Public Policy Polling. Archived from the original on 15 August 2016. Retrieved 24 August 2016.
- Master, Cyra. "Poll: Clinton tied with Trump in SC". The Hill. Capitol Hill Publishing Corp. Retrieved 24 August 2016.
- Kondik, Kyle; Sabato, Larry; Skelley, Geoffrey. "Clinton Rises to 348 Electoral Votes, Trump Drops to 190". Sabato's Crystal Ball. University of Virginia Center for Politics. Retrieved 24 August 2016.
- "South Carolina Democratic Delegation 2016". www.thegreenpapers.com. Retrieved 2017-02-22.
- Carrejo, Cate. "Is The South Carolina Primary Winner Take All? There's A Lot At Stake In The Palmetto State". Retrieved 2017-02-22.
- "2016 South Carolina Green Party state convention". South Carolina Green Party. 2016-03-10. Retrieved 2016-03-12.
- Chalian, David (4 November 2016). "Road to 270: CNN's new election map". CNN. Retrieved 17 February 2019.
- "2016 Electoral Scorecard". The Cook Political Report. 7 November 2016. Retrieved 17 February 2019.
- "2016 Predicted Electoral Map". Electoral-vote.com. Retrieved 17 February 2019.
- "Our final map has Clinton winning with 352 electoral votes. Compare your picks with ours". Los Angeles Times. 6 November 2016. Retrieved 17 February 2019.
- Todd, Chuck (7 November 2016). "NBC's final battleground map shows a lead for Clinton". NBC News. Retrieved 17 February 2019.
- "2016 Election Maps - Battle for White House". RealClearPolitics. Retrieved 17 February 2019.
- Sabato, Larry (7 November 2016). "The Crystal Ball's 2016 Electoral College ratings". University of Virginia Center for Politics. Retrieved 17 February 2019.
- https://uselectionatlas.org/RESULTS/
- "Press Release: SCGOP selects Electoral College Members". 23 August 2016. Archived from the original on 11 November 2016. Retrieved 13 September 2017.
External links
State and district results of the 2016 United States presidential election | ||
|---|---|---|
|  | |
| ||