2016 United States presidential election in New Jersey
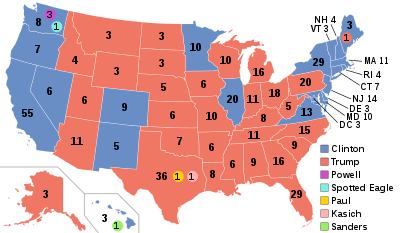
The 2016 United States presidential election in New Jersey was won by Hillary Clinton on November 8, 2016, with 55.5% of the vote over Donald Trump's 41.35%. New Jersey's 14 electoral votes were assigned to Clinton and her Vice-presidential running mate Tim Kaine.
| ||||||||||||||||||||||||||
| Turnout | 68% | |||||||||||||||||||||||||
|---|---|---|---|---|---|---|---|---|---|---|---|---|---|---|---|---|---|---|---|---|---|---|---|---|---|---|
| ||||||||||||||||||||||||||
 County Results
| ||||||||||||||||||||||||||
| ||||||||||||||||||||||||||
.jpg)

| Elections in New Jersey | ||||||||
|---|---|---|---|---|---|---|---|---|
 | ||||||||
|
||||||||
|
||||||||
|
|
||||||||
|
Other cities
|
||||||||
Primary elections
New Jersey's presidential primaries were on June 7, 2016, with the Democratic, Republican, and Libertarian parties participating.[1] Registered members of each party could only vote in their party's primary, while voters who were unaffiliated could choose any 1 primary in which to vote.
Democratic primary
Two candidates appeared on the Democratic presidential primary ballot:[2]
| New Jersey Democratic primary, June 7, 2016 | |||||
|---|---|---|---|---|---|
| Candidate | Popular vote | Estimated delegates | |||
| Count | Percentage | Pledged | Unpledged | Total | |
| Hillary Clinton | 566,247 | 63.32% | 79 | 12 | 91 |
| Bernie Sanders | 328,058 | 36.68% | 47 | 2 | 49 |
| Uncommitted | N/A | 0 | 0 | 0 | |
| Total | 894,305 | 100% | 126 | 16 | 142 |
| Source: The Green Papers, New Jersey Democratic Primary Official Results - New Jersey Department of State | |||||
Republican primary
3 candidates appeared on the Republican presidential primary ballot:[2]
- Ted Cruz (withdrawn prior to primary)
- John Kasich (withdrawn prior to primary)
- Donald Trump
| New Jersey Republican primary, June 7, 2016 | |||||
|---|---|---|---|---|---|
| Candidate | Votes | Percentage | Actual delegate count | ||
| Bound | Unbound | Total | |||
| Donald Trump | 360,212 | 80.41% | 51 | 0 | 51 |
| John Kasich (withdrawn) | 59,866 | 13.36% | 0 | 0 | 0 |
| Ted Cruz (withdrawn) | 27,874 | 6.22% | 0 | 0 | 0 |
| Unprojected delegates: | 0 | 0 | 0 | ||
| Total: | 447,952 | 100.00% | 51 | 0 | 51 |
| Source: The Green Papers | |||||
General election
Candidate ballot access:[3]
- Hillary Clinton/Tim Kaine, Democratic
- Donald Trump/Mike Pence, Republican
- Darrell Castle/Scott Bradley, Constitution
- Rocky De La Fuente/Michael Steinberg, American Delta Party
- Gary Johnson/Bill Weld, Libertarian
- Alyson Kennedy/Osborne Hart, Socialist Workers Party
- Gloria La Riva/Eugene Puryear, Socialism and Liberation
- Monica Moorehead/Lamont Lilly, Workers World Party
- Jill Stein/Ajamu Baraka, Green Party
Results

-Blue municipalities won by Clinton
-Red municipalities won by Trump
-Purple municipality, Clinton and Trump tied (Teterboro only)
| Party | Candidate | Votes | % | ± | |
|---|---|---|---|---|---|
| Democratic | Hillary Clinton | 2,148,278 | 55.45% | ||
| Republican | Donald Trump | 1,601,933 | 41.35% | ||
| Libertarian | Gary Johnson | 72,477 | 1.87% | ||
| Green | Jill Stein | 37,772 | 0.98% | ||
| Constitution | Darrell Castle | 6,161 | 0.16% | ||
| Socialist Workers | Alyson Kennedy | 2,156 | 0.06% | ||
| American Delta Party | Rocky De La Fuente | 1,838 | 0.05% | ||
| Workers World | Monica Moorehead | 1,749 | 0.05% | ||
| Socialism and Liberation | Gloria La Riva | 1,682 | 0.04% | ||
| Majority | 546,345 | 14.10% | |||
| Turnout | 3,874,046 | ||||
Results by county
| County | Clinton votes | Clinton % | Trump votes | Trump % | Other votes | Other % |
|---|---|---|---|---|---|---|
| Atlantic | 60,924 | 51.0% | 52,690 | 44.1% | 3,677 | 3.13% |
| Bergen | 231,211 | 54.2% | 175,529 | 41.1% | 12,556 | 2.99% |
| Burlington | 121,725 | 54.2% | 89,272 | 39.7% | 7,946 | 3.63% |
| Camden | 146,717 | 63.4% | 72,631 | 31.4% | 7,244 | 3.20% |
| Cape May | 18,750 | 37.5% | 28,446 | 57.0% | 1,526 | 3.13% |
| Cumberland | 27,771 | 50.4% | 24,453 | 44.4% | 1,780 | 3.30% |
| Essex | 240,837 | 76.2% | 63,176 | 20.0% | 6,921 | 2.23% |
| Gloucester | 66,870 | 46.9% | 67,544 | 47.4% | 5,128 | 3.67% |
| Hudson | 163,917 | 73.2% | 49,043 | 21.9% | 6,415 | 2.92% |
| Hunterdon | 28,898 | 39.7% | 38,712 | 53.2% | 3,226 | 4.55% |
| Mercer | 104,775 | 65.6% | 46,193 | 28.9% | 5,561 | 3.55% |
| Middlesex | 193,044 | 58.0% | 122,953 | 37.0% | 10,105 | 3.10% |
| Monmouth | 137,181 | 42.3% | 166,723 | 51.5% | 10,473 | 3.33% |
| Morris | 115,249 | 44.9% | 126,071 | 49.1% | 9,096 | 3.63% |
| Ocean | 87,150 | 31.1% | 179,079 | 63.9% | 8,133 | 2.96% |
| Passaic | 116,759 | 58.8% | 72,902 | 36.7% | 5,141 | 2.64% |
| Salem | 11,904 | 39.6% | 16,381 | 54.4% | 1,209 | 4.10% |
| Somerset | 85,689 | 53.4% | 65,505 | 40.8% | 5,898 | 3.75% |
| Sussex | 24,212 | 32.0% | 46,658 | 61.8% | 3,256 | 4.39% |
| Union | 147,414 | 66.4% | 68,114 | 30.7% | 6,447 | 2.90% |
| Warren | 17,281 | 34.3% | 29,858 | 59.2% | 2,097 | 4.26% |
By congressional district
Clinton won 7 of 12 congressional districts.[5]
| District | Trump | Clinton | Representative |
|---|---|---|---|
| 1st | 36% | 61% | Donald Norcross |
| 2nd | 51% | 46% | Frank LoBiondo |
| 3rd | 51% | 45% | Tom MacArthur |
| 4th | 56% | 41% | Chris Smith |
| 5th | 49% | 48% | Scott Garrett |
| Josh Gottheimer | |||
| 6th | 41% | 56% | Frank Pallone, Jr. |
| 7th | 48% | 49% | Leonard Lance |
| 8th | 22% | 76% | Albio Sires |
| 9th | 33% | 64% | Bill Pascrell |
| 10th | 13% | 85% | Donald M. Payne Jr. |
| 11th | 49% | 48% | Rodney Frelinghuysen |
| 12th | 32% | 65% | Bonnie Watson Coleman |
Analysis
Hillary Clinton's 55.5% of the vote was 2.9% less than Barack Obama's win in the state in 2012. This was the first time since 1976 that New Jersey did not vote for the same candidate as neighboring Pennsylvania. Donald Trump became the first Republican to win Gloucester County since George H. W. Bush in 1988.
See also
References
- Green papers for 2016 primaries (D) (R). Retrieved 2016-04-05.
- "Official List / Candidates for President / For PRIMARY ELECTION 06/07/2016 Election" (PDF). NJ.gov. April 14, 2016. Retrieved 2017-11-04.
- "Official List Candidates for President For GENERAL ELECTION 11/08/2016 Election" (PDF). New Jersey Secretary of State - Division of Elections. August 12, 2016. Retrieved November 9, 2016.
- "Official List Candidates for President For GENERAL ELECTION 11/08/2016 Election" (PDF). New Jersey Secretary of State - Division of Elections. December 6, 2016. Archived from the original (PDF) on January 7, 2017. Retrieved December 6, 2016.
- "Presidential Results by Congressional District, 2000-2008 – Swing State Project". www.swingstateproject.com. Retrieved 7 April 2018.