2016 United States presidential election in Indiana
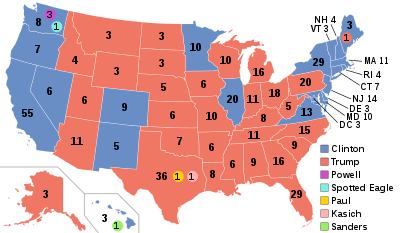
The 2016 United States presidential election in Indiana was held on November 8, 2016, as part of the 2016 United States presidential election in which all 50 states plus the District of Columbia participated. Indiana voters chose electors to represent them in the Electoral College via a popular vote pitting the Republican Party's nominee, businessman Donald Trump, and running mate Indiana Governor Mike Pence against Democratic Party nominee, former Secretary of State Hillary Clinton and her running mate, Virginia Senator Tim Kaine.
| ||||||||||||||||||||||||||
| Turnout | 58% | |||||||||||||||||||||||||
|---|---|---|---|---|---|---|---|---|---|---|---|---|---|---|---|---|---|---|---|---|---|---|---|---|---|---|
| ||||||||||||||||||||||||||
 County results Trump: 40–50% 50–60% 60–70% 70–80% Clinton: 40–50% 50–60% | ||||||||||||||||||||||||||
| ||||||||||||||||||||||||||
.jpg)

| Elections in Indiana | ||||||
|---|---|---|---|---|---|---|
 | ||||||
|
||||||
On May 3, 2016, in the presidential primaries, voters expressed their preferences for the Democratic and Republican parties' respective nominees for president.
Donald Trump won the election in Indiana with 56.47% of the vote. Hillary Clinton received 37.46% of the vote.[1] Indiana is the home state of Trump's running mate, Mike Pence, which was believed to have provided important assistance to the Trump campaign in what already would have been a Republican-leaning state.
Predictions
- CNN: Solid Trump[2]
- Cook Political Report: Likely Trump[3]
- Electoral-vote.com: Solid Trump[4]
- NBC: Leans Trump[5]
- RealClearPolitics: Likely Trump[6]
- Sabato's Crystal Ball: Safe Trump[7]
Results
By congressional district
Trump won 7 of 9 congressional districts.[8]
| District | Trump | Clinton | Representative |
|---|---|---|---|
| 1st | 41% | 54% | Pete Visclosky |
| 2nd | 59% | 36% | Jackie Walorski |
| 3rd | 65% | 30% | Marlin Stutzman |
| 4th | 64% | 30% | Todd Rokita |
| 5th | 53% | 41% | Susan Brooks |
| 6th | 68% | 27% | Luke Messer |
| 7th | 36% | 58% | André Carson |
| 8th | 64% | 31% | Larry Bucshon |
| 9th | 61% | 34% | Todd Young |
By county
| Hillary Rodham Clinton
Democratic |
Donald John Trump
Republican |
Various candidates
Other parties |
Total | ||||
|---|---|---|---|---|---|---|---|
| County | % | # | % | # | % | # | # |
| Adams | 21.43% | 2,805 | 73.71% | 9,648 | 4.87% | 637 | 13,090 |
| Allen | 37.64% | 55,382 | 57.04% | 83,930 | 5.32% | 7,825 | 147,137 |
| Bartholomew | 30.29% | 9,841 | 63.53% | 20,640 | 6.18% | 2,009 | 32,490 |
| Benton | 23.46% | 860 | 70.35% | 2,579 | 6.19% | 227 | 3,666 |
| Blackford | 25.69% | 1,243 | 69.23% | 3,350 | 5.08% | 246 | 4,839 |
| Boone | 31.64% | 10,181 | 61.08% | 19,654 | 7.28% | 2,343 | 32,178 |
| Brown | 31.69% | 2,518 | 63.13% | 5,016 | 5.17% | 411 | 7,945 |
| Carroll | 21.89% | 1,892 | 72.58% | 6,273 | 5.53% | 478 | 8,643 |
| Cass | 26.46% | 3,759 | 68.27% | 9,701 | 5.27% | 749 | 14,209 |
| Clark | 36.77% | 18,808 | 58.72% | 30,035 | 4.50% | 2,304 | 51,147 |
| Clay | 20.44% | 2,306 | 75.62% | 8,531 | 3.94% | 445 | 11,282 |
| Clinton | 23.62% | 2,819 | 71.47% | 8,531 | 4.91% | 586 | 11,936 |
| Crawford | 28.80% | 1,323 | 65.64% | 3,015 | 5.55% | 255 | 4,593 |
| Daviess | 16.72% | 1,800 | 79.36% | 8,545 | 3.93% | 423 | 10,768 |
| Dearborn | 20.36% | 4,883 | 75.51% | 18,113 | 4.13% | 991 | 23,987 |
| Decatur | 19.06% | 2,121 | 76.30% | 8,490 | 4.64% | 516 | 11,127 |
| DeKalb | 23.32% | 3,942 | 71.32% | 12,054 | 5.36% | 906 | 16,902 |
| Delaware | 40.23% | 18,153 | 53.77% | 24,263 | 6.0% | 2,707 | 45,123 |
| Dubois | 26.97% | 5,389 | 66.88% | 13,365 | 6.15% | 1,230 | 19,984 |
| Elkhart | 31.60% | 20,740 | 63.79% | 41,867 | 4.61% | 3,023 | 65,630 |
| Fayette | 23.63% | 2,252 | 71.76% | 6,839 | 4.61% | 439 | 9,530 |
| Floyd | 37.26% | 13,945 | 57.27% | 21,432 | 5.47% | 2,048 | 37,425 |
| Fountain | 19.70% | 1,476 | 75.57% | 5,662 | 4.73% | 354 | 7,492 |
| Franklin | 17.88% | 1,969 | 78.72% | 8,669 | 3.41% | 375 | 11,013 |
| Fulton | 23.41% | 1,960 | 71.77% | 6,010 | 4.82% | 404 | 8,374 |
| Gibson | 24.03% | 3,721 | 71.56% | 11,081 | 4.40% | 682 | 15,484 |
| Grant | 27.69% | 7,010 | 67.19% | 17,008 | 5.11% | 1,294 | 25,312 |
| Greene | 21.22% | 2,929 | 74.47% | 10,277 | 4.31% | 595 | 13,801 |
| Hamilton | 37.12% | 57,263 | 56.66% | 87,404 | 6.22% | 9,589 | 154,256 |
| Hancock | 24.61% | 8,904 | 69.30% | 25,074 | 6.09% | 2,203 | 36,181 |
| Harrison | 25.77% | 4,783 | 69.74% | 12,943 | 4.48% | 832 | 18,558 |
| Hendricks | 29.91% | 22,600 | 63.97% | 48,337 | 6.12% | 4,622 | 75,559 |
| Henry | 25.42% | 5,124 | 68.94% | 13,895 | 5.64% | 1,136 | 20,155 |
| Howard | 30.44% | 11,215 | 64.26% | 23,675 | 5.30% | 1,953 | 36,843 |
| Huntington | 21.85% | 3,506 | 72.61% | 11,649 | 5.54% | 888 | 16,043 |
| Jackson | 21.87% | 3,843 | 73.17% | 12,859 | 4.96% | 871 | 17,573 |
| Jasper | 24.88% | 3,329 | 70.13% | 9,382 | 4.99% | 667 | 13,378 |
| Jay | 23.65% | 1,889 | 71.34% | 5,697 | 5.01% | 400 | 7,986 |
| Jefferson | 31.94% | 4,326 | 63.10% | 8,546 | 4.96% | 672 | 13,544 |
| Jennings | 21.20% | 2,364 | 73.76% | 8,224 | 5.04% | 562 | 11,150 |
| Johnson | 26.04% | 17,318 | 68.35% | 45,456 | 5.60% | 3,726 | 66,500 |
| Knox | 24.31% | 3,772 | 71.39% | 11,077 | 4.30% | 667 | 15,516 |
| Kosciusko | 19.68% | 6,313 | 74.60% | 23,935 | 5.72% | 1,836 | 32,084 |
| LaGrange | 21.74% | 2,080 | 73.44% | 7,025 | 4.82% | 461 | 9,566 |
| Lake | 58.12% | 116,935 | 37.59% | 75,625 | 4.30% | 8,645 | 201,205 |
| LaPorte | 43.80% | 19,798 | 50.19% | 22,687 | 6.01% | 2,718 | 45,203 |
| Lawrence | 21.98% | 4,210 | 73.28% | 14,035 | 4.74% | 907 | 19,152 |
| Madison | 34.49% | 18,595 | 60.06% | 32,376 | 5.45% | 2,938 | 53,909 |
| Marion | 58.75% | 212,899 | 35.97% | 130,360 | 5.27% | 19,113 | 362,372 |
| Marshall | 26.53% | 4,798 | 67.96% | 12,288 | 5.51% | 996 | 18,082 |
| Martin | 18.32% | 881 | 76.88% | 3,697 | 4.80% | 231 | 4,809 |
| Miami | 20.52% | 2,766 | 73.99% | 9,975 | 5.50% | 741 | 13,482 |
| Monroe | 58.53% | 34,216 | 35.23% | 20,592 | 6.24% | 3,646 | 58,454 |
| Montgomery | 22.18% | 3,362 | 72.97% | 11,059 | 4.85% | 735 | 15,156 |
| Morgan | 19.31% | 6,040 | 75.68% | 23,674 | 5.01% | 1,566 | 31,280 |
| Newton | 24.23% | 1,404 | 70.35% | 4,077 | 5.42% | 314 | 5,795 |
| Noble | 23.11% | 3,904 | 72.22% | 12,198 | 4.67% | 788 | 16,890 |
| Ohio | 23.49% | 686 | 72.51% | 2,118 | 4.01% | 117 | 2,921 |
| Orange | 25.00% | 2,048 | 70.84% | 5,803 | 4.16% | 341 | 8,192 |
| Owen | 22.74% | 1,946 | 71.91% | 6,153 | 5.35% | 458 | 8,557 |
| Parke | 21.89% | 1,441 | 73.88% | 4,863 | 4.22% | 278 | 6,582 |
| Perry | 38.01% | 3,062 | 56.56% | 4,556 | 5.43% | 437 | 8,055 |
| Pike | 21.70% | 1,297 | 73.58% | 4,398 | 4.72% | 282 | 5,977 |
| Porter | 43.63% | 33,676 | 50.31% | 38,832 | 6.07% | 4,682 | 77,190 |
| Posey | 28.24% | 3,521 | 67.41% | 8,404 | 4.35% | 542 | 12,467 |
| Pulaski | 24.31% | 1,327 | 70.60% | 3,854 | 5.09% | 278 | 5,459 |
| Putnam | 22.81% | 3,356 | 72.29% | 10,637 | 4.91% | 722 | 14,715 |
| Randolph | 23.39% | 2,446 | 71.88% | 7,517 | 4.73% | 495 | 10,458 |
| Ripley | 19.29% | 2,471 | 76.55% | 9,806 | 4.16% | 533 | 12,810 |
| Rush | 21.14% | 1,525 | 73.36% | 5,292 | 5.50% | 397 | 7,214 |
| Scott | 29.03% | 2,642 | 66.74% | 6,074 | 4.23% | 385 | 9,101 |
| Shelby | 23.60% | 4,247 | 70.68% | 12,718 | 5.72% | 1,029 | 17,994 |
| Spencer | 28.67% | 2,861 | 65.86% | 6,572 | 5.47% | 546 | 9,979 |
| St. Joseph | 47.48% | 52,252 | 47.27% | 52,021 | 5.26% | 5,787 | 110,060 |
| Starke | 26.98% | 2,489 | 69.01% | 6,367 | 4.01% | 370 | 9,226 |
| Steuben | 25.70% | 3,744 | 69.57% | 10,133 | 4.73% | 689 | 14,566 |
| Sullivan | 24.69% | 2,113 | 71.71% | 6,138 | 3.60% | 308 | 8,559 |
| Switzerland | 25.14% | 930 | 69.15% | 2,558 | 5.70% | 211 | 3,699 |
| Tippecanoe | 43.64% | 27,282 | 49.22% | 30,768 | 7.14% | 4,465 | 62,515 |
| Tipton | 21.13% | 1,587 | 74.42% | 5,589 | 4.45% | 334 | 7,510 |
| Union | 21.73% | 715 | 74.29% | 2,445 | 3.98% | 131 | 3,291 |
| Vanderburgh | 39.35% | 28,530 | 55.85% | 40,496 | 4.80% | 3,481 | 72,507 |
| Vermillion | 29.99% | 2,081 | 65.04% | 4,513 | 4.97% | 345 | 6,939 |
| Vigo | 40.01% | 15,931 | 55.09% | 21,937 | 4.90% | 1,950 | 39,818 |
| Wabash | 22.41% | 3,018 | 72.92% | 9,821 | 4.67% | 629 | 13,468 |
| Warren | 21.35% | 839 | 73.74% | 2,898 | 4.91% | 193 | 3,930 |
| Warrick | 30.71% | 9,086 | 64.59% | 19,113 | 4.70% | 1,390 | 29,589 |
| Washington | 23.16% | 2,636 | 72.12% | 8,209 | 4.72% | 537 | 11,382 |
| Wayne | 32.53% | 8,322 | 62.66% | 16,028 | 4.80% | 1,229 | 25,579 |
| Wells | 19.61% | 2,586 | 75.88% | 10,005 | 4.51% | 594 | 13,185 |
| White | 25.76% | 2,590 | 68.57% | 6,893 | 5.67% | 570 | 10,053 |
| Whitley | 21.63% | 3,379 | 72.70% | 11,358 | 5.67% | 886 | 15,623 |
Counties that swung from Democratic to Republican
- Delaware (largest city: Muncie)
- LaPorte (largest city: Michigan City)
- Perry (largest city: Tell City)
- Porter (largest city: Portage)
- Vigo (largest city: Terre Haute)
Primary elections
Democratic primary

Two candidates appeared on the Democratic presidential primary ballot:
| Indiana Democratic primary, May 3, 2016 | |||||
|---|---|---|---|---|---|
| Candidate | Popular vote | Estimated delegates | |||
| Count | Percentage | Pledged | Unpledged | Total | |
| Bernie Sanders | 335,074 | 52.46% | 44 | 0 | 44 |
| Hillary Clinton | 303,705 | 47.54% | 39 | 7 | 46 |
| Uncommitted | N/A | 0 | 2 | 2 | |
| Total | 638,779 | 100% | 83 | 9 | 92 |
| Source: The Green Papers - Official Primary Results | |||||
Republican primary
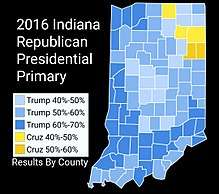
Twelve candidates appeared on the Republican presidential primary ballot:
- Jeb Bush (withdrawn)
- Ben Carson (withdrawn)
- Chris Christie (withdrawn)
- Ted Cruz (campaign suspended after loss in Indiana GOP Primary, a 'winner-take-all' primary)
- Carly Fiorina (withdrawn)
- Jim Gilmore (withdrawn)
- Mike Huckabee (withdrawn)
- John Kasich
- Rand Paul (withdrawn)
- Marco Rubio (withdrawn)
- Rick Santorum (withdrawn)
- Donald Trump
| Indiana Republican primary, May 3, 2016 | |||||
|---|---|---|---|---|---|
| Candidate | Votes | Percentage | Actual delegate count | ||
| Bound | Unbound | Total | |||
| Donald Trump | 591,514 | 53.26% | 57 | 0 | 57 |
| Ted Cruz | 406,783 | 36.63% | 0 | 0 | 0 |
| John Kasich | 84,111 | 7.57% | 0 | 0 | 0 |
| Ben Carson (withdrawn) | 8,914 | 0.80% | 0 | 0 | 0 |
| Jeb Bush (withdrawn) | 6,508 | 0.59% | 0 | 0 | 0 |
| Marco Rubio (withdrawn) | 5,175 | 0.47% | 0 | 0 | 0 |
| Rand Paul (withdrawn) | 4,306 | 0.39% | 0 | 0 | 0 |
| Chris Christie (withdrawn) | 1,738 | 0.16% | 0 | 0 | 0 |
| Carly Fiorina (withdrawn) | 1,494 | 0.13% | 0 | 0 | 0 |
| Unprojected delegates: | 0 | 0 | 0 | ||
| Total: | 1,110,543 | 100.00% | 57 | 0 | 57 |
| Source: The Green Papers | |||||
Polling
Analysis
.jpg)
Of the 2,757,965 votes cast, Donald Trump won 1,557,286 votes as Hillary Clinton won 1,033,126 votes.[1]
Indiana has historically been the most conservative state in the Rust Belt. It went Democratic for Barack Obama in 2008—the first time it had done so since 1964, and only the fourth time since 1912. However, it has shifted back to being solidly Republican. Republican nominee Donald Trump carried the state by 19 points over Democrat Hillary Clinton,[9] thus gaining all of Indiana's 11 electoral votes.
Donald Trump's victory in the Hoosier State can be attributed to several factors. For one, Donald Trump had selected Indiana governor Mike Pence as his running mate, effectively eliminating any chance that Clinton could repeat Obama's surprise upset win in the state over John McCain eight years prior. Also, the state skews whiter and more Evangelical Protestant than the rest of the Midwest and the Rust Belt overall, which is a better demographic make-up for Republicans; Trump won white born-agains and evangelicals by a margin of 75–22.[10]
Suburban communities in the "doughnut counties" surrounding Indianapolis lean heavily Republican, and bolstered the Trump-Pence ticket in the state. Many of these voters are both fiscally and socially conservative. Another GOP stronghold that benefited Trump was the northeast region around Fort Wayne, which is a mix of suburban, exurban and rural areas, and is home to some of the most socially conservative voters in the nation.
In Southern Indiana along the Ohio River, especially around Evansville in Vanderburgh County, the electorate is dominated by "Butternut Democrats:" socially conservative, working-class white voters who were Democrats for generations but have been trending Republican in reaction to the increased social liberalism of national Democrats.[11] Such voters turned out for Trump in full force, inspired by his economic populism and by Pence's social conservatism.
Trump also won in Vigo County, home to Terre Haute and a noted bellwether; it has voted for the winner of every presidential election all but twice since 1892.
Clinton, for her part, performed well in Indianapolis in Marion County and in Gary in Lake County, which has a large African American population and is considered part of the Chicago Metropolitan Area. Clinton won African Americans by a margin of 83–12. She also won St. Joseph and Monroe counties, home to the University of Notre Dame and Indiana University, respectively. Areas where Clinton improved on Obama’s performance in 2012 were predominantly located in well-educated suburbs of Indianapolis and areas surrounding large universities, where several socially moderate Republicans chose not to vote for Trump out of discomfort for his controversial views on race and women.
See also
References
- "2016 Presidential General Election Results".
- Chalian, David (4 November 2016). "Road to 270: CNN's new election map". CNN. Retrieved 12 February 2019.
- "2016 Electoral Scorecard". The Cook Political Report. 7 November 2016. Retrieved 12 February 2019.
- "2016 Predicted Electoral Map". Electoral-vote.com. Retrieved 12 February 2019.
- Todd, Chuck (7 November 2016). "NBC's final battleground map shows a lead for Clinton". NBC News. Retrieved 12 February 2019.
- "2016 Election Maps - Battle for White House". RealClearPolitics. Retrieved 12 February 2019.
- Sabato, Larry (7 November 2016). "The Crystal Ball's 2016 Electoral College ratings". University of Virginia Center for Politics. Retrieved 12 February 2019.
- Daily Kos Elections' presidential results by congressional district for 2016, 2012, and 2008 Retrieved 1 March 2020.
- "Indiana Election Results 2016". New York Times. Retrieved 2016-11-12.
- "2016 election results: Indiana Exit polls". CNN. Retrieved 2016-11-12.
- Cohen, Micah (2012-10-19). "After Brief Role as Battleground, Indiana Exits, Stage Right". FiveThirtyEight. Retrieved 2016-11-12.