Plymouth County, Iowa
Coordinates: 42°44′18″N 96°13′13″W / 42.73833°N 96.22028°W
| Plymouth County, Iowa | |
|---|---|
 | |
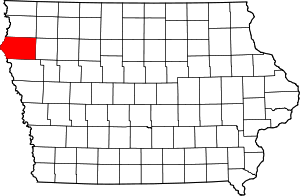 Location in the U.S. state of Iowa | |
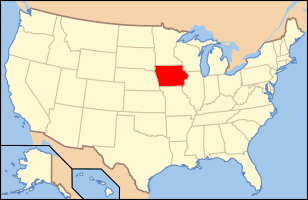 Iowa's location in the U.S. | |
| Founded | 15 January 1851 |
| Seat | Le Mars |
| Largest city | Le Mars |
| Area | |
| • Total | 864 sq mi (2,238 km2) |
| • Land | 863 sq mi (2,235 km2) |
| • Water | 0.8 sq mi (2 km2), 0.1% |
| Population | |
| • (2010) | 24,986 |
| • Density | 29/sq mi (11/km2) |
| Congressional district | 4th |
| Time zone | Central: UTC−6/−5 |
| Website |
www |
Plymouth County is a county located in the U.S. state of Iowa. As of the 2010 census, the population was 24,986.[1] The county seat is Le Mars.[2] Plymouth County was named after Plymouth, Massachusetts.[3]
Plymouth County is part of the Sioux City, IA-NE-SD Metropolitan Statistical Area.
History
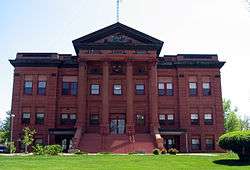
Plymouth County was formed on January 15, 1851. Settlement began in the county in 1856. In October 1859, the first courthouse was built in Melbourne, formerly located in the southeast quarter of section 34, Plymouth Township, about five to six miles due south of Merrill.[4] The first public school opened its doors there with 32 pupils. In 1872 the county seat was moved to Le Mars and a courthouse and jail were built there in 1873. The present Plymouth County courthouse was built in 1900 of red sandstone.[5]
During the Great Depression, farmers in the county organized the Farmers Holiday Group, to keep farm products off the market until the desired price was met. A radical group among them abducted Judge Bradley from his court chamber and threatened to hang him in the front of the courthouse. Bradley was freed, but the governor ordered the national guard to Plymouth County and declared a state of emergency, which effectively ended the group.[5][6]
Geography
According to the U.S. Census Bureau, the county has a total area of 864 square miles (2,240 km2), of which 863 square miles (2,240 km2) is land and 0.8 square miles (2.1 km2) (0.1%) is water.[7] It is the fourth-largest county by area in Iowa.
Adjacent counties
- Sioux County (north)
- Cherokee County (east)
- Woodbury County (south)
- Union County, South Dakota (west)
Transportation
Major highways
Airport
Le Mars Municipal Airport is located in Plymouth County, two nautical miles (3.7 km) southwest of the central business district of Le Mars, Iowa.
Demographics
| Historical population | |||
|---|---|---|---|
| Census | Pop. | %± | |
| 1860 | 148 | — | |
| 1870 | 2,199 | 1,385.8% | |
| 1880 | 8,566 | 289.5% | |
| 1890 | 19,568 | 128.4% | |
| 1900 | 22,209 | 13.5% | |
| 1910 | 23,129 | 4.1% | |
| 1920 | 23,584 | 2.0% | |
| 1930 | 24,159 | 2.4% | |
| 1940 | 23,502 | −2.7% | |
| 1950 | 23,252 | −1.1% | |
| 1960 | 23,906 | 2.8% | |
| 1970 | 24,322 | 1.7% | |
| 1980 | 24,743 | 1.7% | |
| 1990 | 23,388 | −5.5% | |
| 2000 | 24,849 | 6.2% | |
| 2010 | 24,986 | 0.6% | |
| Est. 2016 | 25,200 | [8] | 0.9% |
| U.S. Decennial Census[9] 1790-1960[10] 1900-1990[11] 1990-2000[12] 2010-2013[1] | |||
2010 census
The 2010 census recorded a population of 24,986 in the county, with a population density of 28.9337/sq mi (11.17137/km2). There were 10,550 housing units, of which 9,875 were occupied.[13]
2000 census
As of the census[14] of 2000, there were 24,849 people, 9,372 households, and 6,804 families residing in the county. The population density was 29 people per square mile (11/km²). There were 9,880 housing units at an average density of 11 per square mile (4/km²). The racial makeup of the county was 98.16% White, 0.29% Black or African American, 0.14% Native American, 0.27% Asian, 0.06% Pacific Islander, 0.46% from other races, and 0.62% from two or more races. 1.32% of the population were Hispanic or Latino of any race.
There were 9,372 households out of which 35.70% had children under the age of 18 living with them, 63.30% were married couples living together, 6.20% had a female householder with no husband present, and 27.40% were non-families. 24.00% of all households were made up of individuals and 12.00% had someone living alone who was 65 years of age or older. The average household size was 2.61 and the average family size was 3.12.
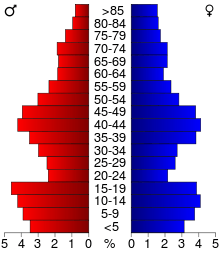
In the county, the population was spread out with 28.30% under the age of 18, 7.20% from 18 to 24, 26.40% from 25 to 44, 22.00% from 45 to 64, and 16.00% who were 65 years of age or older. The median age was 38 years. For every 100 females there were 98.80 males. For every 100 females age 18 and over, there were 95.70 males.
The median income for a household in the county was $41,638, and the median income for a family was $50,009. Males had a median income of $33,566 versus $22,558 for females. The per capita income for the county was $19,442. About 4.40% of families and 6.00% of the population were below the poverty line, including 6.70% of those under age 18 and 6.40% of those age 65 or over.
Points of interest
The Pappas Telecasting Tower, with a height of 603.5 metres (1,980 ft), is one of the tallest masts in the world.
Notable natives
- Ralph Klemme, Iowa state legislator and farmer
- Jim Nicholson Former Secretary of Veterans Affairs, Republican National Chairman and U.S. Ambassador to the Vatican
- Paul Rust actor and comedian
- Thomas Starzl, innovator in organ transplant surgery
- Isaac S. Struble, Congressman (1883–1891) for whom Struble is named
- William Garner Waddel, South Dakota State Senator
Communities
Cities
Unincorporated communities
- Adaville
- Brookdale
- Crathorne
- James
- Mammen
- Milnerville
- Neptune
- O'Leary
- Plymouth
- Potosia
- Ruble
- Seney
- Union Center (Also known as "The U")
- West Le Mars
- Wren
- Yeomans
Townships
Population ranking
The population ranking of the following table is based on the 2010 census of Plymouth County.[15]
† county seat
| Rank | City/Town/etc. | Municipal type | Population (2010 Census)
|
|---|---|---|---|
| 1 | Sioux City (almost entirely in Woodbury County) | City | 82,684 |
| 2 | † Le Mars | City | 9,826 |
| 3 | Remsen | City | 1,663 |
| 4 | Akron | City | 1,486 |
| 5 | Kingsley | City | 1,411 |
| 6 | Hinton | City | 928 |
| 7 | Merrill | City | 755 |
| 8 | Brunsville | City | 151 |
| 9 | Westfield | City | 132 |
| 10 | Oyens | City | 103 |
| 11 | Craig | City | 89 |
| 12 | Struble | City | 78 |
Politics
| Year | Republican | Democratic | Third Parties |
|---|---|---|---|
| 2016 | 73.4% 9,680 | 21.9% 2,885 | 4.7% 625 |
| 2012 | 66.4% 8,597 | 32.2% 4,164 | 1.5% 189 |
| 2008 | 62.1% 7,765 | 37.0% 4,629 | 1.0% 121 |
| 2004 | 63.9% 7,810 | 35.0% 4,278 | 1.1% 134 |
| 2000 | 61.2% 6,189 | 34.6% 3,499 | 4.3% 430 |
| 1996 | 51.4% 5,117 | 37.6% 3,745 | 11.0% 1,094 |
| 1992 | 49.6% 5,196 | 30.3% 3,171 | 20.2% 2,117 |
| 1988 | 55.3% 5,316 | 43.9% 4,220 | 0.7% 71 |
| 1984 | 64.7% 6,482 | 34.6% 3,464 | 0.8% 81 |
| 1980 | 63.0% 6,515 | 28.7% 2,965 | 8.4% 866 |
| 1976 | 55.8% 5,590 | 42.8% 4,284 | 1.4% 142 |
| 1972 | 60.6% 6,339 | 38.5% 4,033 | 0.9% 94 |
| 1968 | 62.1% 6,236 | 32.2% 3,234 | 5.7% 567 |
| 1964 | 46.4% 4,920 | 53.6% 5,691 | 0.0% 2 |
| 1960 | 57.9% 6,432 | 42.1% 4,671 | 0.0% 0 |
| 1956 | 67.4% 7,246 | 32.6% 3,502 | 0.0% 0 |
| 1952 | 74.3% 8,140 | 25.3% 2,768 | 0.5% 49 |
| 1948 | 53.1% 5,002 | 46.1% 4,339 | 0.8% 75 |
| 1944 | 67.0% 6,085 | 32.7% 2,970 | 0.2% 21 |
| 1940 | 66.7% 7,725 | 33.1% 3,831 | 0.2% 23 |
| 1936 | 36.1% 4,133 | 52.4% 5,994 | 11.5% 1,318 |
| 1932 | 27.3% 2,888 | 71.6% 7,565 | 1.0% 110 |
| 1928 | 49.0% 4,848 | 50.7% 5,015 | 0.3% 34 |
| 1924 | 42.1% 3,803 | 17.8% 1,605 | 40.2% 3,628 |
| 1920 | 76.2% 6,090 | 22.5% 1,801 | 1.3% 105 |
| 1916 | 53.1% 2,666 | 45.0% 2,258 | 1.9% 93 |
| 1912 | 16.7% 825 | 41.2% 2,038 | 42.1% 2,079[17] |
| 1908 | 53.2% 2,622 | 44.0% 2,168 | 2.8% 140 |
| 1904 | 61.5% 2,905 | 35.2% 1,663 | 3.3% 158 |
| 1900 | 53.0% 2,712 | 45.1% 2,307 | 1.9% 95 |
| 1896 | 51.4% 2,623 | 46.9% 2,392 | 1.7% 88 |
See also
References
- 1 2 "State & County QuickFacts". United States Census Bureau. Retrieved 20 July 2014.
- ↑ "Find a County". National Association of Counties. Retrieved 7 June 2011.
- ↑ Chicago and North Western Railway Company (1908). A History of the Origin of the Place Names Connected with the Chicago & North Western and Chicago, St. Paul, Minneapolis & Omaha Railways. p. 163.
- ↑ History of the Counties of Woodbury and Plymouth, Iowa. Chicago: A. Warner & Co. 1890. p. 434.
|access-date=requires|url=(help) - 1 2 "Historical Facts About Plymouth County". Retrieved 29 November 2012.
- ↑ "Martial Law at Le Mars". Dubuque Telegraph-Herald. 28 April 1933. p. 1. Retrieved 29 November 2012.
- ↑ "US Gazetteer files: 2010, 2000, and 1990". United States Census Bureau. 12 February 2011. Retrieved 23 April 2011.
- ↑ "Population and Housing Unit Estimates". Retrieved 9 June 2017.
- ↑ "U.S. Decennial Census". United States Census Bureau. Retrieved 20 July 2014.
- ↑ "Historical Census Browser". University of Virginia Library. Retrieved 20 July 2014.
- ↑ "Population of Counties by Decennial Census: 1900 to 1990". United States Census Bureau. Retrieved 20 July 2014.
- ↑ "Census 2000 PHC-T-4. Ranking Tables for Counties: 1990 and 2000" (PDF). United States Census Bureau. Retrieved 20 July 2014.
- ↑ "Population & Housing Occupancy Status 2010". United States Census Bureau – American FactFinder. Retrieved 1 June 2011.
- ↑ "American FactFinder". United States Census Bureau. Retrieved 31 January 2008.
- ↑ 2010 Census
- ↑ Leip, David. "Dave Leip's Atlas of U.S. Presidential Elections". uselectionatlas.org. Retrieved 27 April 2018.
- ↑ The leading "other" candidate, Progressive Theodore Roosevelt, received 2,005 votes, while Socialist candidate Eugene Debs received 46 votes, Prohibition candidate Eugene Chafin received 28 votes.
External links
| Wikimedia Commons has media related to Plymouth County, Iowa. |
- Plymouth County Iowa Official website
Places adjacent to Plymouth County, Iowa | ||||||||||
|---|---|---|---|---|---|---|---|---|---|---|
| ||||||||||
Municipalities and communities of Plymouth County, Iowa, United States | ||
|---|---|---|
| Cities | ||
| Unincorporated communities | ||
| Footnotes | ‡This populated place also has portions in an adjacent county or counties | |