Benton County, Iowa
| Benton County, Iowa | |
|---|---|
 | |
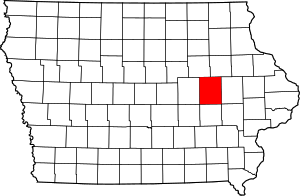 Location in the U.S. state of Iowa | |
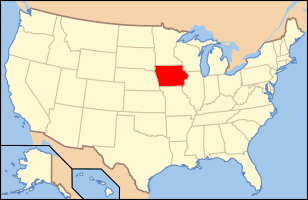 Iowa's location in the U.S. | |
| Founded | 1837 |
| Named for | Thomas Hart Benton |
| Seat | Vinton |
| Largest city | Vinton |
| Area | |
| • Total | 718 sq mi (1,860 km2) |
| • Land | 716 sq mi (1,854 km2) |
| • Water | 2.2 sq mi (6 km2), 0.3% |
| Population | |
| • (2010) | 26,076 |
| • Density | 36/sq mi (14/km2) |
| Congressional district | 1st |
| Time zone | Central: UTC−6/−5 |
| Website |
www |
Benton County is a county in the U.S. state of Iowa. As of the 2010 census, the population was 26,076.[1] Its county seat is Vinton.[2] The county is named for Thomas Hart Benton, a U.S. Senator from Missouri.
Benton County is part of the Cedar Rapids, IA Metropolitan Statistical Area.[3]
History
Benton County was formed on December 21, 1837 from sections of Dubuque County. It was named after US Senator Thomas Hart Benton.[4]
Geography
According to the U.S. Census Bureau, the county has a total area of 718 square miles (1,860 km2), of which 716 square miles (1,850 km2) is land and 2.2 square miles (5.7 km2) (0.3%) is water.[5]
Major highways
Adjacent counties
- Black Hawk County (northwest)
- Buchanan County (northeast)
- Linn County (east)
- Iowa County (south)
- Tama County (west)
Demographics
| Historical population | |||
|---|---|---|---|
| Census | Pop. | %± | |
| 1850 | 672 | — | |
| 1860 | 8,496 | 1,164.3% | |
| 1870 | 22,454 | 164.3% | |
| 1880 | 24,888 | 10.8% | |
| 1890 | 24,178 | −2.9% | |
| 1900 | 25,177 | 4.1% | |
| 1910 | 23,156 | −8.0% | |
| 1920 | 24,080 | 4.0% | |
| 1930 | 22,851 | −5.1% | |
| 1940 | 22,879 | 0.1% | |
| 1950 | 22,656 | −1.0% | |
| 1960 | 23,422 | 3.4% | |
| 1970 | 22,885 | −2.3% | |
| 1980 | 23,649 | 3.3% | |
| 1990 | 22,429 | −5.2% | |
| 2000 | 25,308 | 12.8% | |
| 2010 | 26,076 | 3.0% | |
| Est. 2016 | 25,699 | [6] | −1.4% |
| U.S. Decennial Census[7] 1790-1960[8] 1900-1990[9] 1990-2000[10] 2010-2013[1] | |||
2010 census
The 2010 census recorded a population of 26,076 in the county, with a population density of 36.419/sq mi (14.061/km2). There were 11,095 housing units, of which 10,302 were occupied.[11]
2000 census
As of the census[12] of 2000, there were 25,308 people, 9,746 households, and 7,056 families residing in the county. The population density was 35 people per square mile (14/km²). There were 10,377 housing units at an average density of 14 per square mile (6/km²). The racial makeup of the county was 98.84% White, 0.20% Black or African American, 0.15% Native American, 0.17% Asian, 0.02% Pacific Islander, 0.11% from other races, and 0.52% from two or more races. 0.62% of the population were Hispanic or Latino of any race.
There were 9,746 households out of which 34.90% had children under the age of 18 living with them, 62.70% were married couples living together, 6.5% had a female householder with no husband present, and 27.6% were non-families. 23.4% of all households were made up of individuals and 11.70% had someone living alone who was 65 years of age or older. The average household size was 2.56 and the average family size was 3.04.
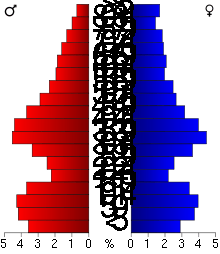
In the county, the population was spread out with 27.4% under the age of 18, 6.8% from 18 to 24, 29.3% from 25 to 44, 21.1% from 45 to 64, and 15.4% who were 65 years of age or older. The median age was 37 years. For every 100 females, there were 100.0 males. For every 100 females age 18 and over, there were 95.8 males.
The median income for a household in the county was $42,427, and the median income for a family was $49,701. Males had a median income of $35,044 versus $23,978 for females. The per capita income for the county was $18,891. About 4.6% of families and 6.1% of the population were below the poverty line, including 7.2% of those under age 18 and 7.0% of those age 65 or over.
Communities
Cities
Townships
Benton County is divided into twenty townships:
Census-designated place
Population ranking
The population ranking of the following table is based on the 2010 census of Benton County.[13]
† county seat
| Rank | City/Town/etc. | Municipal type | Population (2010 Census)
|
|---|---|---|---|
| 1 | † Vinton | City | 5,257 |
| 2 | Belle Plaine | City | 2,534 |
| 3 | Atkins | City | 1,670 |
| 4 | Walford (partially in Linn County) | City | 1,463 |
| 5 | Urbana | City | 1,458 |
| 6 | Shellsburg | City | 983 |
| 7 | Newhall | City | 875 |
| 8 | Blairstown | City | 692 |
| 9 | Van Horne | City | 682 |
| 10 | Keystone | City | 622 |
| 11 | Norway | City | 545 |
| 12 | Garrison | City | 371 |
| 13 | Mount Auburn | City | 150 |
| 14 | Watkins | CDP | 118 |
| 15 | Luzerne | City | 96 |
Politics
| Year | Republican | Democratic | Third Parties |
|---|---|---|---|
| 2016 | 59.5% 8,232 | 33.8% 4,678 | 6.8% 934 |
| 2012 | 49.5% 6,940 | 48.9% 6,862 | 1.6% 221 |
| 2008 | 47.0% 6,447 | 51.5% 7,058 | 1.6% 212 |
| 2004 | 49.3% 6,658 | 50.0% 6,747 | 0.7% 96 |
| 2000 | 46.5% 5,468 | 50.3% 5,915 | 3.3% 383 |
| 1996 | 37.3% 3,835 | 54.0% 5,546 | 8.7% 898 |
| 1992 | 33.2% 3,469 | 42.8% 4,467 | 24.0% 2,503 |
| 1988 | 40.2% 4,011 | 58.9% 5,873 | 0.9% 93 |
| 1984 | 52.1% 5,566 | 46.8% 4,993 | 1.1% 119 |
| 1980 | 50.1% 5,329 | 39.7% 4,223 | 10.2% 1,083 |
| 1976 | 46.9% 5,014 | 51.5% 5,514 | 1.6% 175 |
| 1972 | 54.1% 5,273 | 43.9% 4,282 | 2.0% 194 |
| 1968 | 52.1% 5,016 | 40.9% 3,944 | 7.0% 675 |
| 1964 | 34.2% 3,453 | 65.6% 6,614 | 0.2% 17 |
| 1960 | 56.3% 5,972 | 43.6% 4,620 | 0.1% 9 |
| 1956 | 56.3% 5,634 | 39.4% 3,946 | 4.3% 426 |
| 1952 | 59.1% 6,316 | 35.8% 3,831 | 5.1% 542 |
| 1948 | 45.1% 3,770 | 50.3% 4,209 | 4.6% 388 |
| 1944 | 48.4% 4,378 | 51.1% 4,619 | 0.5% 42 |
| 1940 | 49.6% 5,298 | 50.2% 5,363 | 0.3% 32 |
| 1936 | 41.7% 4,144 | 56.4% 5,606 | 1.9% 184 |
| 1932 | 34.9% 3,424 | 61.8% 6,070 | 3.3% 325 |
| 1928 | 62.7% 5,669 | 36.6% 3,307 | 0.8% 69 |
| 1924 | 58.1% 5,314 | 16.0% 1,459 | 25.9% 2,369 |
| 1920 | 71.0% 6,539 | 25.5% 2,343 | 3.5% 325 |
| 1916 | 54.2% 3,189 | 43.4% 2,556 | 2.4% 143 |
| 1912 | 31.5% 1,831 | 42.6% 2,472 | 25.9% 1,505 |
| 1908 | 55.1% 3,180 | 41.9% 2,418 | 3.0% 175 |
| 1904 | 61.1% 3,609 | 34.8% 2,057 | 4.1% 241 |
| 1900 | 56.9% 3,609 | 40.6% 2,575 | 2.5% 160 |
| 1896 | 57.5% 3,604 | 40.8% 2,560 | 1.7% 104 |
See also
References
- 1 2 "State & County QuickFacts". United States Census Bureau. Retrieved July 13, 2014.
- ↑ "Find a County". National Association of Counties. Archived from the original on 2011-05-31. Retrieved 2011-06-07.
- ↑ United States Office of Management and Budget. "Update of Statistical Area Definitions and Guidance on Their Uses" (PDF). pp. 5, 36. Archived from the original (PDF) on 2006-05-14. Retrieved 2006-07-21.
- ↑ History of the Origin of the Place Names in Nine Northwestern States. 1908. p. 11.
- ↑ "US Gazetteer files: 2010, 2000, and 1990". United States Census Bureau. 2011-02-12. Retrieved 2011-04-23.
- ↑ "Population and Housing Unit Estimates". Retrieved June 9, 2017.
- ↑ "U.S. Decennial Census". United States Census Bureau. Archived from the original on May 12, 2015. Retrieved July 13, 2014.
- ↑ "Historical Census Browser". University of Virginia Library. Retrieved July 13, 2014.
- ↑ "Population of Counties by Decennial Census: 1900 to 1990". United States Census Bureau. Retrieved July 13, 2014.
- ↑ "Census 2000 PHC-T-4. Ranking Tables for Counties: 1990 and 2000" (PDF). United States Census Bureau. Retrieved July 13, 2014.
- ↑ "Population and Housing Occupancy Status: 2010 - State -- County". United States Census Bureau American FactFinder. Retrieved March 6, 2011.
- ↑ "American FactFinder". United States Census Bureau. Archived from the original on 2013-09-11. Retrieved 2008-01-31.
- ↑ "Archived copy". Archived from the original on 2013-12-21. Retrieved 2016-02-13.
- ↑ Leip, David. "Dave Leip's Atlas of U.S. Presidential Elections". uselectionatlas.org. Retrieved 2018-04-25.
Places adjacent to Benton County, Iowa | ||||||||||
|---|---|---|---|---|---|---|---|---|---|---|
| ||||||||||
Municipalities and communities of Benton County, Iowa, United States | ||
|---|---|---|
| Cities | ||
| Townships | ||
| CDP | ||
| Unincorporated communities | ||
| Footnotes | ‡This populated place also has portions in an adjacent county or counties | |

Coordinates: 42°04′47″N 92°04′03″W / 42.07972°N 92.06750°W