Scott County, Iowa
| Scott County, Iowa | ||
|---|---|---|
 | ||
| ||
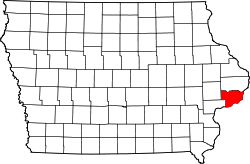 Location in the U.S. state of Iowa | ||
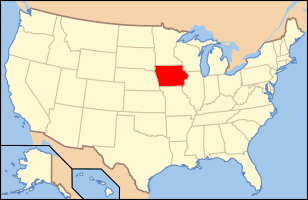 Iowa's location in the U.S. | ||
| Founded | 1837 | |
| Named for | Winfield Scott | |
| Seat | Davenport | |
| Largest city | Davenport | |
| Area | ||
| • Total | 468 sq mi (1,212 km2) | |
| • Land | 458 sq mi (1,186 km2) | |
| • Water | 10 sq mi (26 km2), 2.2% | |
| Population | ||
| • (2010) | 165,224 | |
| • Density | 361/sq mi (139/km2) | |
| Congressional district | 2nd | |
| Time zone | Central: UTC−6/−5 | |
| Website |
www | |

Scott County is a county located in the U.S. state of Iowa. As of the 2010 census, the population was 165,224,[1] making it the third-most populous county in Iowa. The county seat is Davenport.[2]
Scott County is included in the Davenport-Moline-Rock Island, IA-IL Metropolitan Statistical Area.[3]
History
The first American settlement in the area now known as Scott County was Clark's Ferry or Clark's Landing (now Buffalo) in 1833. Other early towns included Davenport (now the county seat and largest city) and the town of Rockingham (which ceased to exist in 1847). The area was fully surveyed in 1837, and the county was established by the Wisconsin territorial legislature in that same year. Scott County is named for General Winfield Scott,[4] who was the presiding officer at the signing of the peace treaty ending the Black Hawk War.
By 1900 the population of the county was 51,500, and by 1950 it was over 100,000. Scott County now comprises part of the Quad City region, which includes the cities of Davenport and Bettendorf (in Iowa) and Rock Island, Moline and East Moline (in Illinois).
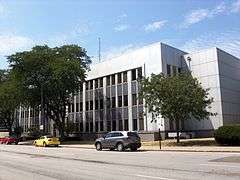
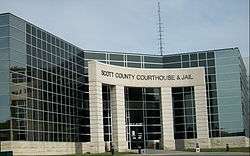
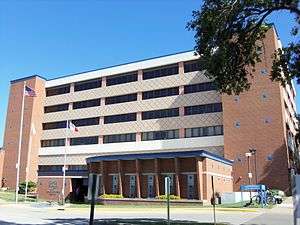
The present Scott County Courthouse was completed in 1955 and expanded along with the jail in 2007.[5][6] The old section of the Scott County Jail was listed on the National Register of Historic Places in 1983.[7]
Geography
According to the U.S. Census Bureau, the county has a total area of 468 square miles (1,210 km2), of which 458 square miles (1,190 km2) is land and 10 square miles (26 km2) (2.2%) is water.[8]
Major highways
Adjacent counties
- Clinton County (north)
- Rock Island County, Illinois (east and south)
- Muscatine County (southwest)
- Cedar County (northwest)
Demographics
| Historical population | |||
|---|---|---|---|
| Census | Pop. | %± | |
| 1850 | 5,986 | — | |
| 1860 | 25,959 | 333.7% | |
| 1870 | 38,599 | 48.7% | |
| 1880 | 41,266 | 6.9% | |
| 1890 | 43,164 | 4.6% | |
| 1900 | 51,558 | 19.4% | |
| 1910 | 60,000 | 16.4% | |
| 1920 | 73,952 | 23.3% | |
| 1930 | 77,332 | 4.6% | |
| 1940 | 84,748 | 9.6% | |
| 1950 | 100,698 | 18.8% | |
| 1960 | 119,067 | 18.2% | |
| 1970 | 142,687 | 19.8% | |
| 1980 | 160,022 | 12.1% | |
| 1990 | 150,973 | −5.7% | |
| 2000 | 158,668 | 5.1% | |
| 2010 | 165,224 | 4.1% | |
| Est. 2017 | 174,509 | [9] | 5.6% |
| U.S. Decennial Census[10] 1790-1960[11] 1900-1990[12] 1990-2000[13] 2010-2013[1] | |||
The US Census Bureau estimated Scott County's population at 170,385 in 2013, fourth fastest-growing out of Iowa’s 99 counties after Dallas County, Iowa, a Western suburb of Des Moines, Iowa, Johnson County, Iowa, Polk County, Iowa, and followed by Warren County, Iowa being the top five.[14]
2010 census
The 2010 (no jobs) census recorded a population of 165,224 in the county, with a population density of 360.806/sq mi (139.3081/km2). There were 71,835 housing units, of which 66,765 were occupied.[15]
2000 census
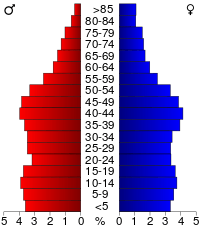
As of the census[16] of 2000, there were 158,668 people, 62,334 households, and 41,888 families residing in the county. The population density was 346 people per square mile (134/km²). There were 65,649 housing units at an average density of 143 per square mile (55/km²). The racial makeup of the county was 88.54% White, 6.11% Black or African American, 0.32% Native American, 1.58% Asian, 0.02% Pacific Islander, 1.64% from other races, and 1.80% from two or more races. 4.06% of the population were Hispanic or Latino of any race.
There were 62,334 households out of which 33.20% had children under the age of 18 living with them, 52.30% were married couples living together, 11.40% had a female householder with no husband present, and 32.80% were non-families. 26.90% of all households were made up of individuals and 9.00% had someone living alone who was 65 years of age or older. The average household size was 2.49 and the average family size was 3.04.
Age spread: 26.50% under the age of 18, 9.30% from 18 to 24, 29.40% from 25 to 44, 23.00% from 45 to 64, and 11.80% who were 65 years of age or older. The median age was 35 years. For every 100 females, there were 95.80 males. For every 100 females age 18 and over, there were 92.50 males.
The median income for a household in the county was $42,701, and the median income for a family was $52,045. Males had a median income of $38,985 versus $25,456 for females. The per capita income for the county was $21,310. About 7.70% of families and 10.50% of the population were below the poverty line, including 13.70% of those under age 18 and 5.80% of those age 65 or over.
Communities
Cities
Census-designated place
Other unincorporated communities
- Big Rock
- Desmond Acres
- Westdale
Townships
Former township
Population ranking
The population ranking of the following table is based on the 2010 census of Scott County.[17]
† county seat
| Rank | City/Town/etc. | Municipal type | Population (2010 Census)
|
|---|---|---|---|
| 1 | † Davenport | City | 99,685 |
| 2 | Bettendorf | City | 33,217 |
| 3 | Eldridge | City | 5,651 |
| 4 | Le Claire | City | 3,765 |
| 5 | Park View | CDP | 2,389 |
| 6 | Durant (partially in Cedar and Muscatine Counties) | City | 1,832 |
| 7 | Walcott (partially in Muscatine County) | City | 1,629 |
| 8 | Blue Grass (partially in Muscatine County) | City | 1,452 |
| 9 | Buffalo | City | 1,270 |
| 10 | Princeton | City | 886 |
| 11 | Long Grove | City | 808 |
| 12 | Riverdale | City | 405 |
| 13 | Donahue | City | 346 |
| 14 | McCausland | City | 291 |
| 15 | Dixon | City | 247 |
| 16 | Maysville | City | 176 |
| 17 | New Liberty | City | 137 |
| 18 | Panorama Park | City | 129 |
| 19 | Desmond Acres | City | 97 |
Politics
Scott County was traditionally a Republican county, but has trended Democratic in the last three decades.
| Year | Republican | Democratic | Third Parties |
|---|---|---|---|
| 2016 | 45.4% 39,149 | 46.9% 40,440 | 7.7% 6,631 |
| 2012 | 42.4% 38,251 | 56.1% 50,652 | 1.5% 1,360 |
| 2008 | 42.1% 36,365 | 56.6% 48,927 | 1.3% 1,086 |
| 2004 | 48.3% 39,958 | 50.9% 42,122 | 0.8% 642 |
| 2000 | 46.5% 32,801 | 50.8% 35,857 | 2.7% 1,910 |
| 1996 | 41.0% 26,751 | 50.1% 32,694 | 8.8% 5,757 |
| 1992 | 38.6% 28,844 | 45.2% 33,765 | 16.1% 12,053 |
| 1988 | 47.0% 31,025 | 52.1% 34,415 | 0.9% 595 |
| 1984 | 53.4% 38,034 | 45.7% 32,550 | 0.9% 628 |
| 1980 | 51.1% 34,701 | 38.9% 26,391 | 10.1% 6,834 |
| 1976 | 53.1% 35,021 | 45.2% 29,771 | 1.7% 1,148 |
| 1972 | 57.4% 34,135 | 40.1% 23,810 | 2.5% 1,510 |
| 1968 | 46.9% 25,783 | 44.7% 24,596 | 8.4% 4,639 |
| 1964 | 38.1% 19,488 | 61.7% 31,526 | 0.2% 84 |
| 1960 | 54.5% 27,617 | 45.4% 23,004 | 0.1% 50 |
| 1956 | 59.4% 27,965 | 40.3% 18,969 | 0.4% 170 |
| 1952 | 61.9% 29,719 | 37.1% 17,807 | 1.0% 500 |
| 1948 | 49.4% 16,842 | 48.9% 16,661 | 1.7% 578 |
| 1944 | 48.6% 18,015 | 51.1% 18,962 | 0.3% 104 |
| 1940 | 46.7% 18,504 | 53.0% 20,996 | 0.3% 130 |
| 1936 | 37.2% 12,691 | 60.7% 20,737 | 2.1% 717 |
| 1932 | 43.8% 14,218 | 52.0% 16,887 | 4.2% 1,350 |
| 1928 | 56.5% 16,974 | 43.1% 12,942 | 0.5% 142 |
| 1924 | 60.3% 18,360 | 14.3% 4,347 | 25.4% 7,731 |
| 1920 | 58.8% 16,233 | 19.8% 5,473 | 21.4% 5,925 |
| 1916 | 56.4% 8,329 | 35.3% 5,212 | 8.3% 1,229 |
| 1912 | 11.5% 1,568 | 41.2% 5,632 | 47.4% 6,479[lower-alpha 1] |
| 1908 | 50.8% 6,845 | 43.3% 5,845 | 5.9% 799 |
| 1904 | 52.0% 6,789 | 37.7% 4,931 | 10.3% 1,346 |
| 1900 | 52.1% 6,327 | 42.4% 5,157 | 5.5% 671 |
| 1896 | 58.7% 6,419 | 36.9% 4,032 | 4.4% 479 |
See also
Notes
- ↑ The leading "other" candidate, Progressive Theodore Roosevelt, received 4,977 votes, while Socialist candidate Eugene Debs received 1,444 votes, Prohibition candidate Eugene Chafin received 58 votes.
References
- 1 2 "State & County QuickFacts". United States Census Bureau. Retrieved July 20, 2014.
- ↑ "Find a County". National Association of Counties. Retrieved 2011-06-07.
- ↑ United States Office of Management and Budget. "Update of Statistical Area Definitions and Guidance on Their Uses" (PDF). pp. 5, 36. Archived from the original (PDF) on 2006-05-14. Retrieved 2006-07-21.
- ↑ "Scott County History". scottcountyiowa.com. 3 June 2015. Retrieved 6 April 2018.
- ↑ "Scott County Courthouse". Iowa Judicial Branch. Archived from the original on 2011-07-26. Retrieved 2011-02-10.
- ↑ Allemeier, Scott. "Scott County opens new jail to the public". Quad-City Times (November 16, 2007). Retrieved 2011-02-10.
- ↑ National Park Service (2009-03-13). "National Register Information System". National Register of Historic Places. National Park Service.
- ↑ "US Gazetteer files: 2010, 2000, and 1990". United States Census Bureau. 2011-02-12. Retrieved 2011-04-23.
- ↑ "Population and Housing Unit Estimates". Retrieved June 9, 2017.
- ↑ "U.S. Decennial Census". United States Census Bureau. Retrieved July 20, 2014.
- ↑ "Historical Census Browser". University of Virginia Library. Retrieved July 20, 2014.
- ↑ "Population of Counties by Decennial Census: 1900 to 1990". United States Census Bureau. Retrieved July 20, 2014.
- ↑ "Census 2000 PHC-T-4. Ranking Tables for Counties: 1990 and 2000" (PDF). United States Census Bureau. Retrieved July 20, 2014.
- ↑ "Annual Estimates of the Resident Population: April 1, 2010 to July 1, 2013". U.S. Census Bureau, Population Division. March 2014. Retrieved 2 April 2014.
- ↑ "Population & Housing Occupancy Status 2010". United States Census Bureau American FactFinder. Retrieved 2011-06-02.
- ↑ "American FactFinder". United States Census Bureau. Retrieved 2008-01-31.
- ↑ Promotions, Center for New Media and. "US Census Bureau 2010 Census". www.census.gov. Retrieved 6 April 2018.
- ↑ Leip, David. "Dave Leip's Atlas of U.S. Presidential Elections". uselectionatlas.org. Retrieved 6 April 2018.
External links
| Wikimedia Commons has media related to Scott County, Iowa. |
Coordinates: 41°38′09″N 90°38′02″W / 41.63583°N 90.63389°W
Places adjacent to Scott County, Iowa | |
|---|---|
Municipalities and communities of Scott County, Iowa, United States | ||
|---|---|---|
| Cities | ||
| Townships | ||
| CDP | ||
| Unincorporated community |
| |
| Footnotes | ‡This populated place also has portions in an adjacent county or counties | |