Keokuk County, Iowa
| Keokuk County, Iowa | |
|---|---|
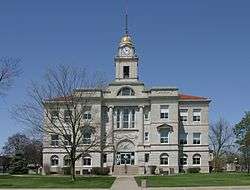 Courthouse in Sigourney is on the NRHP | |
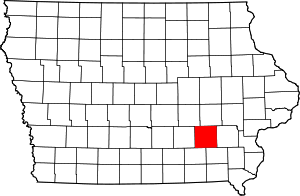 Location in the U.S. state of Iowa | |
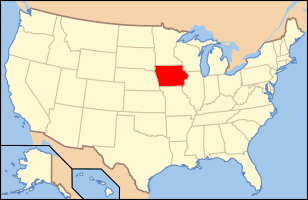 Iowa's location in the U.S. | |
| Founded | 17 February 1843 |
| Named for | Keokuk |
| Seat | Sigourney |
| Largest city | Sigourney |
| Area | |
| • Total | 580 sq mi (1,502 km2) |
| • Land | 579 sq mi (1,500 km2) |
| • Water | 0.7 sq mi (2 km2), 0.1% |
| Population | |
| • (2010) | 10,511 |
| • Density | 18/sq mi (7/km2) |
| Congressional district | 2nd |
| Time zone | Central: UTC−6/−5 |
| Website |
[http://[www.keokukcountyia.com%20Keokuk%20County] [www |
Keokuk County is a county located in the U.S. state of Iowa. As of the 2010 census, the population was 10,511.[1] The county seat is Sigourney.[2]
History
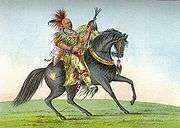
Keokuk County was formed in 1837. It was named for the eponymous chief of the Sac Indians, who advocated peace with the white settlers. In May 1843, the county opened for public settlement and was self-governed from 1844. Previously it was governed by Washington County. After a debate lasting a few years for the location for the county seat, the right went to Sigourney in 1856.[3]
Keokuk County is unusual in that it has two county fairs. The Keokuk County Fair is held in What Cheer[4] and immediately followed by the Keokuk County Expo[5] which is held in Sigourney.
The Keokuk County Courthouse in Sigourney was built in 1911. It has been listed on the National Register of Historic Places since 1981.[6]
Geography
According to the U.S. Census Bureau, the county has a total area of 580 square miles (1,500 km2), of which 579 square miles (1,500 km2) is land and 0.7 square miles (1.8 km2) (0.1%) is water.[7]
Major highways
Adjacent counties
- Poweshiek County (northwest)
- Iowa County (north)
- Washington County (east)
- Jefferson County (southeast)
- Wapello County (southwest)
- Mahaska County (west)
Demographics
| Historical population | |||
|---|---|---|---|
| Census | Pop. | %± | |
| 1850 | 4,822 | — | |
| 1860 | 13,271 | 175.2% | |
| 1870 | 19,434 | 46.4% | |
| 1880 | 21,258 | 9.4% | |
| 1890 | 23,862 | 12.2% | |
| 1900 | 24,979 | 4.7% | |
| 1910 | 21,160 | −15.3% | |
| 1920 | 20,983 | −0.8% | |
| 1930 | 19,148 | −8.7% | |
| 1940 | 18,406 | −3.9% | |
| 1950 | 16,797 | −8.7% | |
| 1960 | 15,492 | −7.8% | |
| 1970 | 13,943 | −10.0% | |
| 1980 | 12,921 | −7.3% | |
| 1990 | 11,624 | −10.0% | |
| 2000 | 11,400 | −1.9% | |
| 2010 | 10,511 | −7.8% | |
| Est. 2016 | 10,119 | [8] | −3.7% |
| U.S. Decennial Census[9] 1790-1960[10] 1900-1990[11] 1990-2000[12] 2010-2013[1] | |||
2010 census
The 2010 census recorded a population of 10,511 in the county, with a population density of 18.1478/sq mi (7.0069/km2). There were 4,931 housing units, of which 4,408 were occupied.[13]
2000 census
As of the census[14] of 2000, there were 11,400 people, 4,586 households, and 3,155 families residing in the county. The population density was 20 people per square mile (8/km²). There were 5,013 housing units at an average density of 9 per square mile (3/km²). The racial makeup of the county was 99.00% White, 0.07% Black or African American, 0.11% Native American, 0.23% Asian, 0.02% Pacific Islander, 0.21% from other races, and 0.36% from two or more races. 0.54% of the population were Hispanic or Latino of any race.
There were 4,586 households out of which 30.50% had children under the age of 18 living with them, 59.00% were married couples living together, 6.50% had a female householder with no husband present, and 31.20% were non-families. 27.80% of all households were made up of individuals and 15.80% had someone living alone who was 65 years of age or older. The average household size was 2.45 and the average family size was 2.99.
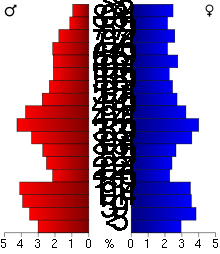
In the county, the population was spread out with 25.70% under the age of 18, 7.00% from 18 to 24, 25.50% from 25 to 44, 21.60% from 45 to 64, and 20.20% who were 65 years of age or older. The median age was 40 years. For every 100 females there were 94.10 males. For every 100 females age 18 and over, there were 91.80 males.
The median income for a household in the county was $34,025, and the median income for a family was $41,818. Males had a median income of $28,306 versus $22,083 for females. The per capita income for the county was $17,120. About 7.50% of families and 10.10% of the population were below the poverty line, including 12.90% of those under age 18 and 10.50% of those age 65 or over.
Communities
Cities
Townships
- Adams
- Benton
- Clear Creek
- East Lancaster
- English River
- Jackson
- Lafayette
- Liberty
- Plank
- Prairie
- Richland
- Sigourney
- Steady Run
- Van Buren
- Warren
- Washington
- West Lancaster
Population ranking
The population ranking of the following table is based on the 2010 census of Keokuk County.[15]
† county seat
| Rank | City/Town/etc. | Municipal type | Population (2010 Census)
|
|---|---|---|---|
| 1 | † Sigourney | City | 2,059 |
| 2 | North English (mostly in Iowa County) | City | 1,041 |
| 3 | Keota | City | 1,009 |
| 4 | Hedrick | City | 764 |
| 5 | What Cheer | City | 646 |
| 6 | Richland | City | 584 |
| 7 | Keswick | City | 246 |
| 8 | Ollie | City | 215 |
| 9 | South English | City | 212 |
| 10 | Harper | City | 114 |
| 11 | Martinsburg | City | 112 |
| 12 | Webster | City | 88 |
| 13 | Kinross | City | 73 |
| 14 | Thornburg | City | 67 |
| 15 | Hayesville | City | 50 |
Politics
| Year | Republican | Democratic | Third Parties |
|---|---|---|---|
| 2016 | 68.0% 3,390 | 26.9% 1,342 | 5.1% 253 |
| 2012 | 54.0% 2,843 | 43.7% 2,303 | 2.3% 120 |
| 2008 | 50.6% 2,712 | 47.0% 2,518 | 2.5% 132 |
| 2004 | 56.9% 3,119 | 41.9% 2,294 | 1.2% 67 |
| 2000 | 52.0% 2,571 | 44.1% 2,181 | 3.9% 195 |
| 1996 | 40.8% 2,080 | 49.9% 2,545 | 9.3% 476 |
| 1992 | 35.5% 1,981 | 41.8% 2,329 | 22.7% 1,267 |
| 1988 | 43.6% 2,278 | 55.4% 2,899 | 1.0% 53 |
| 1984 | 51.5% 2,913 | 46.8% 2,649 | 1.7% 94 |
| 1980 | 52.6% 3,145 | 40.0% 2,390 | 7.4% 440 |
| 1976 | 44.9% 2,920 | 53.5% 3,482 | 1.6% 102 |
| 1972 | 58.4% 3,831 | 39.9% 2,619 | 1.8% 115 |
| 1968 | 53.3% 3,588 | 41.7% 2,807 | 5.1% 342 |
| 1964 | 35.1% 2,597 | 64.7% 4,790 | 0.2% 17 |
| 1960 | 57.9% 4,697 | 42.0% 3,408 | 0.1% 10 |
| 1956 | 56.1% 4,680 | 43.8% 3,649 | 0.1% 9 |
| 1952 | 64.2% 5,712 | 35.2% 3,135 | 0.6% 50 |
| 1948 | 49.6% 4,201 | 48.6% 4,118 | 1.8% 156 |
| 1944 | 54.0% 4,644 | 45.3% 3,900 | 0.7% 62 |
| 1940 | 54.0% 5,394 | 45.6% 4,552 | 0.4% 42 |
| 1936 | 45.5% 4,491 | 52.3% 5,162 | 2.3% 225 |
| 1932 | 36.7% 3,442 | 62.3% 5,839 | 0.9% 88 |
| 1928 | 58.2% 5,304 | 41.4% 3,772 | 0.4% 32 |
| 1924 | 51.4% 4,795 | 27.5% 2,568 | 21.1% 1,973 |
| 1920 | 68.0% 6,207 | 30.7% 2,800 | 1.4% 128 |
| 1916 | 52.2% 2,822 | 46.0% 2,486 | 1.9% 100 |
| 1912 | 26.1% 1,361 | 46.6% 2,434 | 27.3% 1,425 |
| 1908 | 50.7% 2,728 | 45.7% 2,459 | 3.6% 193 |
| 1904 | 55.8% 3,079 | 39.4% 2,172 | 4.8% 265 |
| 1900 | 54.3% 3,339 | 43.4% 2,669 | 2.3% 139 |
| 1896 | 50.7% 3,166 | 46.3% 2,891 | 3.0% 185 |
See also
References
- 1 2 "State & County QuickFacts". United States Census Bureau. Archived from the original on 13 July 2011. Retrieved 18 July 2014.
- ↑ "Find a County". National Association of Counties. Archived from the original on 31 May 2011. Retrieved 7 June 2011.
- ↑ Keokuk County History
- ↑ Keokuk County Fair
- ↑ Keokuk County Expo
- ↑ National Park Service (2009-03-13). "National Register Information System". National Register of Historic Places. National Park Service.
- ↑ "US Gazetteer files: 2010, 2000, and 1990". United States Census Bureau. 12 February 2011. Retrieved 23 April 2011.
- ↑ "Population and Housing Unit Estimates". Retrieved 9 June 2017.
- ↑ "U.S. Decennial Census". United States Census Bureau. Archived from the original on 12 May 2015. Retrieved 18 July 2014.
- ↑ "Historical Census Browser". University of Virginia Library. Retrieved 18 July 2014.
- ↑ "Population of Counties by Decennial Census: 1900 to 1990". United States Census Bureau. Retrieved 18 July 2014.
- ↑ "Census 2000 PHC-T-4. Ranking Tables for Counties: 1990 and 2000" (PDF). United States Census Bureau. Retrieved 18 July 2014.
- ↑ "Population & Housing Occupancy Status 2010". United States Census Bureau – American FactFinder. Retrieved 19 May 2011.
- ↑ "American FactFinder". United States Census Bureau. Retrieved 31 January 2008.
- ↑ "Archived copy". Archived from the original on 21 December 2013. Retrieved 10 July 2016.
- ↑ Leip, David. "Dave Leip's Atlas of U.S. Presidential Elections". uselectionatlas.org. Retrieved 26 April 2018.
External links
| Wikimedia Commons has media related to Keokuk County, Iowa. |
Places adjacent to Keokuk County, Iowa | ||||||||||
|---|---|---|---|---|---|---|---|---|---|---|
| ||||||||||
Municipalities and communities of Keokuk County, Iowa, United States | ||
|---|---|---|
| Cities | ||
| Unincorporated communities | ||
| Footnotes | ‡This populated place also has portions in an adjacent county or counties | |

Coordinates: 41°20′10″N 92°10′47″W / 41.33611°N 92.17972°W