Appanoose County, Iowa
| Appanoose County, Iowa | |
|---|---|
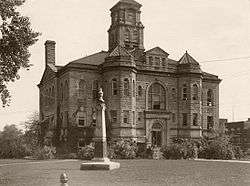 Appanoose County Courthouse | |
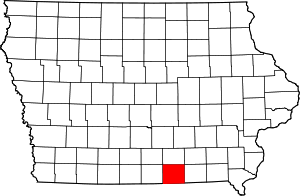 Location in the U.S. state of Iowa | |
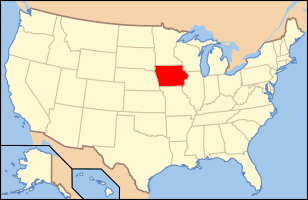 Iowa's location in the U.S. | |
| Founded | 1843 |
| Named for | Chief Appanoose |
| Seat | Centerville |
| Largest city | Centerville |
| Area | |
| • Total | 516 sq mi (1,336 km2) |
| • Land | 497 sq mi (1,287 km2) |
| • Water | 19 sq mi (49 km2), 3.7% |
| Population | |
| • (2010) | 12,884 |
| • Density | 26/sq mi (10/km2) |
| Congressional district | 2nd |
| Time zone | Central: UTC−6/−5 |
| Website |
www |
Appanoose County is a county in the U.S. state of Iowa. As of the 2010 census, the population was 12,884.[1] Its county seat is Centerville.[2]
The county was a major coal-mining region. In recent decades, the state has made a mostly-unsuccessful effort to develop manufacturing as an alternate form of employment. A Rubbermaid plant was the county's largest private employer until the company announced, in June 2006, that the plant, located in the Centerville industrial park, would relocate to Winfield, Kansas in October of that year. As a result of the closure and the failure of local officials to recruit new employers, unemployment in Appanoose County has consistently ranked among the highest in Iowa.
History
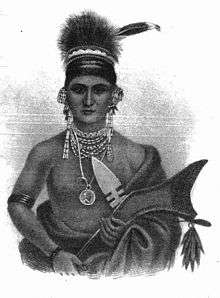
Appanoose County was formed on February 17, 1843, from open territory. It was named for the Meskwaki Chief Appanoose, who did not engage in war against Black Hawk, advocating peace. The present county seat was formerly called Chaldea, and was later renamed to Senterville in honor of Congressman William Tandy Senter of Tennessee. In April 1848, the courthouse, constructed at the expense of $160, was put into use and served as such until 1857. The second courthouse was opened in 1864, and was burned down to the first floor during an explosive Fourth of July fireworks demonstration. The third courthouse was dedicated on May 21, 1903, and remains in use.[3]
Geography
According to the U.S. Census Bureau, the county has a total area of 516 square miles (1,340 km2), of which 497 square miles (1,290 km2) is land and 19 square miles (49 km2) (3.7%) is water.[4] Rathbun Reservoir, created by damming the Chariton River, is its main physical feature.
Major highways
Adjacent counties
- Monroe County (north)
- Wapello County (northeast)
- Lucas County (northwest)
- Davis County (east)
- Schuyler County, Missouri (southeast)
- Putnam County, Missouri (southwest)
- Wayne County (west)
Demographics
| Historical population | |||
|---|---|---|---|
| Census | Pop. | %± | |
| 1850 | 3,131 | — | |
| 1860 | 11,931 | 281.1% | |
| 1870 | 16,456 | 37.9% | |
| 1880 | 16,636 | 1.1% | |
| 1890 | 18,961 | 14.0% | |
| 1900 | 25,927 | 36.7% | |
| 1910 | 28,701 | 10.7% | |
| 1920 | 30,535 | 6.4% | |
| 1930 | 24,835 | −18.7% | |
| 1940 | 24,245 | −2.4% | |
| 1950 | 19,683 | −18.8% | |
| 1960 | 16,015 | −18.6% | |
| 1970 | 15,007 | −6.3% | |
| 1980 | 15,511 | 3.4% | |
| 1990 | 13,743 | −11.4% | |
| 2000 | 13,721 | −0.2% | |
| 2010 | 12,884 | −6.1% | |
| Est. 2016 | 12,462 | [5] | −3.3% |
| U.S. Decennial Census[6] 1790-1960[7] 1900-1990[8] 1990-2000[9] 2010-2013[1] | |||
2010 census
The 2010 census recorded a population of 12,884 in the county, with a population density of 25.976/sq mi (10.029/km2). There were 6,633 housing units, of which 5,627 were occupied.[10]
2000 census

As of the census[11] of 2000, there were 13,721 people, 5,779 households, and 3,802 families residing in the county. The population density was 28 people per square mile (11/km²). There were 6,697 housing units at an average density of 14 per square mile (5/km²). The racial makeup of the county was 98.16% White, 0.42% Black or African American, 0.17% Native American, 0.26% Asian, 0.01% Pacific Islander, 0.27% from other races, and 0.71% from two or more races. 0.98% of the population were Hispanic or Latino of any race.
There were 5,779 households out of which 28.40% had children under the age of 18 living with them, 53.10% were married couples living together, 8.80% had a female householder with no husband present, and 34.20% were non-families. 29.90% of all households were made up of individuals and 15.40% had someone living alone who was 65 years of age or older. The average household size was 2.34 and the average family size was 2.89.
23.70% of the people are under the age of 18, 7.80% from 18 to 24, 25.10% from 25 to 44, 23.50% from 45 to 64, and 20.00% who were 65 years of age or older. The median age was 41 years. For every 100 females there were 91.50 males. For every 100 females age 18 and over, there were 89.50 males.
The median income for a household in the county was $28,612, and the median income for a family was $35,980. Males had a median income of $27,449 versus $20,452 for females. The per capita income for the county was $14,644. About 10.10% of families and 14.50% of the population were below the poverty line, including 16.00% of those under age 18 and 14.10% of those age 65 or over.
Communities
Cities
Townships
Appanoose County is divided into seventeen townships:
Population ranking
The population ranking of the following table is based on the 2010 census of Appanoose County.[12]
† county seat
| Rank | City/Town/etc. | Municipal type | Population (2010 Census)
|
|---|---|---|---|
| 1 | † Centerville | City | 5,528 |
| 2 | Moravia (partially in Monroe County) | City | 665 |
| 3 | Moulton | City | 605 |
| 4 | Mystic | City | 425 |
| 5 | Cincinnati | City | 357 |
| 6 | Exline | City | 160 |
| 7 | Unionville | City | 102 |
| 8 | Numa | City | 92 |
| 9 | Rathbun | City | 89 |
| 10 | Plano | City | 70 |
| 11 | Udell | City | 47 |
Politics
| Year | Republican | Democratic | Third Parties |
|---|---|---|---|
| 2016 | 65.7% 4,033 | 29.6% 1,814 | 4.7% 289 |
| 2012 | 50.6% 3,161 | 47.3% 2,951 | 2.1% 133 |
| 2008 | 49.9% 3,086 | 48.1% 2,970 | 2.0% 123 |
| 2004 | 51.8% 3,340 | 47.5% 3,063 | 0.7% 47 |
| 2000 | 52.5% 2,992 | 44.9% 2,560 | 2.7% 152 |
| 1996 | 39.9% 2,233 | 49.1% 2,747 | 11.0% 612 |
| 1992 | 36.8% 2,346 | 44.1% 2,810 | 19.1% 1,217 |
| 1988 | 45.7% 2,779 | 52.7% 3,209 | 1.6% 100 |
| 1984 | 50.5% 3,412 | 48.7% 3,289 | 0.9% 58 |
| 1980 | 52.7% 3,544 | 41.2% 2,769 | 6.2% 415 |
| 1976 | 46.3% 3,036 | 52.2% 3,424 | 1.5% 98 |
| 1972 | 64.0% 4,321 | 33.8% 2,283 | 2.1% 143 |
| 1968 | 49.6% 3,497 | 42.6% 3,005 | 7.8% 551 |
| 1964 | 36.6% 2,872 | 63.1% 4,960 | 0.3% 24 |
| 1960 | 59.4% 5,040 | 40.4% 3,422 | 0.2% 18 |
| 1956 | 55.0% 4,980 | 44.9% 4,064 | 0.1% 10 |
| 1952 | 55.4% 5,429 | 43.6% 4,276 | 1.0% 99 |
| 1948 | 43.9% 4,078 | 53.8% 4,998 | 2.4% 220 |
| 1944 | 49.2% 4,928 | 50.1% 5,015 | 0.8% 77 |
| 1940 | 49.4% 6,032 | 49.7% 6,069 | 0.8% 101 |
| 1936 | 45.2% 5,511 | 54.1% 6,599 | 0.8% 93 |
| 1932 | 42.2% 4,229 | 55.1% 5,519 | 2.7% 269 |
| 1928 | 66.7% 6,864 | 32.5% 3,340 | 0.8% 83 |
| 1924 | 57.1% 6,421 | 18.1% 2,032 | 24.8% 2,785 |
| 1920 | 65.5% 6,382 | 30.3% 2,952 | 4.2% 409 |
| 1916 | 52.4% 3,327 | 39.6% 2,510 | 8.0% 509 |
| 1912 | 40.6% 2,356 | 35.4% 2,058 | 24.0% 1,393 |
| 1908 | 55.0% 3,161 | 37.7% 2,167 | 7.3% 419 |
| 1904 | 59.9% 3,607 | 28.9% 1,743 | 11.2% 676 |
| 1900 | 55.5% 3,538 | 42.2% 2,690 | 2.3% 145 |
| 1896 | 50.5% 3,046 | 48.8% 2,940 | 0.7% 41 |
See also
References
- 1 2 "State & County QuickFacts". United States Census Bureau. Retrieved July 13, 2014.
- ↑ "Find a County". National Association of Counties. Archived from the original on 2011-05-31. Retrieved 2011-06-07.
- ↑ Appanoose County
- ↑ "US Gazetteer files: 2010, 2000, and 1990". United States Census Bureau. 2011-02-12. Retrieved 2011-04-23.
- ↑ "Population and Housing Unit Estimates". Retrieved June 9, 2017.
- ↑ "U.S. Decennial Census". United States Census Bureau. Archived from the original on May 12, 2015. Retrieved July 13, 2014.
- ↑ "Historical Census Browser". University of Virginia Library. Retrieved July 13, 2014.
- ↑ "Population of Counties by Decennial Census: 1900 to 1990". United States Census Bureau. Retrieved July 13, 2014.
- ↑ "Census 2000 PHC-T-4. Ranking Tables for Counties: 1990 and 2000" (PDF). United States Census Bureau. Retrieved July 13, 2014.
- ↑ "Population and Housing Occupancy Status: 2010 - State -- County". United States Census Bureau American FactFinder. Retrieved March 6, 2011.
- ↑ "American FactFinder". United States Census Bureau. Archived from the original on 2013-09-11. Retrieved 2008-01-31.
- ↑ "Archived copy". Archived from the original on 2013-12-21. Retrieved 2015-12-06.
- ↑ Leip, David. "Dave Leip's Atlas of U.S. Presidential Elections". uselectionatlas.org. Retrieved 2018-04-25.
External links
| Wikimedia Commons has media related to Appanoose County, Iowa. |
Places adjacent to Appanoose County, Iowa | ||||||||||
|---|---|---|---|---|---|---|---|---|---|---|
| ||||||||||
Municipalities and communities of Appanoose County, Iowa, United States | ||
|---|---|---|
| Cities | ||
| Townships | ||
| Unincorporated communities | ||

Coordinates: 40°44′17″N 92°52′02″W / 40.73806°N 92.86722°W