United States presidential election in California, 1936
|
| ||||||||||||||||||||||||||
| ||||||||||||||||||||||||||
| ||||||||||||||||||||||||||
 County Results
Roosevelt—70-80%
Roosevelt—60-70%
Roosevelt—50-60%
Roosevelt—<50% | ||||||||||||||||||||||||||
| ||||||||||||||||||||||||||

| Elections in California | ||||||||||
|---|---|---|---|---|---|---|---|---|---|---|
 | ||||||||||
|
||||||||||
|
||||||||||
|
||||||||||
The 1936 United States presidential election in California was held on November 3, 1936, as part of the 1936 United States presidential election. California voters chose twenty-two electors, or representatives to the Electoral College, who voted for president and vice president.
California voted for the Democratic candidate, incumbent President Franklin D. Roosevelt of New York, in a landslide over the Republican challenger, Kansas Governor Alfred Mossman Landon, carrying every county and nearly sixty-seven percent of the vote to Landon’s 31.7 percent. Roosevelt’s percentage of the vote is the highest of any presidential candidate in California history, besting Warren G. Harding’s 66.2 percent in 1920.[1] While his 35.25 percentage point margin of victory over Landon is the largest for any Democratic candidate, it is the second largest overall behind Harding’s 41.92 percent in 1920, and ahead of Theodore Roosevelt’s 34.9 percent in 1904.
As of the 2016 presidential election, this is the last time that a presidential candidate from either political party completely swept all of California’s counties in an election. The only other candidate to manage this has been Harding in his landslide 1920 victory.[1]
Roosevelt was the last Democrat until Hillary Clinton in 2016 to carry Orange County in a presidential election, and the last until John Kerry in 2004 to carry Alpine County. Also, this was the only one of FDR’s four presidential campaigns where he carried Riverside County, which had never previously voted Democratic since its first election in 1896[2] and was not to do so again until Lyndon Johnson in 1964.
Results
| United States presidential election in California, 1936[3] | |||||
|---|---|---|---|---|---|
| Party | Candidate | Votes | Percentage | Electoral votes | |
| Democratic | Franklin D. Roosevelt (incumbent) | 1,766,836 | 66.95% | 22 | |
| Republican | Alfred Landon | 836,431 | 31.70% | 0 | |
| Prohibition | D. Leigh Colvin | 12,917 | 0.49% | 0 | |
| Socialist | Norman Thomas | 11,331 | 0.43% | 0 | |
| Communist | Earl Russell Browder | 10,877 | 0.41% | 0 | |
| No party | Write-ins | 490 | 0.02% | 0 | |
| Invalid or blank votes | — | ||||
| Totals | 2,638,882 | 100.00% | 22 | ||
| Voter turnout | — | ||||
Results by county
| Franklin Delano Roosevelt Democratic |
Alfred Mossman Landon Republican |
Others Various candidates |
Margin | |||||
|---|---|---|---|---|---|---|---|---|
| County | % | # | % | # | % | # | % | # |
| Lassen | 79.47% | 4,193 | 19.62% | 1,035 | 0.91% | 48 | 59.86% | 3,158 |
| Plumas | 78.81% | 2,707 | 19.80% | 680 | 1.40% | 48 | 59.01% | 2,027 |
| Sacramento | 78.53% | 47,265 | 20.14% | 12,119 | 1.33% | 800 | 58.40% | 35,146 |
| Solano | 78.05% | 13,459 | 20.89% | 3,603 | 1.06% | 182 | 57.16% | 9,856 |
| Fresno | 77.75% | 42,859 | 20.94% | 11,545 | 1.31% | 722 | 56.80% | 31,314 |
| Placer | 76.62% | 7,959 | 22.34% | 2,321 | 1.04% | 108 | 54.27% | 5,638 |
| Sierra | 76.44% | 1,152 | 22.56% | 340 | 1.00% | 15 | 53.88% | 812 |
| Madera | 75.74% | 4,646 | 22.61% | 1,387 | 1.65% | 101 | 53.13% | 3,259 |
| El Dorado | 75.66% | 4,019 | 23.12% | 1,228 | 1.22% | 65 | 52.54% | 2,791 |
| Amador | 75.41% | 2,506 | 23.38% | 777 | 1.20% | 40 | 52.03% | 1,729 |
| Kings | 75.10% | 7,062 | 23.67% | 2,226 | 1.23% | 116 | 51.42% | 4,836 |
| Kern | 74.61% | 25,726 | 24.20% | 8,345 | 1.18% | 408 | 50.41% | 17,381 |
| Yuba | 74.18% | 4,125 | 23.95% | 1,332 | 1.87% | 104 | 50.22% | 2,793 |
| Mariposa | 74.40% | 1,907 | 24.23% | 621 | 1.37% | 35 | 50.18% | 1,286 |
| San Francisco | 74.04% | 196,197 | 24.69% | 65,436 | 1.27% | 3,368 | 49.34% | 130,761 |
| San Joaquin | 73.20% | 29,078 | 25.61% | 10,172 | 1.19% | 473 | 47.59% | 18,906 |
| Merced | 72.69% | 9,208 | 25.50% | 3,230 | 1.82% | 230 | 47.19% | 5,978 |
| Tuolumne | 72.72% | 3,303 | 26.40% | 1,199 | 0.88% | 40 | 46.32% | 2,104 |
| Contra Costa | 72.29% | 26,007 | 26.70% | 9,604 | 1.01% | 364 | 45.60% | 16,403 |
| Nevada | 71.91% | 5,128 | 26.83% | 1,913 | 1.26% | 90 | 45.08% | 3,215 |
| Calaveras | 71.31% | 2,520 | 27.16% | 960 | 1.53% | 54 | 44.14% | 1,560 |
| Colusa | 70.38% | 2,965 | 28.15% | 1,186 | 1.47% | 62 | 42.23% | 1,779 |
| Sutter | 70.04% | 4,019 | 28.11% | 1,613 | 1.85% | 106 | 41.93% | 2,406 |
| Shasta | 69.72% | 5,236 | 28.75% | 2,159 | 1.53% | 115 | 40.97% | 3,077 |
| Siskiyou | 69.28% | 6,865 | 29.46% | 2,919 | 1.26% | 125 | 39.82% | 3,946 |
| Yolo | 68.94% | 5,992 | 29.84% | 2,594 | 1.22% | 106 | 39.09% | 3,398 |
| Tulare | 67.66% | 18,956 | 30.78% | 8,624 | 1.55% | 435 | 36.88% | 10,332 |
| Trinity | 67.11% | 1,424 | 30.87% | 655 | 2.03% | 43 | 36.24% | 769 |
| Los Angeles | 67.00% | 757,351 | 31.62% | 357,401 | 1.39% | 15,663 | 35.38% | 399,950 |
| Butte | 65.86% | 10,490 | 32.04% | 5,103 | 2.10% | 335 | 33.82% | 5,387 |
| Glenn | 65.97% | 3,288 | 32.50% | 1,620 | 1.52% | 76 | 33.47% | 1,668 |
| San Mateo | 65.67% | 27,087 | 33.09% | 13,650 | 1.24% | 511 | 32.58% | 13,437 |
| Marin | 65.43% | 12,152 | 33.44% | 6,211 | 1.13% | 209 | 31.99% | 5,941 |
| Mono | 64.78% | 458 | 34.09% | 241 | 1.13% | 8 | 30.69% | 217 |
| Modoc | 64.57% | 1,828 | 34.19% | 968 | 1.24% | 35 | 30.38% | 860 |
| Alameda | 63.63% | 149,323 | 35.09% | 82,352 | 1.28% | 3,011 | 28.54% | 66,971 |
| San Diego | 63.45% | 64,628 | 35.04% | 35,686 | 1.51% | 1,540 | 28.42% | 28,942 |
| Stanislaus | 63.13% | 15,341 | 35.44% | 8,613 | 1.43% | 348 | 27.68% | 6,728 |
| Ventura | 63.14% | 13,384 | 35.75% | 7,579 | 1.11% | 235 | 27.38% | 5,805 |
| Humboldt | 62.93% | 11,909 | 35.97% | 6,808 | 1.10% | 208 | 26.95% | 5,101 |
| Mendocino | 62.65% | 6,432 | 35.75% | 3,670 | 1.60% | 164 | 26.90% | 2,762 |
| Inyo | 62.38% | 1,560 | 36.47% | 912 | 1.16% | 29 | 25.91% | 648 |
| San Benito | 61.93% | 2,565 | 36.58% | 1,515 | 1.50% | 62 | 25.35% | 1,050 |
| San Luis Obispo | 61.13% | 7,889 | 37.28% | 4,812 | 1.59% | 205 | 23.84% | 3,077 |
| Santa Barbara | 61.14% | 15,923 | 37.35% | 9,728 | 1.51% | 394 | 23.79% | 6,195 |
| Monterey | 61.13% | 12,267 | 37.70% | 7,565 | 1.17% | 235 | 23.43% | 4,702 |
| Imperial | 60.75% | 7,560 | 38.34% | 4,771 | 0.91% | 113 | 22.41% | 2,789 |
| Napa | 60.35% | 6,270 | 38.24% | 3,973 | 1.41% | 147 | 22.11% | 2,297 |
| Tehama | 59.68% | 3,687 | 38.46% | 2,376 | 1.86% | 115 | 21.22% | 1,311 |
| Sonoma | 60.17% | 17,273 | 38.96% | 11,185 | 0.86% | 248 | 21.21% | 6,088 |
| San Bernardino | 59.55% | 33,955 | 38.97% | 22,219 | 1.48% | 842 | 20.58% | 11,736 |
| Del Norte | 59.43% | 1,292 | 39.24% | 853 | 1.33% | 29 | 20.19% | 439 |
| Santa Clara | 58.48% | 38,346 | 40.41% | 26,498 | 1.12% | 732 | 18.07% | 11,848 |
| Orange | 55.00% | 29,836 | 43.31% | 23,494 | 1.70% | 921 | 11.69% | 6,342 |
| Alpine | 53.46% | 85 | 46.54% | 74 | 0.00% | 0 | 6.92% | 11 |
| Santa Cruz | 52.08% | 9,326 | 46.12% | 8,260 | 1.80% | 322 | 5.95% | 1,066 |
| Lake | 49.82% | 1,837 | 48.74% | 1,797 | 1.44% | 53 | 1.08% | 40 |
| Riverside | 49.88% | 17,011 | 48.89% | 16,674 | 1.24% | 422 | 0.99% | 337 |
References
- 1 2 Thomas, G. Scott; The Pursuit of the White House: A Handbook of Presidential Election Statistics and History, p. 421 ISBN 0313257957
- ↑ Menendez, Albert J.; The Geography of Presidential Elections in the United States, 1868-2004, pp. 152-155 ISBN 0786422173
- ↑ "1936 Presidential General Election Results - California". Dave Leip's U.S. Election Atlas. Retrieved 2008-08-25.
| Candidates | 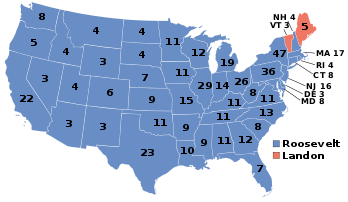 | |
|---|---|---|
| General articles |
| |
| Local results |
| |
| Other 1936 elections | ||