Alpine County, California
| Alpine County, California | |||
|---|---|---|---|
| County | |||
| County of Alpine | |||
 A road sign denoting the Alpine County line along California State Route 89 during a snowstorm in May 2008. | |||
| |||
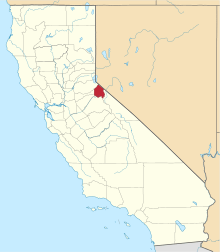 Location in the state of California | |||
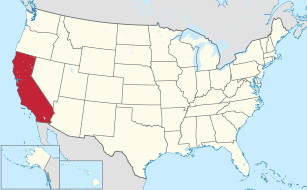 California's location in the United States | |||
| Country |
| ||
| State |
| ||
| Region | Sierra Nevada | ||
| Incorporated | March 16, 1864[1] | ||
| Named for | Its location in the Sierra Nevada resembling the (Swiss) Alps | ||
| County seat | Markleeville | ||
| Largest community | Markleeville | ||
| Area | |||
| • Total | 743 sq mi (1,920 km2) | ||
| • Land | 738 sq mi (1,910 km2) | ||
| • Water | 4.8 sq mi (12 km2) | ||
| Highest elevation[2] | 11,464 ft (3,494 m) | ||
| Population (April 1, 2010)[3] | |||
| • Total | 1,175 | ||
| • Estimate (2016)[3] | 1,071 | ||
| • Density | 1.6/sq mi (0.61/km2) | ||
| Time zone | UTC−8 (Pacific Standard Time) | ||
| • Summer (DST) | UTC−7 (Pacific Daylight Time) | ||
| Area codes | 209, 530 | ||
| FIPS code | 06-003 | ||
| GNIS feature ID | 1675840 | ||
| Website |
www | ||

Alpine County, officially the County of Alpine, is a county in the U.S. state of California. As of the 2010 census, the population was 1,175.[4] making it California's least populous county. The county seat is the Census Designated Place of Markleeville.[5] There are no incorporated cities in the county.
Alpine County is in the Sierra Nevada, between Lake Tahoe and Yosemite National Park.
History
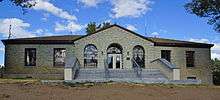
Architect: Frederic J. DeLongchamp
Alpine County was created on March 16, 1864, during a silver boom in the wake of the nearby Comstock Lode discovery.[1] It was named because of its resemblance to the Swiss Alps.[6] The County was formed from parts of Amador, Calaveras, El Dorado, Mono and Tuolumne Counties.[1] At its formation, the County had a population of about 11,000 with its County Seat at Silver Mountain City. By 1868, however, the local silver mines had proven unfruitful; and the population fell to about 1,200. The County Seat was moved to Markleeville in 1875.[1]
After the silver rush, Alpine County's economy consisted almost entirely of farming, ranching, and logging. By the 1920s, the population had fallen to just 200 people. With the construction of the Bear Valley and Kirkwood ski resorts in the late 1960s, the population increased to the present level.
Geography

According to the U.S. Census Bureau, the county has an area of 743 square miles (1,920 km2), of which 738 square miles (1,910 km2) is land and 4.8 square miles (12 km2) (0.7%) is water.[7] The federal government owns about 96% of Alpine County, the highest percentage in California.[8]
National protected areas
- Eldorado National Forest (part)
- Stanislaus National Forest (part)
- Toiyabe National Forest (part)
Demographics
2011
| Population, race, and income | |||||
|---|---|---|---|---|---|
| Total population[9] | 1,167 | ||||
| White[9] | 771 | 66.1% | |||
| Native American[9] | 237 | 20.3% | |||
| Hispanic or Latino (of any race)[10] | 82 | 7.0% | |||
| Some other race[9] | 62 | 5.3% | |||
| Asian[9] | 39 | 3.3% | |||
| Two or more races[9] | 37 | 3.2% | |||
| Native Hawaiian or other Pacific Islander[9] | 21 | 1.8% | |||
| Black or African American[9] | 0 | 0.0% | |||
| Per capita income[11] | $29,576 | ||||
| Median household income[12] | $59,018 | ||||
| Median family income[13] | $81,750 | ||||
Places by population, race, and income
| Places by population and race | ||||||||
|---|---|---|---|---|---|---|---|---|
| Place | Type[14] | Population[9] | White[9] | Other[9] [note 1] |
Asian[9] | Black or African American[9] |
Native American[9] [note 2] |
Hispanic or Latino (of any race)[10] |
| Alpine Village | CDP | 180 | 47.2% | 0.0% | 0.0% | 0.0% | 52.8% | 1.7% |
| Bear Valley | CDP | 71 | 87.3% | 12.7% | 0.0% | 0.0% | 0.0% | 12.7% |
| Kirkwood ‡ | CDP | 84 | 21.4% | 73.8% | 4.8% | 0.0% | 0.0% | 73.8% |
| Markleeville | CDP | 262 | 92.4% | 7.6% | 0.0% | 0.0% | 0.0% | 1.1% |
| Mesa Vista | CDP | 185 | 88.6% | 0.0% | 1.1% | 0.0% | 10.3% | 0.0% |
| ‡ Data for Alpine County area of this CDP | ||||||||
| Places by population and income | |||||
|---|---|---|---|---|---|
| Place | Type[14] | Population[15] | Per capita income[11] | Median household income[12] | Median family income[13] |
| Alpine Village | CDP | 180 | $24,082 | $56,964 | $68,750 |
| Bear Valley (Alpine County) | CDP | 71 | $18,858 | $57,188 | $73,036 |
| Kirkwood ‡ | CDP | 84 | $8,543 | $47,500 | [16] |
| Markleeville | CDP | 262 | $33,769 | $81,750 | $112,750 |
| Mesa Vista | CDP | 185 | $42,536 | $73,875 | $125,278 |
| ‡ Data for Alpine County area of this CDP | |||||
2010
| Historical population | |||
|---|---|---|---|
| Census | Pop. | %± | |
| 1870 | 685 | — | |
| 1880 | 539 | −21.3% | |
| 1890 | 667 | 23.7% | |
| 1900 | 509 | −23.7% | |
| 1910 | 309 | −39.3% | |
| 1920 | 243 | −21.4% | |
| 1930 | 241 | −0.8% | |
| 1940 | 323 | 34.0% | |
| 1950 | 241 | −25.4% | |
| 1960 | 397 | 64.7% | |
| 1970 | 484 | 21.9% | |
| 1980 | 1,097 | 126.7% | |
| 1990 | 1,113 | 1.5% | |
| 2000 | 1,208 | 8.5% | |
| 2010 | 1,175 | −2.7% | |
| Est. 2017 | 1,120 | [17] | −4.7% |
| U.S. Decennial Census[18] 1790–1960[19] 1900–1990[20] 1990–2000[21] 2010–2016[4] | |||
The 2010 United States Census reported that Alpine County had a population of 1,175. The racial makeup of Alpine County was 881 (75.0%) White, 0 (0.0%) African American, 240 (20.4%) Native American, 7 (0.6%) Asian, 0 (0.0%) Pacific Islander, 19 (1.6%) from other races, and 28 (2.4%) from two or more races. Hispanic or Latino of any race were 84 persons (7.1%).[22]
| Population reported at 2010 United States Census | |||||||||
|---|---|---|---|---|---|---|---|---|---|
Population | American | American | Islander | races | more races | or Latino (of any race) | |||
| Alpine County | 1175 | 881 | 0 | 240 | 7 | 0 | 19 | 28 | 84 |
places | Population | American | American | Islander | races | more races | or Latino (of any race) | ||
| Alpine Village | 114 | 91 | 0 | 19 | 1 | 0 | 2 | 1 | 6 |
| Bear Valley | 121 | 119 | 0 | 0 | 1 | 0 | 0 | 1 | 1 |
| Kirkwood‡ | 97 | 94 | 0 | 3 | 0 | 0 | 0 | 0 | 0 |
| Markleeville | 210 | 192 | 0 | 4 | 2 | 0 | 6 | 6 | 11 |
| Mesa Vista | 200 | 178 | 0 | 15 | 2 | 0 | 0 | 5 | 11 |
communities | Population | American | American | Islander | races | more races | or Latino (of any race) | ||
| All others not CDPs (combined) | 433 | 217 | 0 | 199 | 1 | 0 | 11 | 15 | 51 |
| ‡ - census results for the portion of this CDP in Alpine County | |||||||||
2000
As of the census[23] of 2000, there were 1,208 people, 483 households, and 295 families residing in the county. The population density was 2 people per square mile (1/km²). There were 1,514 housing units at an average density of 2 per square mile (1/km²). The racial makeup of the county was 73.7% White, 0.6% Black or African American, 18.9% Native American, 0.3% Asian, 0.1% Pacific Islander, 1.4% from other races, and 5.1% from two or more races. 7.8% of the population were Hispanic or Latino of any race. 12.1% were of German, 12.1% Irish, 9.3% English, 6.5% American and 5.7% Italian ancestry according to Census 2000. 95.0% spoke English, 3.1% Spanish and 2.0% Washo as their first language.
There were 483 households out of which 25.5% had children under the age of 18 living with them, 43.9% were married couples living together, 11.0% had a female householder with no husband present, and 38.9% were non-families. 27.7% of all households were made up of individuals and 5.4% had someone living alone who was 65 years of age or older. The average household size was 2.50 and the average family size was 2.96.
In the county, the population was spread out with 22.8% under the age of 18, 10.4% from 18 to 24, 27.5% from 25 to 44, 29.3% from 45 to 64, and 9.9% who were 65 years of age or older. The median age was 39 years. For every 100 females there were 110.8 males. For every 100 females age 18 and over, there were 117.2 males.
The median income for a household in the county was $41,875, and the median income for a family was $50,250. Males had a median income of $36,544 versus $25,800 for females. The per capita income for the county was $24,431. About 12.0% of families and 19.5% of the population were below the poverty line, including 27.4% of those under age 18 and 10.1% of those age 65 or over.
Politics
Throughout the 20th century, Alpine County was a Republican stronghold in presidential and congressional elections. From 1892 until 2004, the only Democrat to carry Alpine County in a presidential election was Franklin Roosevelt in 1932 and 1936. In 1964, Alpine was one of only five counties in the state to back Barry Goldwater. It was among the five most Republican counties in the entire nation in 1892,[24] 1908,[25] 1920,[26] and 1928.[27] Warren Harding and Herbert Hoover gained over ninety percent of the county’s vote. However, Alpine has become more of a Democratic-leaning county in recent elections. It was carried by John Kerry in 2004 and has stayed in the Democratic column since.
| Year | GOP | DEM | Others |
|---|---|---|---|
| 2016 | 36.05% 217 | 55.48% 334 | 8.48% 51 |
| 2012 | 36.09% 236 | 59.48% 389 | 4.43% 29 |
| 2008 | 36.31% 252 | 60.81% 422 | 2.88% 20 |
| 2004 | 44.37% 311 | 53.21% 373 | 2.43% 17 |
| 2000 | 47.95% 281 | 45.22% 265 | 6.83% 40 |
| 1996 | 43.00% 264 | 42.02% 258 | 14.98% 92 |
| 1992 | 35.18% 222 | 34.07% 215 | 30.75% 194 |
| 1988 | 55.43% 306 | 41.67% 230 | 2.90% 16 |
| 1984 | 56.65% 264 | 41.63% 194 | 1.72% 8 |
| 1980 | 55.10% 254 | 28.85% 133 | 16.06% 74 |
| 1976 | 50.34% 225 | 42.28% 189 | 7.38% 33 |
| 1972 | 63.54% 366 | 33.85% 195 | 2.60% 15 |
| 1968 | 59.29% 150 | 32.81% 83 | 7.91% 20 |
| 1964 | 57.67% 124 | 42.33% 91 | |
| 1960 | 76.74% 132 | 23.26% 40 | |
| 1956 | 79.72% 114 | 20.28% 29 | |
| 1952 | 88.10% 148 | 11.90% 20 | |
| 1948 | 76.81% 106 | 18.12% 25 | 5.07% 7 |
| 1944 | 68.53% 98 | 31.47% 45 | |
| 1940 | 66.49% 125 | 32.98% 62 | 0.53% 1 |
| 1936 | 46.54% 74 | 53.46% 85 | |
| 1932 | 47.32% 53 | 50.00% 56 | 2.68% 3 |
| 1928 | 94.23% 49 | 5.77% 3 | |
| 1924 | 88.14% 52 | 8.47% 5 | 3.38% 2 |
| 1920 | 91.43% 64 | 8.57% 6 | |
| 1916 | 72.29% 60 | 27.71% 23 | |
| 1912 | 10.00% 8 | 42.50% 34 | 47.50% 38 |
| 1908 | 87.21% 75 | 12.79% 11 | |
| 1904 | 89.16% 74 | 10.84% 9 | |
| 1900 | 82.14% 69 | 17.86% 15 | |
| 1896 | 49.38% 40 | 48.15% 39 | 2.47% 2 |
| 1892 | 75.58% 65 | 19.77% 17 | 4.65% 4 |
In November 2008, Alpine was one of just three counties in California's interior in which voters rejected Proposition 8, the ballot initiative to amend the California Constitution to reject the legal extension of the title of marriage to same-sex couples. Alpine voters rejected Proposition 8 by 56.4 percent to 43.6 percent. The other interior counties in which Proposition 8 failed to receive a majority of votes were neighboring Mono County and Yolo County.[28]
According to the California Secretary of State, as of January 2016, there are 696 registered voters in Alpine County. Of those, 257 (36.9%) are registered Democratic, 210 (30.2%) are registered Republican, 46 (6.6%) are registered with other political parties, and 183 (26.3%) declined to state a political party.[29]
Alpine County is in California's 4th congressional district, represented by Republican Tom McClintock.[30] In the State Assembly, the county is in the 5th Assembly District, represented by Republican Frank Bigelow.[31] In the State Senate, the county is in the 1st Senate District, represented by Republican Ted Gaines.[32]
Due to its low population density, Alpine County votes entirely by mail, one of two counties in California which do so.[33] In the June 2014 primary elections, about 22% of registered voters went to the polls. In Alpine County, the number was almost 70%, the highest of any county in the state.[34]
Posse Comitatus controversy
In the late 1970s, the Posse Comitatus organization attempted to take over Alpine County by settling there and fielding candidates in local elections.[35] The Posse thought winning local elections in Alpine County was their best opportunity to take control of a single county. The group fielded a candidate for sheriff and registered fictitious voters using post office boxes and vacant lots as their addresses. Six people were prosecuted for voter fraud, the false registrations were thrown out, and the incumbent sheriff was re-elected.[36]
Voter registration statistics
| Population and registered voters | ||
|---|---|---|
| Total population[9] | 1,167 | |
| Registered voters[37][note 3] | 771 | 66.1% |
| Democratic[37] | 290 | 37.6% |
| Republican[37] | 235 | 30.5% |
| Democratic–Republican spread[37] | +55 | +7.1% |
| Independent[37] | 30 | 3.9% |
| Green[37] | 13 | 1.7% |
| Libertarian[37] | 3 | 0.4% |
| Peace and Freedom[37] | 2 | 0.3% |
| Americans Elect[37] | 0 | 0.0% |
| Other[37] | 5 | 0.6% |
| No party preference[37] | 193 | 25.0% |
Crime
The following table includes the number of incidents reported and the rate per 1,000 persons for each type of offense.
| Population and crime rates | ||
|---|---|---|
| Population[9] | 1,167 | |
| Violent crime[38] | 13 | 11.14 |
| Homicide[38] | 0 | 0.00 |
| Forcible rape[38] | 1 | 0.86 |
| Robbery[38] | 1 | 0.86 |
| Aggravated assault[38] | 11 | 9.43 |
| Property crime[38] | 39 | 33.42 |
| Burglary[38] | 11 | 9.43 |
| Larceny-theft[38][note 4] | 49 | 41.99 |
| Motor vehicle theft[38] | 2 | 1.71 |
| Arson[38] | 0 | 0.00 |
Transportation
Major highways
Airport
Alpine County Airport is a general aviation airport in the Eastern Sierra about 4 miles (6.4 km) from the town of Markleeville. The airport consists of a simple airstrip with an apron for small light aircraft to park. The airport has no buildings, no lights, and is very rarely used. The airport is popular with astronomers due to the clear, dark skies.
Communities
Census-designated places
- Alpine Village
- Bear Valley
- Kirkwood
- Markleeville (county seat)
- Mesa Vista
Unincorporated communities
Population ranking
The population ranking of the following table is based on the 2010 census of Alpine County.[39]
† county seat
| Rank | City/Town/etc. | Municipal type | Population (2010 Census)
|
|---|---|---|---|
| 1 | Woodfords Community[40] | AIAN | 214 |
| 2 | † Markleeville | CDP | 210 |
| 3 | Mesa Vista | CDP | 200 |
| 4 | Kirkwood (partially in Amador County) | CDP | 158 |
| 5 | Bear Valley | CDP | 121 |
| 6 | Alpine Village | CDP | 114 |
See also

- List of school districts in Alpine County, California
- National Register of Historic Places listings in Alpine County, California
- Stonewall Nation, a proposal by gay activists to colonize Alpine County in the 1970s
- Alpine Sierra Trailblazer: Where to hike, ski, bike, drive from Markleeville to Yosemite, further reading
Notes
- ↑ Other = Some other race + Two or more races
- ↑ Native American = Native Hawaiian or other Pacific Islander + American Indian or Alaska Native
- ↑ Percentage of registered voters with respect to total population. Percentages of party members with respect to registered voters follow.
- ↑ Only larceny-theft cases involving property over $400 in value are reported as property crimes.
References
- 1 2 3 4 "Alpine County General Plan" (PDF). February 2009. p. 7. Archived from the original (PDF) on July 21, 2011. Retrieved March 10, 2011.
- ↑ "Sonora Peak". Peakbagger.com. Retrieved March 30, 2015.
- 1 2 "Annual Estimates of the Resident Population: April 1, 2010 to July 1, 2016 Estimates". Retrieved April 27, 2017.
- 1 2 "State & County QuickFacts". United States Census Bureau. Archived from the original on July 6, 2011. Retrieved April 3, 2016.
- ↑ "Find a County". National Association of Counties. Archived from the original on May 31, 2011. Retrieved 2011-06-07.
- ↑ William Bright; Erwin Gustav Gudde (November 30, 1998). 1500 California place names: their origin and meaning. University of California Press. p. 14. ISBN 978-0-520-21271-8. Retrieved January 20, 2012.
- ↑ "2010 Census Gazetteer Files". United States Census Bureau. August 22, 2012. Retrieved September 24, 2015.
- ↑ Sabalow, Ryan; Kasler, Dale; Reese, Phillip (January 9, 2016). "Rural Californians sympathize with protesters' goals in Oregon standoff". The Sacramento Bee.
- 1 2 3 4 5 6 7 8 9 10 11 12 13 14 15 16 U.S. Census Bureau. American Community Survey, 2011 American Community Survey 5-Year Estimates, Table B02001. American FactFinder Archived September 11, 2013, at the Wayback Machine.. Retrieved 2013-10-26.
- 1 2 U.S. Census Bureau. American Community Survey, 2011 American Community Survey 5-Year Estimates, Table B03003. American FactFinder Archived September 11, 2013, at the Wayback Machine.. Retrieved 2013-10-26.
- 1 2 U.S. Census Bureau. American Community Survey, 2011 American Community Survey 5-Year Estimates, Table B19301. American FactFinder Archived September 11, 2013, at the Wayback Machine.. Retrieved 2013-10-21.
- 1 2 U.S. Census Bureau. American Community Survey, 2011 American Community Survey 5-Year Estimates, Table B19013. American FactFinder Archived September 11, 2013, at the Wayback Machine.. Retrieved 2013-10-21.
- 1 2 U.S. Census Bureau. American Community Survey, 2011 American Community Survey 5-Year Estimates, Table B19113. American FactFinder Archived September 11, 2013, at the Wayback Machine.. Retrieved 2013-10-21.
- 1 2 U.S. Census Bureau. American Community Survey, 2011 American Community Survey 5-Year Estimates. American FactFinder Archived September 11, 2013, at the Wayback Machine.. Retrieved 2013-10-21.
- ↑ U.S. Census Bureau. American Community Survey, 2011 American Community Survey 5-Year Estimates, Table B01003. American FactFinder Archived September 11, 2013, at the Wayback Machine.. Retrieved 2013-10-21.
- ↑ Data unavailable
- ↑ "Population and Housing Unit Estimates". Retrieved March 24, 2018.
- ↑ "U.S. Decennial Census". United States Census Bureau. Archived from the original on May 12, 2015. Retrieved September 24, 2015.
- ↑ "Historical Census Browser". University of Virginia Library. Retrieved September 24, 2015.
- ↑ Forstall, Richard L., ed. (March 27, 1995). "Population of Counties by Decennial Census: 1900 to 1990". United States Census Bureau. Retrieved September 24, 2015.
- ↑ "Census 2000 PHC-T-4. Ranking Tables for Counties: 1990 and 2000" (PDF). United States Census Bureau. April 2, 2001. Retrieved September 24, 2015.
- ↑ "2010 Census P.L. 94-171 Summary File Data". United States Census Bureau.
- ↑ "American FactFinder". United States Census Bureau. Archived from the original on September 11, 2013. Retrieved 2008-01-31.
- ↑ Dave Leip’s Atlas of U.S. Presidential Elections; 1892 Presidential Election Statistics
- ↑ Dave Leip’s Atlas of U.S. Presidential Elections; 1908 Presidential Election Statistics
- ↑ Dave Leip’s Atlas of U.S. Presidential Elections; 1920 Presidential Election Statistics
- ↑ Dave Leip’s Atlas of U.S. Presidential Elections; 1928 Presidential Election Statistics
- ↑ "California results". latimes.com. Retrieved March 26, 2018.
- ↑ "Voter Registration Statistics". California Secretary of State. January 5, 2016. Retrieved April 3, 2016.
- ↑ "California's 4th Congressional District - Representatives & District Map". Civic Impulse, LLC. Retrieved March 1, 2013.
- ↑ "Members Assembly". State of California. Retrieved March 18, 2013.
- ↑ "Senators". State of California. Retrieved March 18, 2013.
- ↑ "No voters at these polls". Los Angeles Times. Retrieved March 17, 2013.
- ↑ Mehta, Seema (17 June 2014). "California's least-populous county takes voting seriously". Los Angeles Times.
- ↑ Levitas, Daniel. The Terrorist Next Door: The Militia Movement and the Radical Right. Macmillan. p. 164. ISBN 9781429941808. Retrieved 29 June 2014.
- ↑ Duncan, Dayton. Miles from Nowhere: Tales from America's Contemporary Frontier. University of Nebraska Press. p. 259. ISBN 0803266278. Retrieved 29 June 2014.
- 1 2 3 4 5 6 7 8 9 10 11 California Secretary of State. February 10, 2013 - Report of Registration Archived November 3, 2013, at the Wayback Machine.. Retrieved 2013-10-31.
- 1 2 3 4 5 6 7 8 9 10 Office of the Attorney General, Department of Justice, State of California. Table 11: Crimes – 2009 Archived December 2, 2013, at the Wayback Machine.. Retrieved 2013-11-14.
- ↑ "Archived copy". Archived from the original on December 21, 2013. Retrieved 2015-12-06.
- ↑ Staff, Website Services & Coordination. "US Census Bureau 2010 Census Interactive Population Map". www.census.gov. Retrieved March 26, 2018.
External links
| Wikivoyage has a travel guide for Alpine County. |
| Wikimedia Commons has media related to Alpine County, California. |
Places adjacent to Alpine County, California | ||||||||||
|---|---|---|---|---|---|---|---|---|---|---|
| ||||||||||
Municipalities and communities of Alpine County, California, United States | ||
|---|---|---|
| CDPs | | |
| Unincorporated communities | ||
| Ghost towns |
| |
| Footnotes | ‡This populated place also has portions in an adjacent county or counties | |
Coordinates: 38°35′N 119°48′W / 38.58°N 119.80°W
| Authority control |
|---|