United States presidential election in California, 1988
|
| ||||||||||||||||||||||||||
| ||||||||||||||||||||||||||
| ||||||||||||||||||||||||||
 County Results
Dukakis—70-80%
Dukakis—60-70%
Dukakis—50-60%
Bush—<50%
Bush—50-60%
Bush—60-70% | ||||||||||||||||||||||||||
| ||||||||||||||||||||||||||

| Elections in California | ||||||||||
|---|---|---|---|---|---|---|---|---|---|---|
 | ||||||||||
|
||||||||||
|
||||||||||
|
||||||||||
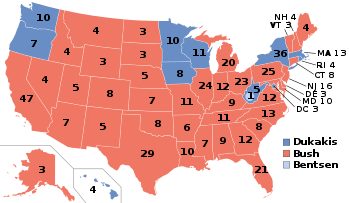
The 1988 United States presidential election in California took place on November 8, 1988, and was part of the 1988 United States presidential election. Voters chose 47 representatives, or electors to the Electoral College, who voted for president and vice president.
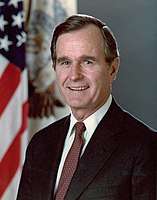
California voted for the Republican nominee, Vice President George H. W. Bush, over the Democratic nominee, Massachusetts governor Michael Dukakis by a margin of 3.57%. Bush won 44 of the state’s 58 counties, but the election was kept close by Dukakis’ strong performance in the Bay Area and his victory in Los Angeles, the state’s most populated county. Also, Dukakis won at least 31% of the vote in every county and at least 40% in 40 of them.
As of the 2016 presidential election, this is the last election in which the state of California was carried by a Republican candidate in a presidential election. Bush is also the last Republican to carry the following counties in a presidential election: Imperial, Monterey, Napa, Sacramento, San Benito and Santa Barbara, and the last Republican to win any county in the Bay Area (Napa).
Results
| United States presidential election in California, 1988[1] | |||||
|---|---|---|---|---|---|
| Party | Candidate | Votes | Percentage | Electoral votes | |
| Republican | George Herbert Walker Bush | 5,054,917 | 51.13% | 47 | |
| Democratic | Michael Stanley Dukakis | 4,702,233 | 47.56% | 0 | |
| Libertarian | Ron Paul | 70,105 | 0.71% | 0 | |
| Independent | Lenora Fulani | 31,180 | 0.32% | 0 | |
| American Independent | James C. Griffin | 27,818 | 0.28% | 0 | |
| No party | David Duke (write-in) | 483 | 0.00% | 0 | |
| No party | Eugene McCarthy (write-in) | 234 | 0.00% | 0 | |
| No party | Herbert G. Lewin (write-in) | 58 | 0.00% | 0 | |
| No party | Write-in | 25 | 0.00% | 0 | |
| No party | Larry Holmes (write-in) | 11 | 0.00% | 0 | |
| Invalid or blank votes | — | ||||
| Totals | 9,887,064 | 100.00% | 47 | ||
| Voter turnout | — | ||||
Results Breakdown
By county
| County | Bush | Votes | Dukakis | Votes | Others | Votes |
|---|---|---|---|---|---|---|
| Orange | 67.75% | 586,230 | 31.09% | 269,013 | 1.16% | 10,064 |
| Sutter | 67.47% | 14,100 | 31.09% | 6,557 | 1.15% | 241 |
| Inyo | 64.34% | 5,042 | 33.85% | 2,653 | 1.81% | 142 |
| Modoc | 62.68% | 2,518 | 35.25% | 1,416 | 2.07% | 83 |
| Glenn | 62.06% | 4,944 | 36.33% | 2,894 | 1.61% | 128 |
| Ventura | 61.64% | 147,604 | 37.19% | 89,065 | 1.17% | 2,804 |
| Kern | 61.48% | 90,550 | 37.40% | 55,083 | 1.13% | 1,660 |
| Mono | 61.38% | 2,177 | 36.20% | 1,284 | 2.42% | 86 |
| Yuba | 61.37% | 8,937 | 37.38% | 5,444 | 1.25% | 182 |
| San Diego | 60.19% | 523,143 | 38.34% | 333,264 | 1.47% | 12,788 |
| San Bernardino | 59.99% | 235,167 | 38.55% | 151,118 | 1.46% | 5,723 |
| Tulare | 59.61% | 46,891 | 39.04% | 30,711 | 1.36% | 1,067 |
| Placer | 59.59% | 42,096 | 38.95% | 27,516 | 1.46% | 1,030 |
| Colusa | 59.49% | 3,077 | 39.10% | 2,022 | 1.41% | 73 |
| Riverside | 59.46% | 199,979 | 39.58% | 133,122 | 0.97% | 3,247 |
| Shasta | 59.36% | 32,402 | 38.79% | 21,171 | 1.85% | 1,012 |
| El Dorado | 59.33% | 30,021 | 39.13% | 19,801 | 1.54% | 781 |
| Lassen | 58.59% | 5,157 | 39.15% | 3,446 | 2.26% | 199 |
| Nevada | 57.76% | 21,383 | 40.46% | 14,980 | 1.78% | 660 |
| Tehama | 56.52% | 9,854 | 41.37% | 7,213 | 2.11% | 367 |
| Kings | 56.41% | 12,118 | 42.56% | 9,142 | 1.03% | 222 |
| Calaveras | 56.28% | 7,640 | 41.80% | 5,674 | 1.92% | 260 |
| Butte | 56.04% | 40,143 | 42.45% | 30,406 | 1.51% | 1,082 |
| Amador | 55.87% | 6,893 | 42.12% | 5,197 | 2.01% | 248 |
| San Luis Obispo | 55.85% | 46,613 | 42.73% | 35,667 | 1.42% | 1,187 |
| Alpine | 55.43% | 306 | 41.67% | 230 | 2.90% | 16 |
| Imperial | 55.16% | 12,889 | 43.84% | 10,243 | 1.00% | 233 |
| Trinity | 54.63% | 3,267 | 42.11% | 2,518 | 3.26% | 195 |
| Madera | 54.59% | 13,255 | 43.83% | 10,642 | 1.58% | 384 |
| Mariposa | 54.53% | 3,768 | 43.39% | 2,998 | 2.08% | 144 |
| San Joaquin | 54.39% | 75,309 | 44.56% | 61,699 | 1.04% | 1,445 |
| Santa Barbara | 54.24% | 77,524 | 44.48% | 63,586 | 1.28% | 1,830 |
| San Benito | 54.11% | 5,578 | 44.23% | 4,559 | 1.66% | 171 |
| Tuolumne | 54.00% | 10,646 | 44.22% | 8,717 | 1.79% | 352 |
| Stanislaus | 53.07% | 51,648 | 45.92% | 44,685 | 1.01% | 982 |
| Merced | 51.20% | 21,717 | 47.40% | 20,105 | 1.40% | 592 |
| Plumas | 51.06% | 4,603 | 47.15% | 4,251 | 1.79% | 161 |
| Sacramento | 51.01% | 201,832 | 47.65% | 188,557 | 1.34% | 5,301 |
| Siskiyou | 50.88% | 9,056 | 47.00% | 8,365 | 2.11% | 376 |
| Sierra | 50.71% | 860 | 46.64% | 791 | 2.65% | 45 |
| Napa | 50.19% | 23,235 | 48.14% | 22,283 | 1.67% | 772 |
| Fresno | 49.95% | 94,835 | 48.79% | 92,635 | 1.26% | 2,400 |
| Monterey | 49.83% | 50,022 | 48.81% | 48,998 | 1.36% | 1,361 |
| Del Norte | 49.73% | 3,714 | 48.03% | 3,587 | 2.24% | 167 |
| Lake | 48.03% | 9,366 | 50.39% | 9,828 | 1.58% | 308 |
| Contra Costa | 47.86% | 158,652 | 51.10% | 169,411 | 1.04% | 3,448 |
| Solano | 47.43% | 50,314 | 51.23% | 54,344 | 1.35% | 1,430 |
| Santa Clara | 46.99% | 254,442 | 51.30% | 277,810 | 1.71% | 9,276 |
| Los Angeles | 46.88% | 1,239,716 | 51.89% | 1,372,352 | 1.23% | 32,603 |
| San Mateo | 42.94% | 109,261 | 55.74% | 141,859 | 1.32% | 3,360 |
| Mendocino | 41.94% | 12,979 | 55.42% | 17,152 | 2.64% | 816 |
| Sonoma | 41.91% | 67,725 | 56.48% | 91,262 | 1.61% | 2,596 |
| Yolo | 41.89% | 22,358 | 57.01% | 30,429 | 1.10% | 585 |
| Humboldt | 41.15% | 21,460 | 57.11% | 29,781 | 1.74% | 905 |
| Marin | 39.73% | 46,855 | 58.85% | 69,394 | 1.42% | 1,671 |
| Santa Cruz | 36.77% | 37,728 | 61.53% | 63,133 | 1.71% | 1,750 |
| Alameda | 33.99% | 162,815 | 64.78% | 310,283 | 1.23% | 5,899 |
| San Francisco | 26.14% | 72,503 | 72.78% | 201,887 | 1.08% | 3,004 |
References
- ↑ "1988 Presidential General Election Results - California". Dave Leip's U.S. Election Atlas. Retrieved 2008-08-25.