Rockwall County, Texas
Rockwall County is a county in the U.S. state of Texas. At 149 square miles, Rockwall County has the smallest area of any Texas county. As of the 2010 census, its population was 78,337.[1] Its county seat is Rockwall.[2] The county and city are named for a wall-like subterranean rock formation that runs throughout the county.
Rockwall County | |
|---|---|
 The Rockwall County Courthouse in Rockwall | |
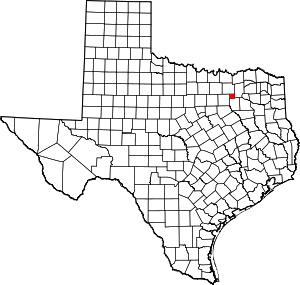 Location within the U.S. state of Texas | |
 Texas's location within the U.S. | |
| Coordinates: 32°53′N 96°25′W | |
| Country | |
| State | |
| Founded | 1873 |
| Named for | Rockwall, Texas, named in turn for its clastic dikes |
| Seat | Rockwall |
| Largest city | Dallas |
| Area | |
| • Total | 149 sq mi (390 km2) |
| • Land | 127 sq mi (330 km2) |
| • Water | 22 sq mi (60 km2) 15%% |
| Population | |
| • Estimate (2019) | 104,915 |
| Demonym(s) | Rockwallian |
| Time zone | UTC−6 (Central) |
| • Summer (DST) | UTC−5 (CDT) |
| Congressional district | 4th |
| Website | www |
Rockwall County is part of the Dallas-Fort Worth-Arlington, TX Metropolitan Statistical Area. It was one of the top 25 fastest-growing counties in the U.S. in 2010.[3] Rockwall County is listed as the 6th wealthiest county in Texas.
Cities in Rockwall county include Rockwall, Royse City, Fate, McClendon-Chisholm, Mobile City, and part of Rowlett.
History
Rockwall County was formed in 1873 from portions of Kaufman County. It split off because access to the county seat of Kaufman was inconvenient. It was named for its county seat, Rockwall. Rockwall county also is home to the great rock wall which is no longer in public view today. [4]
Geography
According to the U.S. Census Bureau, the county has an area of 149 square miles (390 km2), of which 127 square miles (330 km2) is land and 22 square miles (57 km2) (15%) is water.[5] It is the smallest county by area in Texas.
Major highways
.svg.png)


Adjacent counties
- Collin County (north)
- Hunt County (east)
- Kaufman County (south)
- Dallas County (west)
Demographics
| Historical population | |||
|---|---|---|---|
| Census | Pop. | %± | |
| 1880 | 2,984 | — | |
| 1890 | 5,972 | 100.1% | |
| 1900 | 8,531 | 42.8% | |
| 1910 | 8,072 | −5.4% | |
| 1920 | 8,591 | 6.4% | |
| 1930 | 7,658 | −10.9% | |
| 1940 | 7,051 | −7.9% | |
| 1950 | 6,156 | −12.7% | |
| 1960 | 5,878 | −4.5% | |
| 1970 | 7,046 | 19.9% | |
| 1980 | 14,528 | 106.2% | |
| 1990 | 25,604 | 76.2% | |
| 2000 | 43,080 | 68.3% | |
| 2010 | 78,337 | 81.8% | |
| Est. 2019 | 104,915 | [6] | 33.9% |
| U.S. Decennial Census[7] 1850–2010[8] 2010–2014[1] | |||
As of the census[9] of 2000, there were 43,080 people, 14,530 households, and 11,972 families residing in the county. The population density was 334 people per square mile (129/km²). There were 15,351 housing units at an average density of 119 per square mile (46/km²). The racial makeup of the county was 89.17% White, 3.24% Black or African American, 0.40% Native American, 1.32% Asian, 0.05% Pacific Islander, 4.45% from other races, and 1.37% from two or more races. 11.07% of the population were Hispanic or Latino of any race.
There were 14,530 households out of which 44.40% had children under the age of 18 living with them, 71.00% were married couples living together, 8.00% had a female householder with no husband present, and 17.60% were non-families. 14.40% of all households were made up of individuals and 4.40% had someone living alone who was 65 years of age or older. The average household size was 2.92 and the average family size was 3.23.
In the county, the population was spread out with 30.10% under the age of 18, 7.00% from 18 to 24, 31.10% from 25 to 44, 23.30% from 45 to 64, and 8.60% who were 65 years of age or older. The median age was 35 years. For every 100 females, there were 100.80 males. For every 100 females age 18 and over, there were 96.90 males.
The median income for a household in the county was $65,164, and the median income for a family was $71,448 (these figures had risen to $75,915 and $82,150 respectively as of a 2007 estimate[10]). Males had a median income of $49,636 versus $32,410 for females. The per capita income for the county was $28,573. About 3.80% of families and 4.70% of the population were below the poverty line, including 5.60% of those under age 18 and 4.10% of those age 65 or over.
Rockwall County was ranked the sixth fastest-growing county in the nation by the US Census Bureau from 2000 to 2010, adding 35,257 people (an 81.8% change).
Education
The following school districts serve Rockwall County:
- Rockwall Independent School District (small portion in Kaufman County)
- Royse City Independent School District (small portion in Collin, Hunt counties)
From circa 1997 and 2015 the number of non-Hispanic white children in K-12 schools in the county increased by 6,000 as part of a trend of white flight and suburbanization by non-Hispanic white families.[11]
Communities
Cities[12]
- Dallas (mostly in Dallas County with small parts in Collin, Denton, Kaufman and Rockwall counties)
- Fate
- Garland (mostly in Dallas County with a small part in Collin County)
- Heath (small part in Kaufman County)
- McLendon-Chisholm
- Mobile City
- Rockwall (county seat)
- Rowlett (mostly in Dallas County)
- Royse City (partly in Collin and Hunt counties)
- Wylie (mostly in Collin County and a small part in Dallas County)
Politics
Prior to 1972, Rockwall County was a Democratic Party stronghold at the presidential level The 1968 election was highly transitional for the county with Hubert Humphrey only winning with 39% of the vote thanks to the strong third-party candidacy of George Wallace. From 1972 on, the county has become a Republican Party stronghold in presidential elections. George H.W. Bush in 1992 being the only Republican to fail to win a majority in the county since then. as the strong third-party candidacy of Ross Perot that year led him to a second-place finish in the county over national winner Bill Clinton. However, the county was represented in Congress by a conservative Democrat as late as January 2004, when Representative & Rockwall resident Ralph Hall, switched parties to the Republican Party.
| Year | Republican | Democratic | Third parties |
|---|---|---|---|
| 2016 | 70.8% 28,451 | 24.0% 9,655 | 5.2% 2,074 |
| 2012 | 75.8% 27,113 | 22.7% 8,120 | 1.5% 531 |
| 2008 | 72.5% 23,300 | 26.4% 8,492 | 1.2% 370 |
| 2004 | 78.7% 20,120 | 20.8% 5,320 | 0.6% 141 |
| 2000 | 77.4% 13,666 | 20.6% 3,642 | 2.0% 344 |
| 1996 | 65.0% 8,319 | 25.7% 3,289 | 9.3% 1,188 |
| 1992 | 48.4% 6,427 | 18.1% 2,397 | 33.5% 4,445 |
| 1988 | 72.6% 7,214 | 26.8% 2,659 | 0.7% 66 |
| 1984 | 80.1% 6,688 | 19.6% 1,639 | 0.3% 22 |
| 1980 | 65.3% 4,036 | 32.1% 1,985 | 2.6% 163 |
| 1976 | 53.0% 2,087 | 46.4% 1,828 | 0.5% 21 |
| 1972 | 75.1% 1,890 | 24.2% 610 | 0.7% 18 |
| 1968 | 31.1% 614 | 39.4% 778 | 29.5% 583 |
| 1964 | 25.4% 445 | 74.4% 1,305 | 0.3% 5 |
| 1960 | 41.2% 652 | 57.9% 917 | 0.9% 14 |
| 1956 | 41.5% 657 | 58.1% 920 | 0.4% 6 |
| 1952 | 33.7% 602 | 65.8% 1,175 | 0.5% 8 |
| 1948 | 9.4% 117 | 75.6% 947 | 15.0% 188 |
| 1944 | 7.2% 98 | 84.9% 1,153 | 7.9% 107 |
| 1940 | 5.9% 95 | 94.1% 1,510 | |
| 1936 | 2.2% 26 | 97.7% 1,168 | 0.1% 1 |
| 1932 | 4.8% 62 | 95.2% 1,237 | |
| 1928 | 25.4% 289 | 74.6% 850 | |
| 1924 | 6.3% 93 | 93.2% 1,371 | 0.5% 7 |
| 1920 | 10.5% 104 | 87.8% 873 | 1.7% 17 |
| 1916 | 3.1% 27 | 95.0% 828 | 2.0% 17 |
| 1912 | 0.0% 0 | 95.8% 642 | 4.2% 28 |
See also
- List of museums in North Texas
- National Register of Historic Places listings in Rockwall County, Texas
- Recorded Texas Historic Landmarks in Rockwall County
- Texas locations by per capita income
References
- "State & County QuickFacts". United States Census Bureau. Retrieved December 23, 2013.
- "Find a County". National Association of Counties. Retrieved 2011-06-07.
- /2010-03-23-census23_N.htm Texas big census winner this decade]
- http://www.todayifoundout.com/index.php/2017/02/mysterious-rock-walls-rockwall-texas/
- "2010 Census Gazetteer Files". United States Census Bureau. August 22, 2012. Retrieved May 9, 2015.
- "Population and Housing Unit Estimates". United States Census Bureau. May 24, 2020. Retrieved May 27, 2020.
- "U.S. Decennial Census". United States Census Bureau. Retrieved May 9, 2015.
- "Texas Almanac: Population History of Counties from 1850–2010" (PDF). Texas Almanac. Retrieved May 9, 2015.
- "U.S. Census website". United States Census Bureau. Retrieved 2011-05-14.
- U.S. Census Bureau Fact Finder
- Nicholson, Eric (2016-05-03). "In Dallas, White Flight Never Ends". Dallas Observer. Retrieved 2019-10-29.
- "Population of Texas Cities and Towns Sorted by County". The County Information Project Texas Association of Counties. Retrieved 16 March 2015.
- Leip, David. "Dave Leip's Atlas of U.S. Presidential Elections". uselectionatlas.org. Retrieved 2018-07-29.
External links
- Rockwall County government's website
- Rockwall County from the Handbook of Texas Online
Places adjacent to Rockwall County, Texas | ||||||||||
|---|---|---|---|---|---|---|---|---|---|---|
| ||||||||||
Municipalities and communities of Rockwall County, Texas, United States | ||
|---|---|---|
| Cities | Rockwall County map | |
| Footnotes | ‡This populated place also has portions in an adjacent county or counties | |
| Authority control |
|
|---|