El Paso County, Texas
El Paso County is the westernmost county in the U.S. state of Texas. As of the 2010 census, the population was 800,647,[1] making it the sixth-most populous county in the state of Texas. Its seat is the city of El Paso,[2] the sixth-most populous city in Texas and the 22nd-most populous city in the United States. The county was created in 1850 and later organized in 1871.[3]
El Paso County | |
|---|---|
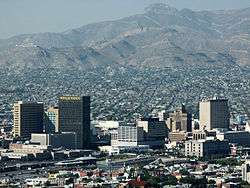 El Paso skyline | |
 Seal | |
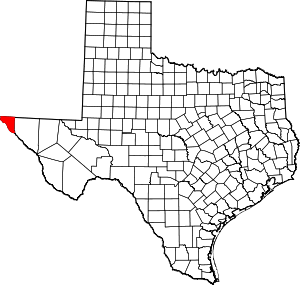 Location within the U.S. state of Texas | |
 Texas's location within the U.S. | |
| Coordinates: 31°46′N 106°14′W | |
| Country | |
| State | |
| Founded | 1871 |
| Seat | El Paso |
| Largest city | El Paso |
| Area | |
| • Total | 1,015 sq mi (2,630 km2) |
| • Land | 1,013 sq mi (2,620 km2) |
| • Water | 2.3 sq mi (6 km2) 0.2%% |
| Population | |
| • Estimate (2019) | 839,238 |
| • Density | 830/sq mi (320/km2) |
| Time zone | UTC−7 (Mountain) |
| • Summer (DST) | UTC−6 (MDT) |
| Congressional districts | 16th, 23rd |
| Website | www |
El Paso is short for "El Paso del Norte", which is Spanish for "The Pass of the North". It is named for the pass the Rio Grande creates through the mountains on either side of the river. The county is northeast of the Mexico–United States border.
El Paso County is included in the El Paso metropolitan area. Along with Hudspeth County, it is one of two counties in Texas in the Mountain Time Zone (all other Texas counties use Central Time). El Paso County is one of nine counties that comprise the Trans-Pecos region of West Texas.
Geography
According to the U.S. Census Bureau, the county has a total area of 1,015 square miles (2,630 km2), of which 1,013 square miles (2,620 km2) is land and 2.3 square miles (6.0 km2) (0.2%) is water.[4][5][6][7][8][9]
Adjacent counties and municipalities
- Doña Ana County, New Mexico – northwest
- Otero County, New Mexico – northeast
- Hudspeth County, Texas – east
- Guadalupe, Chihuahua, Mexico – south
- Juárez, Chihuahua, Mexico – southwest
- Práxedis G. Guerrero, Chihuahua, Mexico – southeast
National protected area
- Chamizal National Memorial
- El Camino Real de Tierra Adentro National Historic Trail (part)
Demographics
| Historical population | |||
|---|---|---|---|
| Census | Pop. | %± | |
| 1860 | 4,051 | — | |
| 1870 | 3,671 | −9.4% | |
| 1880 | 3,845 | 4.7% | |
| 1890 | 15,678 | 307.8% | |
| 1900 | 24,886 | 58.7% | |
| 1910 | 52,599 | 111.4% | |
| 1920 | 101,877 | 93.7% | |
| 1930 | 131,597 | 29.2% | |
| 1940 | 131,067 | −0.4% | |
| 1950 | 194,968 | 48.8% | |
| 1960 | 314,070 | 61.1% | |
| 1970 | 359,291 | 14.4% | |
| 1980 | 479,899 | 33.6% | |
| 1990 | 591,610 | 23.3% | |
| 2000 | 679,622 | 14.9% | |
| 2010 | 800,647 | 17.8% | |
| Est. 2019 | 839,238 | [10] | 4.8% |
| U.S. Decennial Census[11] 1850–2010[12] 2010–2019[1] | |||
2015 Texas population estimate program
As of the 2015 Texas population estimate program, the population of the county was 837,353: Hispanics and Latinos (of any race), 698,534 (83.4%), non-Hispanic whites, 97,439 (11.6%); non-Hispanic blacks, 21,137 (2.5%); other non-Hispanics, 20,243 (2.4%);[13]
2010 Census
As of the 2010 United States Census, there were 800,647 people living in the county. 82.1% were White of largely Hispanic descent, 10.5% of other races, 3.1% African American or Black, 2.5% of two or more races, 1.0% Asian, 0.8% Native American and 0.1% Pacific Islander. 82.2% were Latino (of any race).
2000 Census
As of the census[14] of 2000, there were 679,622 people, 210,022 households, and 166,127 families living in the county. The population density was 671 people per square mile (259/km²). There were 224,447 housing units at an average density of 222 per square mile (86/km²). The city was 78.23% Latino of any race. The racial makeup of the county was 73.95% White, 17.91% from other races, 3.06% African American or Black, 0.82% Native American, 0.98% Asian, 0.10% Pacific Islander, and 3.19% from two or more races.
There were 210,022 households out of which 44.90% had children under the age of 18 living with them, 56.70% were married couples living together, 18.00% had a female householder with no husband present, and 20.90% were non-families. 17.80% of all households were made up of individuals and 6.70% had someone living alone who was 65 years of age or older. The average household size was 3.18 and the average family size was 3.63.
In the county, the population was spread out with 32.00% under the age of 18, 10.60% from 18 to 24, 29.30% from 25 to 44, 18.40% from 45 to 64, and 9.70% who were 65 years of age or older. The median age was 30 years. For every 100 females there were 93.20 males. For every 100 females age 18 and over, there were 88.70 males.
The median income for a household in the county was $31,051, and the median income for a family was $33,410. Males had a median income of $26,882 versus $20,722 for females. The per capita income for the county was $13,421. About 20.50% of families and 23.80% of the population were below the poverty line, including 31.50% of those under age 18 and 18.50% of those age 65 or over.
Politics
Most of El Paso County is included in the 16th Congressional District in the U.S House, represented by Democrat Veronica Escobar. A small eastern portion of the county is in the 23rd Congressional District, represented since 2015 by Republican Will Hurd. El Paso County is historically Democratic and the 2008 presidential election was no exception. Democrat Barack Obama won 66% of the vote with 121,589 votes even though he lost the entire state of Texas by about 946,000 votes. Republican John McCain won 33% of the vote in El Paso County with 61,598 votes. Other candidates won 1% of the vote. In 2004, Democrat John F. Kerry won El Paso County but by a smaller margin than Barack Obama. John Kerry won 56% of the vote and 95,142 votes. Republican George W. Bush won 43% of the vote with 73,261 votes. Other candidates won 1% of the vote.
| Year | Republican | Democratic | Third parties |
|---|---|---|---|
| 2016 | 25.7% 55,512 | 68.5% 147,843 | 5.8% 12,567 |
| 2012 | 33.1% 57,150 | 65.4% 112,952 | 1.5% 2,601 |
| 2008 | 33.3% 61,783 | 65.7% 122,021 | 1.0% 1,826 |
| 2004 | 43.2% 73,261 | 56.1% 95,142 | 0.7% 1,170 |
| 2000 | 39.7% 57,574 | 57.8% 83,848 | 2.5% 3,620 |
| 1996 | 32.1% 43,255 | 62.3% 83,964 | 5.6% 7,491 |
| 1992 | 34.9% 47,224 | 50.1% 67,715 | 15.0% 20,224 |
| 1988 | 46.8% 55,573 | 52.7% 62,622 | 0.5% 586 |
| 1984 | 55.8% 66,114 | 43.8% 51,917 | 0.3% 399 |
| 1980 | 53.5% 53,276 | 40.3% 40,082 | 6.2% 6,168 |
| 1976 | 47.7% 42,697 | 50.8% 45,477 | 1.4% 1,291 |
| 1972 | 60.2% 49,981 | 39.0% 32,435 | 0.8% 674 |
| 1968 | 44.6% 30,347 | 47.9% 32,658 | 7.5% 5,111 |
| 1964 | 37.0% 20,687 | 62.7% 35,050 | 0.3% 190 |
| 1960 | 45.2% 21,551 | 54.6% 26,027 | 0.2% 99 |
| 1956 | 54.7% 18,532 | 44.7% 15,157 | 0.6% 193 |
| 1952 | 57.7% 20,005 | 42.1% 14,595 | 0.1% 47 |
| 1948 | 25.9% 5,544 | 71.5% 15,341 | 2.6% 563 |
| 1944 | 13.2% 2,072 | 72.7% 11,426 | 14.1% 2,220 |
| 1940 | 23.3% 3,764 | 76.6% 12,374 | 0.2% 27 |
| 1936 | 12.8% 1,773 | 86.3% 11,920 | 0.8% 116 |
| 1932 | 19.7% 2,841 | 78.8% 11,336 | 1.5% 215 |
| 1928 | 49.7% 6,050 | 50.3% 6,114 | |
| 1920 | 49.1% 4,070 | 50.0% 4,143 | 0.9% 73 |
| 1916 | 32.1% 1,770 | 65.3% 3,603 | 2.6% 145 |
| 1912 | 7.2% 291 | 72.2% 2,914 | 20.6% 832 |
The El Paso County Sheriff's Office is headquartered in an unincorporated area in El Paso County.[16] At one point it was headquartered within the City of El Paso.[17] The Leo Samaniego Law Enforcement Complex is adjacent to the sheriff's office headquarters.[18]
Like all Texas counties, El Paso County is governed by a Commissioners Court, which consists of a County Judge, who is elected county-wide, and four County Commissioners, who represent individual precincts.[19] While the County Judge possesses some traditional powers of a judge, the County Judge functions primarily as the chief executive of the county. The County Judge presides over Commissioners Court meetings, casts one vote on Commissioners Court (as do County Commissioners), and lacks veto authority.
The El Paso County Judge is Ruben Vogt, and the county commissioners are Carlos Leon (Precinct 1), David Stout (Precinct 2), Vince Perez (Precinct 3),[20] and Andrew Haggerty (Precinct 4). Haggerty is a Republican, the other commissioners and the county judge are Democrats.
Vogt was appointed County Judge in October 2017 by the County Commissioners, following County Judge Veronica Escobar's resignation to run for Congress. He was previously Escobar's chief of staff. He will serve the remainder of her term, through the end of 2018.[21] Leon and Perez were first elected to their positions in 2012, were re-elected in 2016,[22] and have been in office since 2013. Haggerty and Stout were first elected to their positions in 2014, and have been in office since 2015.[23]
History
The first woman to hold elected office in El Paso County was a teacher, Myra Carroll Winkler, who was elected as superintendent of El Paso County schools in 1912.[24][25]
Communities
Cities
Village
Census-designated places
Military Base
Unincorporated communities
See also
References
- "State & County QuickFacts". United States Census Bureau. Archived from the original on October 2, 2011. Retrieved December 10, 2013.
- "Find a County". National Association of Counties. Archived from the original on 2012-07-12. Retrieved 2011-06-07.
- "Texas: Individual County Chronologies". Texas Atlas of Historical County Boundaries. The Newberry Library. 2008. Retrieved May 23, 2015.
- "2010 Census Gazetteer Files". United States Census Bureau. August 22, 2012. Retrieved April 26, 2015.
- "Distance from Portland to Seattle". check-distance.com. Retrieved 6 May 2019.
- "Distance from San Diego to Los Angeles". check-distance.com. Retrieved 6 May 2019.
- "Distance from Denver to Chicago". check-distance.com. Retrieved 6 May 2019.
- "Distance from Denver to Colorado Springs". check-distance.com. Retrieved 6 May 2019.
- "Distance from Miami to Orlando". check-distance.com. Retrieved 6 May 2019.
- "Population and Housing Unit Estimates". United States Census Bureau. May 24, 2020. Retrieved May 27, 2020.
- "U.S. Decennial Census". United States Census Bureau. Retrieved April 26, 2015.
- "Texas Almanac: Population History of Counties from 1850–2010" (PDF). Texas Almanac. Retrieved April 26, 2015.
- Estimates of the Population by Age, Sex, and Race/Ethnicity for July 1, 2015 for State of Texas (PDF), July 15, 2015, archived from the original (PDF) on May 4, 2017, retrieved June 8, 2017
- "U.S. Census website". United States Census Bureau. Retrieved 2011-05-14.
- Leip, David. "Dave Leip's Atlas of U.S. Presidential Elections". uselectionatlas.org.
- "Contact Us Archived 2009-07-20 at the Wayback Machine." El Paso County Sheriff's Office. Retrieved on December 6, 2009.
- "Administration Division." El Paso County Sheriff's Office. April 5, 2001. Retrieved on December 6, 2009.
- "Communications Department Archived 2010-01-04 at the Wayback Machine." El Paso County. Retrieved on December 6, 2009.
- "County Commissioners Maps". Epcountyvotes.com. Archived from the original on 2013-10-08. Retrieved 2013-08-30.
- "Leon, Perez take posts Tuesday". El Paso Times. January 1, 2013. Archived from the original on January 22, 2013. Retrieved January 3, 2015.
- "Commissioners choose County Judge Veronica Escobar's chief of staff to replace her". elpasotimes.com.
- "Commissioners Leon, Perez sworn in to second term". elpasotimes.com.
- "Two new faces to join El Paso County Commissioners Court in the new year". El Paso Times.com. Archived from the original on December 29, 2014. Retrieved July 16, 2015.
- "Forty Years Ago". El Paso Times. 1952-11-14. p. 6. Retrieved 2019-12-02 – via Newspapers.com.
- Longo, Joseph (Spring 2016). "Early El Paso Women Political Pioneers: 1912-1952". Password. 60 (1): 15.
External links
- El Paso County Official web site
- El Paso County in Handbook of Texas Online at the University of Texas
- Historic El Paso County materials, hosted by the Portal to Texas History.
- Fort Bliss National Cemetery Disgrace Video
Places adjacent to El Paso County, Texas | |
|---|---|
Municipalities and communities of El Paso County, Texas, United States | ||
|---|---|---|
| Cities | El Paso County map | |
| Towns | ||
| Village | ||
| CDPs | ||
| Other unincorporated communities | ||
| Indian reservation | ||

| Authority control |
|
|---|