Fannin County, Texas
Fannin County is a county in the far north of the U.S. state of Texas on the border with Oklahoma. As of the 2010 census, its population was 33,915.[1] The county seat is Bonham.[2] The county was named for James Fannin,[3] who commanded the group of Texans killed in the Goliad Massacre during the Texas Revolution. James Bonham (the county seat's namesake) sought Fannin's assistance for the Battle of the Alamo, but Fannin was unable to provide it.
Fannin County | |
|---|---|
 Fannin County Courthouse in Bonham | |
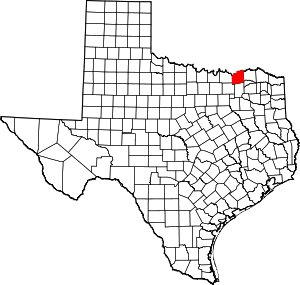 Location within the U.S. state of Texas | |
 Texas's location within the U.S. | |
| Coordinates: 33°35′N 96°07′W | |
| Country | |
| State | |
| Founded | 1838 |
| Named for | James Fannin |
| Seat | Bonham |
| Largest city | Bonham |
| Area | |
| • Total | 899 sq mi (2,330 km2) |
| • Land | 891 sq mi (2,310 km2) |
| • Water | 8.0 sq mi (21 km2) 0.9%% |
| Population (2010) | |
| • Total | 33,915 |
| • Estimate (2019) | 35,514 |
| • Density | 38/sq mi (15/km2) |
| Time zone | UTC−6 (Central) |
| • Summer (DST) | UTC−5 (CDT) |
| Congressional district | 4th |
| Website | www |
The county was created in 1837 and organized the next year.[4][5]
Fannin County is a part of the Texoma region.
Geography
According to the U.S. Census Bureau, the county has a total area of 899 square miles (2,330 km2), of which 891 square miles (2,310 km2) are land and 8.0 square miles (21 km2) (0.9%) are covered by water.[6] It is drained by Bois D'Arc Creek and Sulphur River.[7]
Major highways


Adjacent counties
- Bryan County, Oklahoma (north)
- Lamar County (east)
- Delta County (southeast)
- Hunt County (south)
- Collin County (southwest)
- Grayson County (west)
National protected area
Demographics
| Historical population | |||
|---|---|---|---|
| Census | Pop. | %± | |
| 1850 | 3,788 | — | |
| 1860 | 9,217 | 143.3% | |
| 1870 | 13,207 | 43.3% | |
| 1880 | 25,501 | 93.1% | |
| 1890 | 38,709 | 51.8% | |
| 1900 | 51,793 | 33.8% | |
| 1910 | 44,801 | −13.5% | |
| 1920 | 48,186 | 7.6% | |
| 1930 | 41,163 | −14.6% | |
| 1940 | 41,064 | −0.2% | |
| 1950 | 31,253 | −23.9% | |
| 1960 | 23,880 | −23.6% | |
| 1970 | 22,705 | −4.9% | |
| 1980 | 24,285 | 7.0% | |
| 1990 | 24,804 | 2.1% | |
| 2000 | 31,242 | 26.0% | |
| 2010 | 33,915 | 8.6% | |
| Est. 2019 | 35,514 | [8] | 4.7% |
| U.S. Decennial Census[9] 1850–2010[10] 2010–2014[1] County Information Program[11] | |||
As of the census[12] of 2000, there were 31,242 people, 11,105 households, and 7,984 families residing in the county. The population density was 35 people per square mile (14/km²). There were 12,887 housing units at an average density of 14 per square mile (6/km²). The racial makeup of the county was 86.56% White, 7.96% Black or African American, 0.92% Native American, 0.26% Asian, 0.03% Pacific Islander, 2.78% from other races, and 1.49% from two or more races. 5.61% of the population were Hispanic or Latino of any race. As of 2015 the largest self-reported ancestry groups were 48.50% English, 16.10% Welsh, 11.00% German and 7.25% Irish.
There were 11,105 households out of which 31.10% had children under the age of 18 living with them, 57.90% were married couples living together, 10.30% had a female householder with no husband present, and 28.10% were non-families. 25.20% of all households were made up of individuals and 12.70% had someone living alone who was 65 years of age or older. The average household size was 2.51 and the average family size was 2.99.
In the county, the population was spread out with 23.20% under the age of 18, 8.90% from 18 to 24, 28.60% from 25 to 44, 23.20% from 45 to 64, and 16.10% who were 65 years of age or older. The median age was 38 years. For every 100 females there were 113.80 males. For every 100 females age 18 and over, there were 116.90 males.
The median income for a household in the county was $34,501, and the median income for a family was $42,193. Males had a median income of $31,140 versus $23,101 for females. The per capita income for the county was $16,066. About 9.90% of families and 13.90% of the population were below the poverty line, including 17.70% of those under age 18 and 16.50% of those age 65 or over.
Communities
Cities
- Bailey
- Bonham (county seat)
- Ector
- Honey Grove
- Leonard
- Pecan Gap (mostly in Delta County)
- Ravenna
- Savoy
- Trenton (small part in Grayson County)
Towns
- Dodd City
- Ladonia
- Whitewright (mostly in Grayson County)[13]
- Windom
Politics
| Year | Republican | Democratic | Third parties |
|---|---|---|---|
| 2016 | 79.3% 9,548 | 17.7% 2,132 | 3.0% 364 |
| 2012 | 75.5% 8,161 | 23.0% 2,486 | 1.5% 157 |
| 2008 | 69.2% 8,092 | 29.6% 3,464 | 1.2% 138 |
| 2004 | 66.0% 7,893 | 33.5% 4,001 | 0.6% 66 |
| 2000 | 58.7% 6,074 | 39.7% 4,102 | 1.6% 164 |
| 1996 | 39.7% 3,495 | 48.6% 4,276 | 11.7% 1,025 |
| 1992 | 26.1% 2,510 | 43.3% 4,164 | 30.6% 2,941 |
| 1988 | 43.7% 4,024 | 56.0% 5,163 | 0.3% 27 |
| 1984 | 51.5% 4,692 | 48.3% 4,399 | 0.2% 15 |
| 1980 | 37.1% 3,196 | 61.4% 5,284 | 1.5% 131 |
| 1976 | 26.3% 2,102 | 73.2% 5,845 | 0.5% 38 |
| 1972 | 61.9% 3,826 | 37.1% 2,295 | 1.0% 60 |
| 1968 | 22.1% 1,585 | 54.8% 3,931 | 23.1% 1,661 |
| 1964 | 16.9% 1,219 | 83.0% 5,976 | 0.1% 5 |
| 1960 | 30.0% 1,844 | 69.8% 4,282 | 0.2% 12 |
| 1956 | 29.8% 1,910 | 70.2% 4,504 | 0.1% 6 |
| 1952 | 28.1% 2,099 | 71.8% 5,363 | 0.0% 3 |
| 1948 | 7.8% 553 | 86.8% 6,132 | 5.4% 380 |
| 1944 | 9.5% 677 | 83.5% 5,984 | 7.0% 502 |
| 1940 | 9.6% 792 | 90.4% 7,478 | 0.1% 6 |
| 1936 | 6.6% 368 | 93.3% 5,242 | 0.1% 7 |
| 1932 | 7.9% 460 | 91.8% 5,338 | 0.3% 17 |
| 1928 | 45.6% 2,122 | 54.3% 2,525 | 0.1% 4 |
| 1924 | 10.1% 653 | 86.6% 5,596 | 3.3% 213 |
| 1920 | 21.3% 1,103 | 66.8% 3,461 | 11.9% 618 |
| 1916 | 11.2% 471 | 83.0% 3,493 | 5.8% 245 |
| 1912 | 7.3% 227 | 85.0% 2,661 | 7.7% 241 |
See also
References
- "State & County QuickFacts". United States Census Bureau. Archived from the original on June 24, 2011. Retrieved December 16, 2013.
- "Find a County". National Association of Counties. Archived from the original on 2011-05-31. Retrieved 2011-06-07.
- Gannett, Henry (1905). The Origin of Certain Place Names in the United States. Govt. Print. Off. pp. 123.
- "Texas: Individual County Chronologies". Texas Atlas of Historical County Boundaries. The Newberry Library. 2008. Retrieved June 20, 2015.
- "Fannin County". Texas Almanac. Texas State Historical Association. Retrieved June 20, 2015.
- "2010 Census Gazetteer Files". United States Census Bureau. August 22, 2012. Retrieved April 26, 2015.
-

- "Population and Housing Unit Estimates". United States Census Bureau. May 24, 2020. Retrieved May 27, 2020.
- "U.S. Decennial Census". United States Census Bureau. Retrieved April 26, 2015.
- "Texas Almanac: Population History of Counties from 1850–2010" (PDF). Texas Almanac. Retrieved April 26, 2015.
- "Fannin County Profile". Retrieved November 18, 2019.
- "U.S. Census website". United States Census Bureau. Retrieved 2011-05-14.
- "Texas Cities and Towns Sorted by County". www.county.org. Retrieved 2016-12-26.
- Leip, David. "Dave Leip's Atlas of U.S. Presidential Elections". uselectionatlas.org. Retrieved 2018-07-22.
External links
![]()
- Fannin County government's website
- Fannin County from the Handbook of Texas Online
Places adjacent to Fannin County, Texas | ||||||||||
|---|---|---|---|---|---|---|---|---|---|---|
| ||||||||||
Municipalities and communities of Fannin County, Texas, United States | ||
|---|---|---|
| Cities | Fannin County map | |
| Towns | ||
| Unincorporated communities | ||
| Footnotes | ‡This populated place also has portions in an adjacent county or counties | |

| Authority control |
|
|---|