Lamb County, Texas
Lamb County is a county located in the U.S. state of Texas. As of the 2010 census, its population was 13,977.[1] Its county seat is Littlefield.[2] The county was created in 1876, but not organized until 1908.[3] It is named for George A. Lamb, who died in the Battle of San Jacinto.
Lamb County | |
|---|---|
 Lamb County Courthouse in Littlefield | |
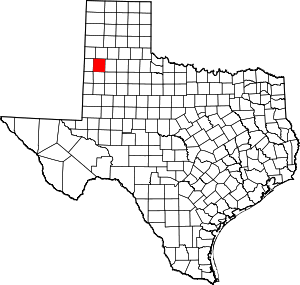 Location within the U.S. state of Texas | |
 Texas's location within the U.S. | |
| Coordinates: 34°04′N 102°21′W | |
| Country | |
| State | |
| Founded | 1908 |
| Named for | George A. Lamb |
| Seat | Littlefield |
| Largest city | Littlefield |
| Area | |
| • Total | 1,018 sq mi (2,640 km2) |
| • Land | 1,016 sq mi (2,630 km2) |
| • Water | 1.5 sq mi (4 km2) 0.2%% |
| Population (2010) | |
| • Total | 13,977 |
| • Density | 14/sq mi (5/km2) |
| Time zone | UTC−6 (Central) |
| • Summer (DST) | UTC−5 (CDT) |
| Congressional district | 19th |
| Website | co |
Lamb County was the home of the Texas House Speaker Bill W. Clayton, who served from 1975 until 1983. It is also the birthplace of country music singer Waylon Jennings.
History
Lamb County was formed in 1876 from portions of Bexar County. It was named after George A. Lamb, a soldier in the Battle of San Jacinto.
Geography
According to the U.S. Census Bureau, the county has a total area of 1,018 square miles (2,640 km2), of which 1,016 square miles (2,630 km2) are land and 1.5 square miles (3.9 km2) (0.2%) are water.[4]
Adjacent counties
- Castro County (north)
- Hale County (east)
- Hockley County (south)
- Bailey County (west)
- Parmer County (northwest)
- Lubbock County (southeast)
- Cochran County (southwest)
Demographics
| Historical population | |||
|---|---|---|---|
| Census | Pop. | %± | |
| 1890 | 4 | — | |
| 1900 | 31 | 675.0% | |
| 1910 | 540 | 1,641.9% | |
| 1920 | 1,175 | 117.6% | |
| 1930 | 17,452 | 1,385.3% | |
| 1940 | 17,606 | 0.9% | |
| 1950 | 20,015 | 13.7% | |
| 1960 | 21,896 | 9.4% | |
| 1970 | 17,770 | −18.8% | |
| 1980 | 18,669 | 5.1% | |
| 1990 | 15,072 | −19.3% | |
| 2000 | 14,709 | −2.4% | |
| 2010 | 13,977 | −5.0% | |
| Est. 2019 | 12,893 | [5] | −7.8% |
| U.S. Decennial Census[6] 1850–2010[7] 2010–2014[1] | |||
As of the census[8] of 2000, 14,709 people, 5,360 households, and 3,991 families resided in the county. The population density was 14 people per square mile (6/km²). The 6,294 housing units averaged 6 per square mile (2/km²). The racial makeup of the county was 76.1% White, 4.3% Black or African American, 0.7% Native American, 0.1% Asian, less than 0.05% Pacific Islander, 16.9% from other races, and 1.9% from two or more races. About 43.5% of the population was Hispanic or Latino of any race.
Of the 5,360 households, 35.4% had children under the age of 18 living with them, 59.5% were married couples living together, 10.2% had a female householder with no husband present, and 25.5% were not families. About 23.7% of all households were made up of individuals, and 12.8% had someone living alone who was 65 years of age or older. The average household size was 2.69 and the average family size was 3.19.
In the county, the population was distributed as 29.6% under the age of 18, 8.1% from 18 to 24, 24.2% from 25 to 44, 20.8% from 45 to 64, and 17.3% who were 65 years of age or older. The median age was 36 years. For every 100 females, there were 94.2 males. For every 100 females age 18 and over, there were 89.9 males.
The median income for a household in the county was $36,898, and for a family was $31,833. Males had a median income of $36,434 versus $30,342 for females. The per capita income for the county was $30,169. About 18.0% of families and 10.9% of the population were below the poverty line, including 27.3% of those under age 18 and 15.3% of those age 65 or over.
Transportation
Major highways


Airports
Littlefield Municipal Airport is located in Lamb County, 3 nautical miles (6 km) west of the central business district of Littlefield, Texas.
Communities
Cities
- Amherst
- Earth
- Littlefield (county seat)
- Olton
- Sudan
Town
Census-designated place
Unincorporated community
Gallery
 Littlefield claims the world's tallest windmill.
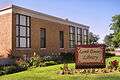 Lamb County Library in downtown Littlefield across from the First Baptist Church
 Lamb County Leader-News in Littlefield
 Lamb County Veterans Memorial
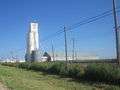 Littlefield Farmers Co-op grain elevator
Politics
| Year | Republican | Democratic | Third parties |
|---|---|---|---|
| 2016 | 77.9% 3,111 | 19.3% 771 | 2.8% 113 |
| 2012 | 74.8% 3,058 | 24.4% 998 | 0.9% 35 |
| 2008 | 73.9% 3,344 | 25.6% 1,156 | 0.6% 25 |
| 2004 | 79.8% 3,410 | 20.1% 857 | 0.1% 4 |
| 2000 | 75.1% 3,451 | 24.2% 1,114 | 0.7% 33 |
| 1996 | 56.7% 2,593 | 36.8% 1,683 | 6.5% 298 |
| 1992 | 55.0% 2,998 | 31.9% 1,737 | 13.1% 715 |
| 1988 | 57.6% 3,064 | 42.0% 2,230 | 0.4% 22 |
| 1984 | 66.8% 3,892 | 32.9% 1,919 | 0.3% 17 |
| 1980 | 62.8% 3,723 | 35.9% 2,132 | 1.3% 78 |
| 1976 | 41.5% 2,413 | 58.0% 3,374 | 0.5% 28 |
| 1972 | 74.2% 3,981 | 25.2% 1,350 | 0.7% 35 |
| 1968 | 41.1% 2,595 | 35.9% 2,267 | 23.1% 1,460 |
| 1964 | 31.9% 2,022 | 68.0% 4,318 | 0.1% 9 |
| 1960 | 46.0% 2,764 | 51.4% 3,089 | 2.6% 154 |
| 1956 | 35.5% 1,840 | 64.2% 3,325 | 0.2% 12 |
| 1952 | 51.4% 2,913 | 48.5% 2,748 | 0.2% 11 |
| 1948 | 12.0% 475 | 83.3% 3,286 | 4.7% 186 |
| 1944 | 17.9% 616 | 69.9% 2,407 | 12.2% 421 |
| 1940 | 13.6% 513 | 86.2% 3,259 | 0.3% 11 |
| 1936 | 11.4% 300 | 88.2% 2,320 | 0.4% 10 |
| 1932 | 8.2% 271 | 90.6% 2,978 | 1.2% 39 |
| 1928 | 74.2% 1,266 | 25.8% 440 | |
| 1924 | 23.9% 121 | 70.2% 356 | 5.9% 30 |
| 1920 | 32.5% 136 | 63.0% 264 | 4.5% 19 |
| 1916 | 8.1% 14 | 87.2% 150 | 4.7% 8 |
| 1912 | 7.1% 6 | 63.1% 53 | 29.8% 25 |
See also
References
- "State & County QuickFacts". United States Census Bureau. Archived from the original on October 18, 2011. Retrieved December 19, 2013.
- "Find a County". National Association of Counties. Retrieved 2011-06-07.
- "Texas: Individual County Chronologies". Texas Atlas of Historical County Boundaries. The Newberry Library. 2008. Retrieved May 25, 2015.
- "2010 Census Gazetteer Files". United States Census Bureau. August 22, 2012. Retrieved May 3, 2015.
- "Population and Housing Unit Estimates". United States Census Bureau. May 24, 2020. Retrieved May 27, 2020.
- "U.S. Decennial Census". United States Census Bureau. Retrieved May 3, 2015.
- "Texas Almanac: Population History of Counties from 1850–2010" (PDF). Texas Almanac. Retrieved May 3, 2015.
- "U.S. Census website". United States Census Bureau. Retrieved 2011-05-14.
- Leip, David. "Dave Leip's Atlas of U.S. Presidential Elections". uselectionatlas.org. Retrieved 2018-07-26.
External links
- Lamb County from the Handbook of Texas Online
- Lamb County at Curlie
- Lamb County Profile from the Texas Association of Counties
Places adjacent to Lamb County, Texas | ||||||||||
|---|---|---|---|---|---|---|---|---|---|---|
| ||||||||||
Municipalities and communities of Lamb County, Texas, United States | ||
|---|---|---|
| Cities | Lamb County map | |
| Town | ||
| CDP | ||
| Other unincorporated community | ||
| Authority control |
|
|---|