Delta County, Texas
Delta County is a county located in the U.S. state of Texas. As of the 2010 census, its population was 5,231. Going by a 2018 estimate, the population is 5,349.[1] Its county seat and largest city is Cooper.[2] The county was founded in 1870 and is named for its triangular shape,[3] much like the Greek letter delta.
Delta County | |
|---|---|
.jpg) Delta County Courthouse in Cooper | |
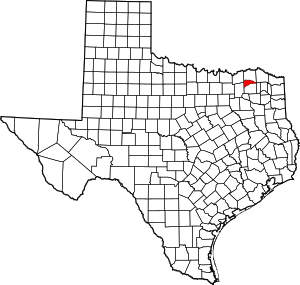 Location within the U.S. state of Texas | |
 Texas's location within the U.S. | |
| Coordinates: 33°23′N 95°40′W | |
| Country | |
| State | |
| Founded | 1870 |
| Seat | Cooper |
| Largest city | Cooper |
| Area | |
| • Total | 278 sq mi (720 km2) |
| • Land | 257 sq mi (670 km2) |
| • Water | 21 sq mi (50 km2) 7.6%% |
| Population (2010) | |
| • Total | 5,231 |
| • Estimate (2019) | 5,331 |
| • Density | 20/sq mi (8/km2) |
| Time zone | UTC−6 (Central) |
| • Summer (DST) | UTC−5 (CDT) |
| Congressional district | 4th |
| Website | www |
Two forks of the Sulphur River form its northern and southern boundaries and meet at its easternmost point. Delta County was one of 19[4] prohibition, or entirely dry, counties in the state of Texas. As of 2015, Delta county is no longer a dry county.
Delta County is represented in the Texas House of Representatives by Republican Larry Phillips of Sherman, Texas.
Geography
According to the U.S. Census Bureau, the county has a total area of 278 square miles (720 km2), of which 257 square miles (670 km2) is land and 21 square miles (54 km2) (7.6%) is water.[5]
Major highways


Adjacent counties
- Lamar County (north)
- Red River County (east)
- Franklin County (east)
- Hopkins County (south)
- Hunt County (southwest)
- Fannin County (northwest)
Demographics
| Historical population | |||
|---|---|---|---|
| Census | Pop. | %± | |
| 1880 | 5,597 | — | |
| 1890 | 9,117 | 62.9% | |
| 1900 | 15,249 | 67.3% | |
| 1910 | 14,566 | −4.5% | |
| 1920 | 15,887 | 9.1% | |
| 1930 | 13,138 | −17.3% | |
| 1940 | 12,858 | −2.1% | |
| 1950 | 8,964 | −30.3% | |
| 1960 | 5,860 | −34.6% | |
| 1970 | 4,927 | −15.9% | |
| 1980 | 4,839 | −1.8% | |
| 1990 | 4,857 | 0.4% | |
| 2000 | 5,327 | 9.7% | |
| 2010 | 5,231 | −1.8% | |
| Est. 2019 | 5,331 | [6] | 1.9% |
| U.S. Decennial Census[7] 1850–2010[8] 2010–2014[1] | |||
As of the census[9] of 2000, there were 5,506 people, 2,094 households, and 1,461 families residing in the county. The population density was 19 people per square mile (7/km²). There were 2,410 housing units at an average density of 9 per square mile (3/km²). The racial makeup of the county was 87.93% White, 8.28% Black or African American, 0.77% Native American, 0.11% Asian, 0.04% Pacific Islander, 1.18% from other races, and 1.69% from two or more races. About 3.10% of the population were Hispanic or Latino of any race.
There were 2,094 households, of which 30.20% had children under the age of 18 living with them, 56.40% were married couples living together, 10.00% had a female householder with no husband present, and 30.20% were nonfamilies. About 27.50% of all households were made up of individuals and 14.70% had someone living alone who was 65 years of age or older. The average household size was 2.49 and the average family size was 3.02.
In the county, the population was spread out with 25.60% under the age of 18, 7.50% from 18 to 24, 25.50% from 25 to 44, 23.80% from 45 to 64, and 17.70% who were 65 years of age or older. The median age was 39 years. For every 100 females, there were 94.50 males. For every 100 females age 18 and over, there were 88.90 males.
The median income for a household in the county was $29,094, and the median income for a family was $37,925. Males had a median income of $31,597 versus $20,296 for females. The per capita income for the county was $15,080. About 14.60% of families and 17.60% of the population were below the poverty line, including 20.50% of those under age 18 and 20.60% of those age 65 or over.
Communities
Cities
- Cooper
- Pecan Gap (small part in Fannin County)
- Commerce (majority in Hunt County)
Unincorporated communities
- Antioch
- Ben Franklin
- Charleston
- Oliverville
- East Delta
- Vasco
- Cleveland
- Enloe
- Jot 'Em Down
- Kensing
- Klondike
- Westowne
- Lake Creek
- Pacio
- Prattville
- Rattan
- Yowell
- Post Oak
- The Old Broken J
- Natanland
- St. Joseph
Ghost Town
- Liberty Grove
- Quick Cove
Politics
| Year | Republican | Democratic | Third parties |
|---|---|---|---|
| 2016 | 80.5% 1,836 | 17.5% 400 | 2.0% 45 |
| 2012 | 75.5% 1,524 | 22.5% 454 | 2.0% 40 |
| 2008 | 72.3% 1,580 | 26.9% 589 | 0.8% 18 |
| 2004 | 69.5% 1,447 | 30.1% 627 | 0.4% 8 |
| 2000 | 60.2% 1,143 | 38.2% 726 | 1.6% 31 |
| 1996 | 42.7% 744 | 48.7% 849 | 8.6% 150 |
| 1992 | 29.7% 599 | 42.9% 864 | 27.4% 552 |
| 1988 | 40.4% 849 | 59.2% 1,244 | 0.4% 8 |
| 1984 | 51.2% 1,024 | 48.6% 973 | 0.2% 4 |
| 1980 | 35.8% 767 | 62.9% 1,347 | 1.3% 28 |
| 1976 | 21.2% 421 | 78.5% 1,563 | 0.4% 7 |
| 1972 | 61.9% 957 | 37.6% 581 | 0.5% 8 |
| 1968 | 19.7% 370 | 55.1% 1,037 | 25.2% 475 |
| 1964 | 17.3% 339 | 82.6% 1,619 | 0.1% 2 |
| 1960 | 25.1% 460 | 74.2% 1,360 | 0.7% 12 |
| 1956 | 32.2% 605 | 67.2% 1,262 | 0.5% 10 |
| 1952 | 30.8% 707 | 69.1% 1,585 | 0.1% 3 |
| 1948 | 7.7% 146 | 83.9% 1,594 | 8.4% 160 |
| 1944 | 6.7% 133 | 85.9% 1,706 | 7.5% 148 |
| 1940 | 7.9% 190 | 92.1% 2,214 | |
| 1936 | 5.3% 82 | 94.6% 1,466 | 0.1% 1 |
| 1932 | 4.1% 87 | 95.8% 2,013 | 0.1% 1 |
| 1928 | 44.0% 753 | 55.9% 958 | 0.1% 2 |
| 1924 | 17.6% 479 | 80.5% 2,186 | 1.9% 51 |
| 1920 | 21.0% 315 | 72.2% 1,081 | 6.8% 102 |
| 1916 | 5.0% 72 | 86.5% 1,254 | 8.6% 124 |
| 1912 | 7.1% 57 | 87.3% 705 | 5.7% 46 |
See also
References
- "State & County QuickFacts". United States Census Bureau. Archived from the original on October 18, 2011. Retrieved December 10, 2013.
- "Find a County". National Association of Counties. Archived from the original on 2011-05-31. Retrieved 2011-06-07.
- Gannett, Henry (1905). The Origin of Certain Place Names in the United States. Govt. Print. Off. pp. 103.
- "TABC Local Option Elections". Retrieved 2018-07-29.
- "2010 Census Gazetteer Files". United States Census Bureau. August 22, 2012. Retrieved April 22, 2015.
- "Population and Housing Unit Estimates". United States Census Bureau. May 24, 2020. Retrieved May 27, 2020.
- "U.S. Decennial Census". United States Census Bureau. Retrieved April 22, 2015.
- "Texas Almanac: Population History of Counties from 1850–2010" (PDF). Texas Almanac. Retrieved April 22, 2015.
- "U.S. Census website". United States Census Bureau. Retrieved 2011-05-14.
- Leip, David. "Dave Leip's Atlas of U.S. Presidential Elections". uselectionatlas.org. Retrieved 2018-07-21.
External links
- Delta County website
- Delta County Chamber of Commerce website
- Delta County in Handbook of Texas Online
- Delta County History at HistoricTexas.net
- Jot 'Em Down, Delta County, Texas data at Internet Accuracy Project
Places adjacent to Delta County, Texas | ||||||||||
|---|---|---|---|---|---|---|---|---|---|---|
| ||||||||||
Municipalities and communities of Delta County, Texas, United States | ||
|---|---|---|
| Cities | Delta County map | |
| Unincorporated communities | ||
| Ghost town | ||
| Footnotes | ‡This populated place also has portions in an adjacent county or counties | |