Camp County, Texas
Camp County is in Texas. As of the 2010 census, its population was 12,401.[1] Its seat is Pittsburg.[2] The county was founded in 1874 and is named for John Lafayette Camp, a Texas politician.
Camp County | |
|---|---|
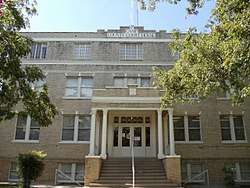 Camp County Courthouse in Pittsburg | |
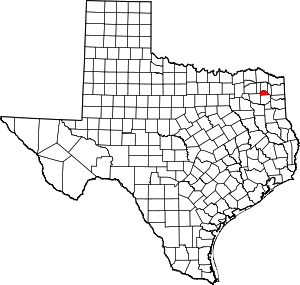 Location within the U.S. state of Texas | |
 Texas's location within the U.S. | |
| Coordinates: 32°58′N 94°59′W | |
| Country | |
| State | |
| Founded | 1874 |
| Named for | John Lafayette Camp |
| Seat | Pittsburg |
| Largest city | Pittsburg |
| Area | |
| • Total | 203 sq mi (530 km2) |
| • Land | 196 sq mi (510 km2) |
| • Water | 7.4 sq mi (19 km2) 3.6%% |
| Population (2010) | |
| • Total | 12,401 |
| • Density | 63/sq mi (24/km2) |
| Time zone | UTC−6 (Central) |
| • Summer (DST) | UTC−5 (CDT) |
| Congressional district | 4th |
| Website | www |
Camp County is represented in the Texas House of Representatives by the Republican Bryan Hughes, a lawyer in Mineola.
Geography
According to the U.S. Census Bureau, the county has a total area of 203 square miles (530 km2), of which 196 square miles (510 km2) is land and 7.4 square miles (19 km2) (3.6%) is water.[3] It is the third smallest county by area in Texas.
Major highways


Adjacent counties
- Titus County (north)
- Morris County (east)
- Upshur County (south)
- Wood County (southwest)
- Franklin County (west)
Demographics
| Historical population | |||
|---|---|---|---|
| Census | Pop. | %± | |
| 1880 | 5,951 | — | |
| 1890 | 6,624 | 11.3% | |
| 1900 | 9,146 | 38.1% | |
| 1910 | 9,551 | 4.4% | |
| 1920 | 11,103 | 16.2% | |
| 1930 | 10,063 | −9.4% | |
| 1940 | 10,285 | 2.2% | |
| 1950 | 8,740 | −15.0% | |
| 1960 | 7,849 | −10.2% | |
| 1970 | 8,005 | 2.0% | |
| 1980 | 9,275 | 15.9% | |
| 1990 | 9,904 | 6.8% | |
| 2000 | 11,549 | 16.6% | |
| 2010 | 12,401 | 7.4% | |
| Est. 2019 | 13,094 | [4] | 5.6% |
| U.S. Decennial Census[5] 1850–2010[6] 2010–2014[1] | |||
As of the census[7] of 2000, there were 11,549 people, 4,336 households, and 3,156 families living in the county. The population density was 58 people per square mile (23/km²). There were 5,228 housing units at an average density of 26 per square mile (10/km²). The racial makeup of the county was 69.53% White, 19.20% Black or African American, 0.35% Native American, 0.17% Asian, 0.05% Pacific Islander, 9.63% from other races, and 1.07% from two or more races. 14.78% of the population were Hispanic or Latino of any race.
There were 4,336 households out of which 31.50% had children under the age of 18 living with them, 56.20% were married couples living together, 12.50% had a female householder with no husband present, and 27.20% were non-families. 24.20% of all households were made up of individuals and 11.80% had someone living alone who was 65 years of age or older. The average household size was 2.62 and the average family size was 3.09.
In the county, the population was spread out with 26.90% under the age of 18, 8.50% from 18 to 24, 25.50% from 25 to 44, 22.80% from 45 to 64, and 16.30% who were 65 years of age or older. The median age was 37 years. For every 100 females there were 96.20 males. For every 100 females age 18 and over, there were 91.90 males.
The median income for a household in the county was $31,164, and the median income for a family was $36,142. Males had a median income of $31,870 versus $18,797 for females. The per capita income for the county was $16,500. About 15.90% of families and 20.90% of the population were below the poverty line, including 30.00% of those under age 18 and 16.00% of those age 65 or over.
Politics
| Year | Republican | Democratic | Third parties |
|---|---|---|---|
| 2016 | 70.5% 3,201 | 27.7% 1,260 | 1.8% 81 |
| 2012 | 66.5% 2,881 | 32.9% 1,428 | 0.6% 26 |
| 2008 | 61.3% 2,798 | 38.0% 1,734 | 0.8% 35 |
| 2004 | 59.4% 2,638 | 40.1% 1,778 | 0.5% 23 |
| 2000 | 56.1% 2,121 | 42.9% 1,625 | 1.0% 38 |
| 1996 | 40.6% 1,488 | 52.2% 1,912 | 7.2% 262 |
| 1992 | 30.6% 1,219 | 48.7% 1,938 | 20.7% 823 |
| 1988 | 47.2% 1,908 | 52.5% 2,121 | 0.3% 13 |
| 1984 | 53.7% 2,238 | 46.0% 1,917 | 0.3% 13 |
| 1980 | 42.3% 1,531 | 56.7% 2,052 | 1.0% 35 |
| 1976 | 34.5% 1,133 | 65.3% 2,146 | 0.2% 6 |
| 1972 | 60.6% 1,599 | 39.4% 1,041 | 0.0% 1 |
| 1968 | 19.1% 555 | 43.9% 1,272 | 37.0% 1,074 |
| 1964 | 28.3% 729 | 71.4% 1,841 | 0.3% 7 |
| 1960 | 39.7% 873 | 59.4% 1,307 | 0.9% 20 |
| 1956 | 47.2% 958 | 51.9% 1,053 | 0.9% 18 |
| 1952 | 38.2% 951 | 61.7% 1,535 | 0.0% 1 |
| 1948 | 12.1% 180 | 62.0% 923 | 25.9% 385 |
| 1944 | 13.2% 180 | 71.4% 977 | 15.4% 211 |
| 1940 | 12.9% 200 | 86.9% 1,343 | 0.1% 2 |
| 1936 | 7.7% 78 | 92.3% 939 | |
| 1932 | 4.9% 73 | 95.0% 1,416 | 0.1% 2 |
| 1928 | 43.6% 494 | 56.4% 640 | |
| 1924 | 13.2% 187 | 83.8% 1,186 | 3.0% 43 |
| 1920 | 11.8% 156 | 50.0% 661 | 38.2% 504 |
| 1916 | 21.4% 206 | 74.8% 721 | 3.8% 37 |
| 1912 | 22.5% 155 | 68.4% 472 | 9.1% 63 |
See also
References
- "State & County QuickFacts". United States Census Bureau. Retrieved December 9, 2013.
- "Find a County". National Association of Counties. Archived from the original on 2011-05-31. Retrieved 2011-06-07.
- "2010 Census Gazetteer Files". United States Census Bureau. August 22, 2012. Retrieved April 20, 2015.
- "Population and Housing Unit Estimates". United States Census Bureau. May 24, 2020. Retrieved May 27, 2020.
- "U.S. Decennial Census". United States Census Bureau. Retrieved April 20, 2015.
- "Texas Almanac: Population History of Counties from 1850–2010" (PDF). Texas Almanac. Retrieved April 20, 2015.
- "U.S. Census website". United States Census Bureau. Retrieved 2011-05-14.
- Leip, David. "Dave Leip's Atlas of U.S. Presidential Elections". uselectionatlas.org. Retrieved 2018-07-20.
External links
![]()
- Camp County government's website
- Camp County in Handbook of Texas Online at the University of Texas
- Historic Camp County materials, hosted by the Portal to Texas History.
Places adjacent to Camp County, Texas | ||||||||||
|---|---|---|---|---|---|---|---|---|---|---|
| ||||||||||
Municipalities and communities of Camp County, Texas, United States | ||
|---|---|---|
| City | Camp County map | |
| Town | ||
| Unincorporated communities | ||
| Ghost town | ||