Briscoe County, Texas
Briscoe County is a county located in the U.S. state of Texas. As of 2010 census, the population was 1,637.[1] Its county seat is Silverton.[2] The county was created in 1876 and later organized in 1892.[3] It is named for Andrew Briscoe, a soldier during the Texas Revolution.
Briscoe County | |
|---|---|
.jpg) The Briscoe County Courthouse in Silverton | |
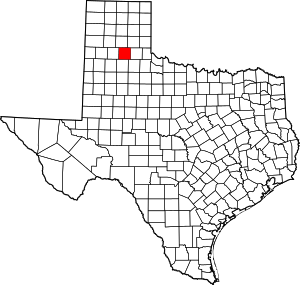 Location within the U.S. state of Texas | |
 Texas's location within the U.S. | |
| Coordinates: 34°32′N 101°13′W | |
| Country | |
| State | |
| Founded | 1892 |
| Named for | Andrew Briscoe |
| Seat | Silverton |
| Largest city | Silverton |
| Area | |
| • Total | 902 sq mi (2,340 km2) |
| • Land | 900 sq mi (2,000 km2) |
| • Water | 1.6 sq mi (4 km2) 0.2%% |
| Population (2010) | |
| • Total | 1,637 |
| • Density | 1.8/sq mi (0.7/km2) |
| Time zone | UTC−6 (Central) |
| • Summer (DST) | UTC−5 (CDT) |
| Congressional district | 13th |
| Website | www |
At one time, the large JA Ranch, founded by Charles Goodnight and John George Adair, reached into Briscoe County. After he left the JA, Goodnight owned the Quitaque Ranch. The prominent high school football and college coach Gene Mayfield was born in Briscoe County in 1928.
Caprock Canyons State Park and Trailway is located in Briscoe County.
Geography
According to the U.S. Census Bureau, the county has a total area of 902 square miles (2,340 km2), of which 900 square miles (2,300 km2) is land and 1.6 square miles (4.1 km2) (0.2%) is water.[4]
Tule Canyon
Mackenzie Reservoir formed after water on Tule Creek was impounded. In 1972 the project was begun, just east of the site of the slaughter of the Indian ponies by Col. Ranald S. Mackenzie's Fourth Cavalry in 1874.[5]
Major highways
Adjacent counties
- Armstrong County (north)
- Donley County (northeast)
- Hall County (east)
- Motley County (southeast)
- Floyd County (south)
- Swisher County (west)
Demographics
| Historical population | |||
|---|---|---|---|
| Census | Pop. | %± | |
| 1880 | 12 | — | |
| 1900 | 1,253 | — | |
| 1910 | 2,162 | 72.5% | |
| 1920 | 2,948 | 36.4% | |
| 1930 | 5,590 | 89.6% | |
| 1940 | 4,056 | −27.4% | |
| 1950 | 3,528 | −13.0% | |
| 1960 | 3,577 | 1.4% | |
| 1970 | 2,794 | −21.9% | |
| 1980 | 2,579 | −7.7% | |
| 1990 | 1,971 | −23.6% | |
| 2000 | 1,790 | −9.2% | |
| 2010 | 1,637 | −8.5% | |
| Est. 2019 | 1,546 | [6] | −5.6% |
| U.S. Decennial Census[7] 1850–2010[8] 2010–2014[1] | |||
As of the census[9] of 2000, there were 1,790 people, 724 households, and 511 families residing in the county. The population density was 2 people per square mile (1/km²). There were 1,006 housing units at an average density of 1 per square mile (0/km²). The racial makeup of the county was 83.35% White, 2.29% Black or African American, 0.39% Native American, 0.06% Asian, 11.45% from other races, and 2.46% from two or more races. 22.74% of the population were Hispanic or Latino of any race.
There were 724 households out of which 29.30% had children under the age of 18 living with them, 59.30% were married couples living together, 7.60% had a female householder with no husband present, and 29.40% were non-families. 27.90% of all households were made up of individuals and 16.00% had someone living alone who was 65 years of age or older. The average household size was 2.47 and the average family size was 3.03.
In the county, the population was spread out with 27.10% under the age of 18, 6.80% from 18 to 24, 22.00% from 25 to 44, 24.80% from 45 to 64, and 19.30% who were 65 years of age or older. The median age was 40 years. For every 100 females there were 95.00 males. For every 100 females age 18 and over, there were 92.80 males.
The median income for a household in the county was $29,917, and the median income for a family was $35,326. Males had a median income of $25,854 versus $17,500 for females. The per capita income for the county was $14,218. About 11.50% of families and 16.00% of the population were below the poverty line, including 23.00% of those under age 18 and 12.50% of those age 65 or over.
Education
- Silverton Independent School District
- Clarendon Independent School District partial
- Turkey-Quitaque Independent School District partial
Politics
| Year | Republican | Democratic | Third parties |
|---|---|---|---|
| 2016 | 84.9% 625 | 12.4% 91 | 2.7% 20 |
| 2012 | 82.3% 578 | 16.7% 117 | 1.0% 7 |
| 2008 | 74.3% 617 | 24.7% 205 | 1.0% 8 |
| 2004 | 76.5% 620 | 23.6% 191 | |
| 2000 | 70.5% 544 | 29.0% 224 | 0.5% 4 |
| 1996 | 46.6% 416 | 45.7% 408 | 7.6% 68 |
| 1992 | 37.6% 360 | 44.9% 430 | 17.5% 167 |
| 1988 | 44.3% 464 | 54.8% 574 | 1.0% 10 |
| 1984 | 52.9% 538 | 46.3% 471 | 0.8% 8 |
| 1980 | 48.9% 562 | 48.8% 561 | 2.4% 27 |
| 1976 | 25.5% 285 | 73.6% 823 | 1.0% 11 |
| 1972 | 64.2% 642 | 34.9% 349 | 0.9% 9 |
| 1968 | 35.5% 411 | 45.6% 528 | 18.9% 219 |
| 1964 | 26.4% 348 | 73.4% 966 | 0.2% 3 |
| 1960 | 47.9% 533 | 51.3% 570 | 0.8% 9 |
| 1956 | 35.4% 357 | 64.3% 648 | 0.3% 3 |
| 1952 | 57.5% 692 | 42.2% 508 | 0.3% 3 |
| 1948 | 10.3% 83 | 85.8% 692 | 4.0% 32 |
| 1944 | 9.7% 80 | 74.3% 615 | 16.1% 133 |
| 1940 | 14.5% 154 | 85.4% 910 | 0.2% 2 |
| 1936 | 7.0% 64 | 93.0% 849 | |
| 1932 | 4.1% 42 | 95.5% 977 | 0.4% 4 |
| 1928 | 47.0% 301 | 52.4% 336 | 0.6% 4 |
| 1924 | 11.1% 53 | 83.4% 397 | 5.5% 26 |
| 1920 | 11.8% 39 | 78.9% 262 | 9.3% 31 |
| 1916 | 1.4% 4 | 90.9% 260 | 7.7% 22 |
| 1912 | 1.3% 2 | 95.5% 148 | 3.2% 5 |
See also
- List of museums in the Texas Panhandle
- National Register of Historic Places listings in Briscoe County, Texas
- Recorded Texas Historic Landmarks in Briscoe County
- Llano Estacado
- Duffy's Peak
- Caprock Canyons State Park and Trailway
- Palo Duro Canyon
- Yellow House Canyon
References
- "State & County QuickFacts". United States Census Bureau. Retrieved December 8, 2013.
- "Find a County". National Association of Counties. Archived from the original on 2011-05-31. Retrieved 2011-06-07.
- "Texas: Individual County Chronologies". Texas Atlas of Historical County Boundaries. The Newberry Library. 2008. Retrieved May 20, 2015.
- "2010 Census Gazetteer Files". United States Census Bureau. August 22, 2012. Retrieved April 19, 2015.
- "MACKENZIE RESERVOIR". tshaonline.org. 2010-06-15. Retrieved 29 April 2015.
- "Population and Housing Unit Estimates". United States Census Bureau. May 24, 2020. Retrieved May 27, 2020.
- "U.S. Decennial Census". United States Census Bureau. Retrieved April 19, 2015.
- "Texas Almanac: Population History of Counties from 1850–2010" (PDF). Texas Almanac. Retrieved April 19, 2015.
- "U.S. Census website". United States Census Bureau. Retrieved 2011-05-14.
- Leip, David. "Dave Leip's Atlas of U.S. Presidential Elections". uselectionatlas.org. Retrieved 2018-07-19.
External links
- Briscoe County
- Briscoe County in Handbook of Texas Online at the University of Texas
- Briscoe County Profile from the Texas Association of Counties
- Interactive Texas Map
- Texas Map Collection
- Mackenzie Reservoir in Texas Parks & Wildlife
- Mackenzie Reservoir in Handbook of Texas Online
- Photos of West Texas and the Llano Estacado
Places adjacent to Briscoe County, Texas | ||||||||||
|---|---|---|---|---|---|---|---|---|---|---|
| ||||||||||
Municipalities and communities of Briscoe County, Texas, United States | ||
|---|---|---|
| Cities | Briscoe County map | |
| Ghost town | ||