Climate of Texas
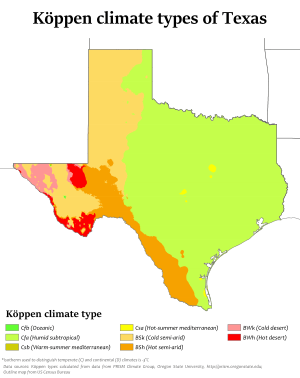
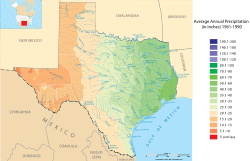
Texas' weather varies widely, from arid in the west to humid in the east. The huge expanse of Texas encompasses several regions with distinctly different climates: Northern Plains, Trans-Pecos Region, Texas Hill Country, Piney Woods, and South Texas. Generally speaking, the part of Texas that lies to the east of Interstate 35 is subtropical, while the portion that lies to the west of Interstate 35 is arid desert.
Texas ranks first in tornado occurrence with an average of 139 per year. Tropical cyclones can affect the state, either from the Gulf of Mexico or from an overland trajectory originating in the eastern Pacific Ocean. Those originating from the Gulf of Mexico are more likely to strike the upper Texas coast than elsewhere. Significant floods have occurred across the state throughout history, both from tropical cyclones and from stalled weather fronts.
Characteristics by region
Northern area
| City | Jan | Feb | Mar | Apr | May | Jun | Jul | Aug | Sep | Oct | Nov | Dec |
|---|---|---|---|---|---|---|---|---|---|---|---|---|
| Abilene | 55/32 | 61/37 | 69/44 | 77/52 | 85/61 | 91/69 | 95/72 | 94/71 | 87/64 | 78/54 | 65/42 | 57/34 |
| Amarillo | 49/23 | 54/27 | 62/34 | 71/42 | 79/52 | 87/61 | 91/65 | 89/64 | 82/56 | 72/45 | 58/32 | 50/24 |
| Lubbock | 52/24 | 58/29 | 66/36 | 75/45 | 83/56 | 90/64 | 92/68 | 90/66 | 83/58 | 74/47 | 62/35 | 53/26 |
| Midland | 60/29 | 66/34 | 74/41 | 82/48 | 89/58 | 94/65 | 96/68 | 94/67 | 88/61 | 80/51 | 68/39 | 61/31 |
| San Angelo | 58/29 | 63/34 | 71/42 | 79/50 | 86/59 | 91/66 | 95/70 | 94/68 | 88/63 | 79/51 | 67/39 | 59/31 |
| Wichita Falls | 52/29 | 58/34 | 67/41 | 76/49 | 84/59 | 92/68 | 97/72 | 96/71 | 88/64 | 77/52 | 64/40 | 54/31 |
The Northern Plains' climate is semi-arid and is prone to drought, annually receiving between 16 and 32 inches (810 mm) of precipitation, and average annual snowfall ranging between 15 and 30 inches, with the greatest snowfall amounts occurring in the Texas panhandle and areas near the border with New Mexico. During the summer, this area of state sees the most clear days.[2] Winter nights commonly see temperatures fall below the freezing mark, or 32 °F (0 °C). The wettest months of the year are April and May.[3] Tornadoes, caused by the convergence of westerly and southerly prevailing winds during the late spring, are common, making the region part of Tornado Alley.[4] Poor land management, drought, and high wind speeds can cause large dust storms, minimized in modern times by improved land-management practices, but most troublesome in the 1930s during the Dust Bowl period.[5] The panhandle region, farthest from the Gulf of Mexico, experiences colder winters than the other regions of Texas, where occasional wintertime Arctic blasts can cause temperatures to plunge to well below freezing and bring snowy conditions.[6]
International areas with comparable climate: Southern China; North Argentina; New South Wales, Australia.
Trans Pecos Region
The Trans-Pecos region, also known as Big Bend Country, is in the west-central and western parts of the state, consisting of the Chihuahuan Desert and isolated mountain ranges. During fall, winter, and spring, it experiences the most clear days statewide.[2] It is also the driest receiving an average annual rainfall of only 16 inches (410 mm) or less. Snowfall is rare at lower elevations, although the highest mountain peaks are prone to heavy snowfalls during winter. The arid climate is the main reason for desertification of the land, but overgrazing is slowly widening the land area of that desert. In the mountain areas one can see coniferous forests in a wetter and more temperate environment. The wettest months in this region occur during the summer.[3] Winds are strengthened as they are forced to push through canyons and valleys. In the flatter areas these winds are harvested into usable electricity.
| Climate data for El Paso Int'l, Texas (1981–2010 normals, extremes 1879–present)[lower-alpha 1] | |||||||||||||
|---|---|---|---|---|---|---|---|---|---|---|---|---|---|
| Month | Jan | Feb | Mar | Apr | May | Jun | Jul | Aug | Sep | Oct | Nov | Dec | Year |
| Record high °F (°C) | 80 (27) |
86 (30) |
93 (34) |
98 (37) |
105 (41) |
114 (46) |
112 (44) |
108 (42) |
104 (40) |
96 (36) |
87 (31) |
80 (27) |
114 (46) |
| Mean maximum °F (°C) | 70.2 (21.2) |
76.9 (24.9) |
83.9 (28.8) |
90.7 (32.6) |
98.7 (37.1) |
104.7 (40.4) |
103.6 (39.8) |
100.5 (38.1) |
96.8 (36.0) |
89.8 (32.1) |
79.5 (26.4) |
70.3 (21.3) |
105.7 (40.9) |
| Average high °F (°C) | 57.7 (14.3) |
63.1 (17.3) |
70.3 (21.3) |
78.6 (25.9) |
87.8 (31.0) |
95.5 (35.3) |
94.7 (34.8) |
92.4 (33.6) |
87.6 (30.9) |
78.2 (25.7) |
66.2 (19.0) |
57.1 (13.9) |
77.4 (25.2) |
| Daily mean °F (°C) | 45.1 (7.3) |
50.1 (10.1) |
56.6 (13.7) |
64.7 (18.2) |
73.9 (23.3) |
82.0 (27.8) |
82.8 (28.2) |
81.0 (27.2) |
75.5 (24.2) |
65.1 (18.4) |
53.2 (11.8) |
44.8 (7.1) |
64.5 (18.1) |
| Average low °F (°C) | 32.5 (0.3) |
37.1 (2.8) |
42.9 (6.1) |
50.7 (10.4) |
60.0 (15.6) |
68.0 (20.0) |
70.9 (21.6) |
69.7 (20.9) |
63.3 (17.4) |
52.0 (11.1) |
40.1 (4.5) |
32.5 (0.3) |
51.6 (10.9) |
| Mean minimum °F (°C) | 19.1 (−7.2) |
22.6 (−5.2) |
27.6 (−2.4) |
35.8 (2.1) |
46.7 (8.2) |
56.6 (13.7) |
63.9 (17.7) |
62.8 (17.1) |
52.6 (11.4) |
37.8 (3.2) |
25.1 (−3.8) |
17.9 (−7.8) |
15.6 (−9.1) |
| Record low °F (°C) | −8 (−22) |
1 (−17) |
14 (−10) |
23 (−5) |
31 (−1) |
46 (8) |
56 (13) |
52 (11) |
41 (5) |
25 (−4) |
1 (−17) |
−5 (−21) |
−8 (−22) |
| Average precipitation inches (mm) | 0.40 (10) |
0.46 (12) |
0.26 (6.6) |
0.23 (5.8) |
0.47 (12) |
0.94 (24) |
1.55 (39) |
2.01 (51) |
1.51 (38) |
0.61 (15) |
0.49 (12) |
0.78 (20) |
9.71 (247) |
| Average snowfall inches (cm) | 1.3 (3.3) |
0.6 (1.5) |
0.3 (0.76) |
0.8 (2.0) |
0 (0) |
0 (0) |
0 (0) |
0 (0) |
0 (0) |
trace | 0.8 (2.0) |
3.1 (7.9) |
6.9 (18) |
| Average precipitation days (≥ 0.01 in) | 3.8 | 3.4 | 2.4 | 1.9 | 2.7 | 3.9 | 8.3 | 8.7 | 6.3 | 4.7 | 3.1 | 3.9 | 53.1 |
| Average snowy days (≥ 0.1 in) | 1.0 | 0.4 | 0.1 | 0.2 | 0 | 0 | 0 | 0 | 0 | 0.1 | 0.3 | 1.1 | 3.2 |
| Average relative humidity (%) | 50.5 | 41.6 | 32.4 | 26.9 | 27.1 | 29.9 | 43.9 | 48.4 | 50.5 | 47.1 | 46.1 | 51.5 | 41.3 |
| Mean monthly sunshine hours | 254.5 | 263.0 | 326.0 | 348.0 | 384.7 | 384.1 | 360.2 | 335.4 | 304.1 | 298.6 | 257.6 | 246.3 | 3,762.5 |
| Percent possible sunshine | 80 | 85 | 88 | 89 | 90 | 90 | 83 | 81 | 82 | 85 | 82 | 79 | 85 |
| Source: NOAA (relative humidity 1962–1990, sun 1961–1990)[7][8][9] | |||||||||||||
International areas with comparable climate: Iraq; Iran; Sahel region in Africa
Hill Country
| City | Jan | Feb | Mar | Apr | May | Jun | Jul | Aug | Sep | Oct | Nov | Dec |
|---|---|---|---|---|---|---|---|---|---|---|---|---|
| Austin | 60/40 | 65/44 | 73/51 | 79/58 | 85/65 | 91/71 | 95/73 | 96/73 | 90/69 | 81/60 | 70/49 | 62/42 |
| San Antonio | 62/39 | 67/43 | 74/50 | 80/57 | 86/66 | 91/72 | 95/74 | 95/74 | 90/69 | 82/59 | 71/49 | 64/41 |
| Waco | 57/33 | 62/38 | 70/46 | 78/53 | 84/63 | 91/70 | 96/74 | 96/73 | 90/66 | 79/57 | 68/45 | 59/36 |
The Texas Hill Country, or central Texas is shaped by its many rivers and hills. The climate is semi-arid west of Brady through Junction to Rocksprings, but it is sub-humid east and south of that area; both areas have hot summers and mild winters with occasional cold spells. Humidity is high during the warm season, though afternoons especially further northwest can see a wind shift and drier air before Gulf air returns after sunset. The vegetation is both broadleaf evergreen and deciduous in the river valleys, and coniferous where there is greater elevation. Dry savannas, open woodlands, and shorter grasses dominate the northwest, while closed woodlands and moist savannas mix with taller grasses in the east and south. In a single year the region can receive up to 48 inches (1,200 mm) of precipitation, and flooding is common near rivers and in low-lying areas, while drier years might receive only 12 inches (300 mm) of precipitation; average annual precipitation ranges from 21 inches (530 mm) in western sections up to 35 inches (890 mm) in southeast. The wettest months of the year are April and May.[3]
Piney Woods
| City | Jan | Feb | Mar | Apr | May | Jun | Jul | Aug | Sep | Oct | Nov | Dec |
|---|---|---|---|---|---|---|---|---|---|---|---|---|
| Dallas | 55/36 | 61/41 | 69/49 | 77/56 | 84/65 | 92/73 | 96/77 | 96/76 | 89/69 | 79/58 | 66/47 | 57/39 |
| Fort Worth | 55/31 | 61/36 | 68/44 | 76/52 | 83/61 | 91/69 | 97/72 | 96/72 | 89/65 | 79/55 | 67/44 | 58/35 |
| Galveston | 62/50 | 64/52 | 70/58 | 75/65 | 81/72 | 87/78 | 89/80 | 89/79 | 87/76 | 80/68 | 71/59 | 64/52 |
| Houston | 63/45 | 67/48 | 74/55 | 79/61 | 86/68 | 91/74 | 94/75 | 93/75 | 89/72 | 82/62 | 73/53 | 65/47 |
| Port Arthur | 61/43 | 65/46 | 72/52 | 78/59 | 84/66 | 89/72 | 92/74 | 92/73 | 88/69 | 80/60 | 71/51 | 64/45 |
The Piney Woods is the eastern region of Texas and is within the humid subtropical climate zone. It receives the most rainfall; more than 60 inches (1,500 mm) annually in the far east. This is due to the gulf currents that carry humid air to the region, where it condenses and precipitates out in the vicinity of sea breeze fronts as well as when extratropical cyclones move by. While coastal sections see the most cloudy days statewide and year-round, northern sections see the most clear days during the summer.[2] The wettest months of the year are April and May.[3] The area is prone to severe thunderstorms and tornadoes when the proper conditions exist, generally in the springtime. Hurricanes also strike the region, the most disastrous of which was the Galveston Hurricane of 1900.[10] More recently Hurricane Rita pummeled the Golden Triangle of southeast Texas.[11] The higher humidity of the region amplifies the feeling of heat during the summer. During winter and spring along the immediate coast, temperatures are kept cool by relatively cool gulf waters. Dense advection fog can form when warm air moves over the cool shelf waters during February and March, stopping ship traffic for days.
International areas with comparable climate: Taiwan; Philippines; much of the Southern parts of Queensland, Australia
South
| City | Jan | Feb | Mar | Apr | May | Jun | Jul | Aug | Sep | Oct | Nov | Dec |
|---|---|---|---|---|---|---|---|---|---|---|---|---|
| Brownsville | 69/50 | 72/53 | 78/59 | 82/65 | 87/72 | 91/75 | 92/75 | 93/75 | 89/73 | 84/66 | 77/59 | 70/52 |
| Corpus Christi | 66/46 | 70/49 | 76/56 | 81/62 | 86/69 | 90/74 | 93/74 | 93/75 | 90/72 | 84/64 | 75/55 | 68/48 |
| Del Rio | 63/40 | 68/44 | 76/52 | 83/59 | 89/67 | 94/72 | 96/74 | 96/74 | 91/69 | 82/61 | 71/49 | 63/41 |
| Laredo | 68/44 | 73/48 | 82/56 | 89/63 | 95/70 | 100/74 | 102/75 | 99/75 | 93/71 | 86/63 | 76/53 | 68/45 |
| Victoria | 63/44 | 67/47 | 73/54 | 79/60 | 85/68 | 90/73 | 93/75 | 94/75 | 90/70 | 83/62 | 73/52 | 65/45 |
The region of South Texas includes the semiarid ranch country and the wetter Rio Grande Valley. Considered to be the southernmost tip of the American Great Plains region, the inland region has rainfall that is similar to that of the Northern Plains. The coastal areas are nearly warm most of the year due to currents of the Gulf of Mexico. Summers are hot and humid. Rain in the coastal region is more abundant than in the inland region, and subtropical forests line the Rio Grande. The wettest months of the year are April and May in western areas, but approaching the Gulf Coast, September becomes the year's wettest month on average. This owes to the threat from tropical weather systems, including hurricanes, which can bring torrential rains of 5-10+ inches in one or two days. The resulting September monthly rainfall maximum prevails, for example, at Corpus Christi, South Padre Island and Brownsville.[3] Inland, where it is drier, ranches dominate the landscape, characterized by thick spiny brush and grasslands. The winters in the inland region are variable, but usually mild. Snow is a rare occurrence due to the lack of humidity in winter, and the summers are for the most part hot and dry, but at times can be humid when winds come off the Gulf of Mexico. Tornadoes can occur in this region, but are less frequent than in other parts of the state.
The southernmost part of the state falls just within the tropical climate classification. Occasional years of above average temperatures result in an abundance of tropical flora in the lower Rio Grande Valley, typical of a Tropical savanna climate.
International areas with comparable climate: India; Vietnam; Thailand
Cold and snow
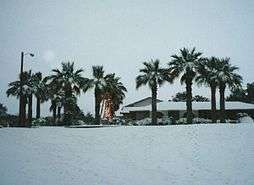
Northern and western sections of the state average snowfall annually due to their colder average readings each winter. For one week in February 1956, a snow storm of historic proportions struck northern Texas. The maximum amount measured was 61 inches (150 cm) at Vega with Plainview receiving 24 inches (61 cm) in one day.[12] El Paso, in Far West Texas, received 22.4 in (57 cm) of snow during a 24-hour period December 13–14, 1987.[13] For central and southern sections, snowfall is considerably more unusual. In February 1895, a large area of southeastern Texas received over 12 inches (30 cm) of snow, with peak amounts near 30 inches (76 cm) at Port Arthur.[14] More recently around Christmas of 2004, up to 13 inches (33 cm) of snow fell along the middle coast, with the maximum occurring at Victoria.[15]
The worst cold snap to occur statewide occurred during the last half of December in 1983. Four stations recorded their longest continuous readings at or below 32 °F (0 °C) on record. At Austin, the temperature remained at or below freezing for 139 hours. At Abilene, the period at or below freezing totaled 202 hours. Lubbock saw temperatures at or below freezing for 207 hours. The Dallas-Fort Worth airport measured temperatures at or below freezing for a total of 296 consecutive hours. Snow which fell on December 14 and 15 across northern Texas stayed on the ground until New Year's Day of 1984.[16]
Severe weather
Thunderstorms are very common in Texas, especially the eastern and northern portion. Texas is part of the Tornado Alley section of the country. The state experiences the most tornadoes in the Union, an average of 139 a year. These strike most frequently in North Texas and the Panhandle.[4] Tornadoes in Texas generally occur in April, May, and June.[17]
Hurricanes
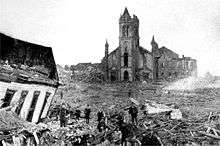
Texas's position at the northwestern end of the Gulf of Mexico makes it vulnerable to hurricanes. Some of the most destructive hurricanes in U.S. history have impacted Texas. A hurricane in 1875 killed approximately 400 people in Indianola, followed by another hurricane in 1886 that destroyed the town, which was at the time the most important port city in the state. This allowed Galveston to take over as the chief port city, but it was subsequently devastated by a hurricane in 1900 that killed approximately 8,000 people (possibly as many as 12,000), making it the deadliest natural disaster in U.S. history. Other devastating Texan hurricanes include the 1915 Galveston Hurricane, Hurricane Carla in 1961, Hurricane Beulah in 1967, Hurricane Alicia in 1983, Hurricane Rita in 2005, and Hurricane Ike in 2008.[18]
The climatology of where tropical cyclone strikes are most likely within the state appears to be changing. In the early 1980s, the most favored region during the previous century was the middle coast.[3] However, that region of the coastline has been rarely impacted since the 1960s, and a recent study indicates that the most vulnerable location to a tropical cyclone strike since 1851 is the upper coast, which has received 56 percent of all tropical cyclone landfalls, of which 66 percent originate from the Gulf of Mexico. This is in contrast with Louisiana and the lower Texan coast, where only 39 percent of the landfalls are from tropical cyclones of Gulf of Mexico origin.[19]
Flooding
The most serious threat from tropical cyclones for Texans is from flooding. The worst aspect about tropical cyclones is that the weaker they are, the more efficient they can be at producing heavy rains and catastrophic flooding. Systems with sprawling circulations, such as Hurricane Beulah, also tend to make good rainmakers.[20] Slow moving systems, such as Tropical Storm Amelia (1978) and Hurricane Harvey (2017) can produce significant rainfall.[21] Tropical cyclones from the eastern Pacific and Atlantic Basins can impact the Lone Star State.[22] In general, flooding across Texas is more common during the spring and early autumn months, and it can also be due to nearby stationary fronts interacting with strong upper level cyclones.[23] The most likely location for floods statewide is the Balcones Escarpment, an area of steep elevation gradient in central Texas at the boundary between the Edwards Plateau and the coastal plain.[24]
Extreme temperatures
The highest temperature ever measured in Texas was 120 °F (48.9 °C), recorded on August 12, 1936 in Seymour, during the 1936 North American Heatwave, and again on June 28, 1994 in Monahans. The lowest temperature ever measured in Texas was −23 °F (−30.6 °C), recorded on February 8, 1933 in Seminole.[25]
| Climate data for Texas | |||||||||||||
|---|---|---|---|---|---|---|---|---|---|---|---|---|---|
| Month | Jan | Feb | Mar | Apr | May | Jun | Jul | Aug | Sep | Oct | Nov | Dec | Year |
| Record high °F (°C) | 98 (37) |
104 (40) |
108 (42) |
113 (45) |
116 (47) |
120 (49) |
119 (48) |
120 (49) |
116 (47) |
110 (43) |
102 (39) |
98 (37) |
120 (49) |
| Record low °F (°C) | −22 (−30) |
−23 (−31) |
−12 (−24) |
5 (−15) |
15 (−9) |
32 (0) |
40 (4) |
39 (4) |
25 (−4) |
8 (−13) |
−10 (−23) |
−16 (−27) |
−23 (−31) |
| Source: [26][27] | |||||||||||||
El Niño–Southern Oscillation
The El Niño–Southern Oscillation (ENSO) cycle is a huge impact on the weather in Texas. During the El Niño phase, the jet stream is located west-to-east across the southern portion of the United States. Therefore, winters in Texas are colder and receive more snowfall than normal. Texas is also less likely to get impacted by hurricanes due to the increased wind shear across the Atlantic. Spring to early summer yields increased rainfall especially where a low pressure system is located over the Four Corners region or northern Mexico which yields monsoon-like climate (which was exacerbated during the 2015 and 2016 spring season where the City of Houston was the hardest hit as if the climate was similar to Mumbai or Kolkata, India with heavy rainfall usually from moisture from the Gulf of Mexico). During the opposite phase, La Niña, the jet stream is much further north, therefore winter is milder and drier than normal. Hurricanes are more likely to impact Texas during La Niña due to decreased wind shear in the Atlantic. Droughts in Texas are much more likely during La Niña. The 2010-11 La Niña is mostly to blame for one of the worst droughts in Texas history.
Climate change
According to the United States Environmental Protection Agency, the climate in Texas is already changing due to anthropogenic climate change.[28] As of 2016, most of the state had already warmed by 1.5 degrees since the previous century because of global warming.[28] Texas is expected to have a wide range of environmental impacts, including rising sea levels, increased extreme weather and wildfires, and pressure on water resources.[28]
The primary factors in Texas' greenhouse gas emissions are the state's large number of coal power plants and the state's refining and manufacturing industries which provides the bulk of the United States' petroleum products.[29] Texas accounts for 41% of crude oil production, 25% of natural gas, and 31% of refining capacity, and has some of the highest potential for sustainable power, producing 28% of wind for the United States.[30]Notes
- Official records for El Paso kept January 1879 to June 1947 at downtown and at El Paso Int'l since July 1947. For more information, see Threadex
References
- "Archived copy". Archived from the original on August 2, 2009. Retrieved March 7, 2009.CS1 maint: archived copy as title (link)
- Texas Renewable Energy Resource Assessment. "Chapter 2: Texas Climate". pp. 2–9.
- George W. Bomar (1983). Texas Weather. pp. 54–58. ISBN 0-292-78053-2.
- National Climatic Data Center (2005). "Average Number of Tornadoes, 1953-2004". National Oceanic and Atmospheric Administration. Retrieved October 24, 2006.
- "The American Experience: Surviving The Dust Bowl: People & Events: The Drought". PBS. Retrieved December 29, 2008.
- Texas Renewable Energy Resource Assessment. "Chapter 2: Texas Climate". pp. 2–6.
- "NowData – NOAA Online Weather Data". National Oceanic and Atmospheric Administration. Retrieved February 7, 2012.
- "Station Name: TX EL PASO INTL AP". National Oceanic and Atmospheric Administration. Retrieved March 21, 2014.
- "WMO Climate Normals for EL PASO/INT'L ARPT TX 1961–1990". National Oceanic and Atmospheric Administration. Retrieved March 10, 2014.
- Eric S. Blake; Edward N. Rappaport; Christopher W. Landsea (2007). "The Deadliest, Costliest, and Most Intense United States Tropical Cyclones From 1851 to 2006" (PDF). National Hurricane Center. Retrieved June 23, 2007.
- Richard D. Knabb; Daniel P. Brown; Jamie R. Rhome. "Hurricane Rita" (PDF). National Hurricane Center. Retrieved June 26, 2007.
- George W. Bomar (1983). Texas Weather. p. 164. ISBN 0-292-78053-2.
- National Weather Service Forecast Office, El Paso, Texas. "All time heavy snowfall events for El Paso". National Weather Service.CS1 maint: multiple names: authors list (link)
- National Weather Service Forecast Office, Lake Charles, Louisiana (2010). "Snow Climatology for Southeast Texas & Southwest Louisiana: All Measurable Snowfalls (1895-2010)". National Weather Service Southern Region Headquarters. Missing or empty
|url=(help)CS1 maint: multiple names: authors list (link) - National Weather Service Forecast Office, Houston/Galveston, Texas (December 25, 2004). "Public Information Statement". National Weather Service Southern Region Headquarters. Archived from the original on December 12, 2006. Retrieved December 1, 2006.CS1 maint: multiple names: authors list (link)
- George W. Bomar (1983). Texas Weather. p. 158. ISBN 0-292-78053-2.
- Weather from the Handbook of Texas Online Accessed July 22, 2008
- Eric S. Blake, Edward N. Rappaport, Christopher W. Landsea (April 15, 2007). "The Deadliest, Costliest, and Most Intense United States Tropical Cyclones From 1851 to 2006" (PDF). National Weather Service: National Hurricane Center. Retrieved October 2, 2008.CS1 maint: multiple names: authors list (link)
- Tanveerul Islam; William Merrell; William Seitz; Robert Harriss (November 2009). "Origin, Distribution, and Timing of Texas Hurricanes: 1851–2006". Natural Hazards Review. 10 (4): 137–138. doi:10.1061/(ASCE)1527-6988(2009)10:4(136).
- David M. Roth (January 17, 2010). "Texas Hurricane History" (PDF). Hydrometeorological Prediction Center. p. 5. Retrieved April 9, 2010.
- David M. Roth (June 20, 2007). "Tropical Storm Amelia (1978) Rainfall Page". Hydrometeorological Prediction Center. Retrieved March 5, 2008.
- David M. Roth (2010). "Tropical cyclones affecting the Gulf Coast". Hydrometeorological Prediction Center. Retrieved March 7, 2008.
- Earth Observatory (April 9, 2004). "Intense Rains Flood Mexico and Texas". National Aeronautics and Space Administration. Retrieved April 9, 2010.
- George W. Bomar (1983). Texas Weather. p. 63. ISBN 0-292-78053-2.
- "United States Extreme Record Temperatures & Differences". Retrieved November 22, 2008.
- "Texas: Temperature Extremes". Sandbox Networks, Inc. Retrieved August 4, 2016.
- "Heath Canyon, TX: Maximum of Maximum Temperature (Degrees Fahrenheit)". Western Regional Climate Center. Retrieved March 25, 2018.
- "What Climate Change Means for Texas" (PDF). EPA. August 2016. EPA 430-F-16-045.
- Associated Press (June 3, 2007). "Texas No. 1 producer of greenhouse gases". Dallas Morning News. Retrieved June 11, 2008.
- "Texas - State Energy Profile Overview - U.S. Energy Information Administration (EIA)". www.eia.gov. Retrieved May 29, 2020.
