Perquimans County, North Carolina
Perquimans County (/pɜːrˈkwɪmənz/)[1] is a county located in the U.S. state of North Carolina. As of the 2010 census, the population was 13,453.[2] Its county seat is Hertford.[3] The county was originally created as Berkeley Precinct. It was renamed Perquimans Precinct around 1684 and gained county status in 1739.[4]
Perquimans County | |
|---|---|
 | |
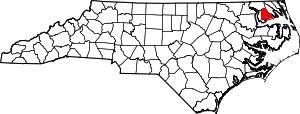 Location within the U.S. state of North Carolina | |
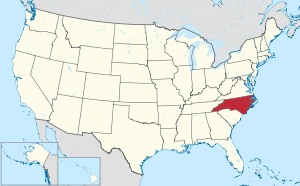 North Carolina's location within the U.S. | |
| Coordinates: 36°11′N 76°25′W | |
| Country | |
| State | |
| Founded | 1739 |
| Named for | The Perquimans Indians, an Algonquian people |
| Seat | Hertford |
| Largest town | Hertford |
| Area | |
| • Total | 329 sq mi (850 km2) |
| • Land | 247 sq mi (640 km2) |
| • Water | 82 sq mi (210 km2) 25%% |
| Population | |
| • Estimate (2018) | 13,422 |
| • Density | 54/sq mi (21/km2) |
| Time zone | UTC−5 (Eastern) |
| • Summer (DST) | UTC−4 (EDT) |
| Congressional district | 3rd |
| Website | www |
Perquimans County is part of the Elizabeth City, NC Micropolitan Statistical Area, which is also included in the Virginia Beach-Norfolk, VA-NC Combined Statistical Area.
The Harvey Point Defense Testing Activity facility is located in Perquimans County.
Geography
According to the U.S. Census Bureau, the county has a total area of 329 square miles (850 km2), of which 247 square miles (640 km2) is land and 82 square miles (210 km2) (25%) is water.[5]
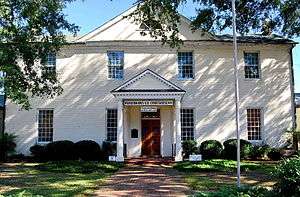
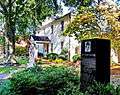 Courthouse and the Jim "Catfish" Hunter Memorial
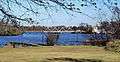 The Perquimans River and the "S" Bridge.
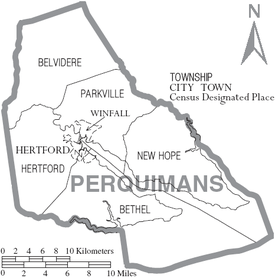
Adjacent counties
- Pasquotank County (east)
- Chowan County (southwest)
- Gates County (northwest)
Major highways
Demographics
| Historical population | |||
|---|---|---|---|
| Census | Pop. | %± | |
| 1790 | 5,439 | — | |
| 1800 | 5,708 | 4.9% | |
| 1810 | 6,052 | 6.0% | |
| 1820 | 6,857 | 13.3% | |
| 1830 | 7,419 | 8.2% | |
| 1840 | 7,346 | −1.0% | |
| 1850 | 7,332 | −0.2% | |
| 1860 | 7,238 | −1.3% | |
| 1870 | 7,945 | 9.8% | |
| 1880 | 9,466 | 19.1% | |
| 1890 | 9,293 | −1.8% | |
| 1900 | 10,091 | 8.6% | |
| 1910 | 11,054 | 9.5% | |
| 1920 | 11,137 | 0.8% | |
| 1930 | 10,668 | −4.2% | |
| 1940 | 9,773 | −8.4% | |
| 1950 | 9,602 | −1.7% | |
| 1960 | 9,178 | −4.4% | |
| 1970 | 8,351 | −9.0% | |
| 1980 | 9,486 | 13.6% | |
| 1990 | 10,447 | 10.1% | |
| 2000 | 11,368 | 8.8% | |
| 2010 | 13,453 | 18.3% | |
| Est. 2018 | 13,422 | [6] | −0.2% |
| U.S. Decennial Census[7] 1790-1960[8] 1900-1990[9] 1990-2000[10] 2010-2013[2] | |||
As of the census[11] of 2000, there were 11,368 people, 4,645 households, and 3,376 families residing in the county. The population density was 46 people per square mile (18/km²). There were 6,043 housing units at an average density of 24 per square mile (9/km²). The racial makeup of the county was 70.82% White, 27.99% Black or African American, 0.18% Native American, 0.21% Asian, 0.03% Pacific Islander, 0.13% from other races, and 0.64% from two or more races. 0.60% of the population were Hispanic or Latino of any race. There were 4,645 households of which 28.20% had children under the age of 18 living with them, 56.50% were married couples living together, 12.60% had a female householder with no husband present, and 27.30% were non-families. 24.10% of all households were made up of individuals and 11.90% had someone living alone who was 65 years of age or older. The average household size was 2.42 and the average family size was 2.86.
23.00% of the population were under the age of 18, 6.80% from 18 to 24, 24.40% from 25 to 44, 26.60% from 45 to 64, and 19.30% who were 65 years of age or older. The median age was 42 years. For every 100 females there were 91.30 males. For every 100 females age 18 and over, there were 87.50 males.
The median household income was $29,538 and the median family income was $35,212. Males had a median income of $27,251 compared with $18,728 for females. The per capita income for the county was $15,728. About 13.90% of families and 17.90% of the population were below the poverty line, including 27.20% of those under age 18 and 15.80% of those age 65 or over.
Education
Communities
Notable residents
- Janice Cole, U.S. Attorney
- Catfish Hunter, professional baseball player
- Wolfman Jack, radio personality
Politics
| Year | Republican | Democratic | Third parties |
|---|---|---|---|
| 2016 | 62.3% 4,177 | 34.6% 2,319 | 3.2% 212 |
| 2012 | 57.5% 3,822 | 41.5% 2,759 | 1.1% 71 |
| 2008 | 56.6% 3,678 | 42.6% 2,772 | 0.8% 51 |
| 2004 | 59.8% 2,965 | 39.8% 1,971 | 0.4% 22 |
| 2000 | 51.8% 2,230 | 47.2% 2,033 | 1.0% 43 |
| 1996 | 38.9% 1,561 | 51.5% 2,069 | 9.6% 385 |
| 1992 | 36.9% 1,429 | 46.9% 1,818 | 16.3% 631 |
| 1988 | 53.3% 1,781 | 46.2% 1,543 | 0.5% 16 |
| 1984 | 57.3% 1,939 | 42.6% 1,441 | 0.2% 5 |
| 1980 | 42.4% 1,210 | 54.7% 1,560 | 3.0% 84 |
| 1976 | 35.2% 909 | 64.6% 1,666 | 0.2% 5 |
| 1972 | 62.6% 1,299 | 34.8% 723 | 2.6% 54 |
| 1968 | 15.4% 468 | 33.6% 1,023 | 51.0% 1,554 |
| 1964 | 39.2% 941 | 60.8% 1,458 | |
| 1960 | 30.4% 637 | 69.6% 1,460 | |
| 1956 | 41.0% 709 | 59.0% 1,022 | |
| 1952 | 34.1% 644 | 65.9% 1,245 | |
| 1948 | 12.7% 135 | 80.1% 849 | 7.2% 76 |
| 1944 | 21.7% 266 | 78.3% 960 | |
| 1940 | 16.2% 228 | 83.8% 1,176 | |
| 1936 | 14.2% 161 | 85.8% 970 | |
| 1932 | 14.9% 225 | 84.9% 1,280 | 0.1% 2 |
| 1928 | 49.6% 600 | 50.4% 609 | |
| 1924 | 34.6% 295 | 64.5% 550 | 0.9% 8 |
| 1920 | 31.9% 487 | 68.2% 1,042 | |
| 1916 | 30.8% 288 | 69.1% 645 | 0.1% 1 |
| 1912 | 24.8% 228 | 70.4% 647 | 4.8% 44 |
References
- Talk Like A Tarheel Archived 2013-06-22 at the Wayback Machine, from the North Carolina Collection's website at the University of North Carolina at Chapel Hill. Retrieved 2013-02-05.
- "State & County QuickFacts". United States Census Bureau. Archived from the original on June 7, 2011. Retrieved October 29, 2013.
- "Find a County". National Association of Counties. Retrieved 2011-06-07.
- "North Carolina: Individual County Chronologies". North Carolina Atlas of Historical County Boundaries. The Newberry Library. 2009. Retrieved January 25, 2015.
- "2010 Census Gazetteer Files". United States Census Bureau. August 22, 2012. Archived from the original on January 12, 2015. Retrieved January 18, 2015.
- "Population and Housing Unit Estimates". Retrieved July 24, 2019.
- "U.S. Decennial Census". United States Census Bureau. Retrieved January 18, 2015.
- "Historical Census Browser". University of Virginia Library. Retrieved January 18, 2015.
- Forstall, Richard L., ed. (March 27, 1995). "Population of Counties by Decennial Census: 1900 to 1990". United States Census Bureau. Retrieved January 18, 2015.
- "Census 2000 PHC-T-4. Ranking Tables for Counties: 1990 and 2000" (PDF). United States Census Bureau. April 2, 2001. Retrieved January 18, 2015.
- "U.S. Census website". United States Census Bureau. Retrieved 2008-01-31.
- Leip, David. "Dave Leip's Atlas of U.S. Presidential Elections". uselectionatlas.org. Retrieved 2018-03-17.
External links
- NCGenWeb Perquimans County - genealogy resources for the county
Places adjacent to Perquimans County, North Carolina | ||||||||||
|---|---|---|---|---|---|---|---|---|---|---|
| ||||||||||
Municipalities and communities of Perquimans County, North Carolina, United States | ||
|---|---|---|
| Towns | 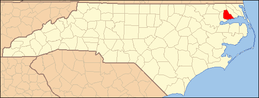 | |
| Unincorporated communities | ||
| Authority control |
|
|---|