New Hanover County, North Carolina
New Hanover County is one of 100 counties located in the U.S. state of North Carolina. As of the 2010 census, the population was 202,667.[1] Though the second-smallest county in land area,[2] it is one of the most populous, as its county seat, Wilmington,[3] is one of the state's largest cities. The county was created in 1729 as New Hanover Precinct and gained county status in 1739.[4]
New Hanover County | |
|---|---|
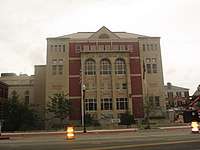
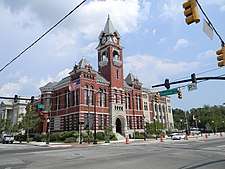 New Hanover County Courthouse in Wilmington | |
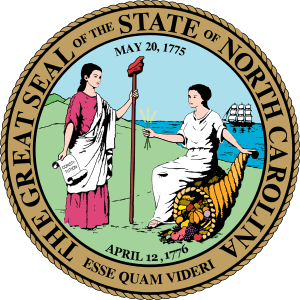
 Seal | |
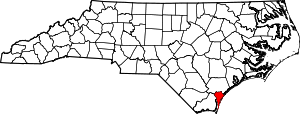 Location within the U.S. state of North Carolina | |
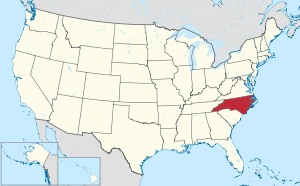 North Carolina's location within the U.S. | |
| Coordinates: 34°11′N 77°52′W | |
| Country | |
| State | |
| Founded | 1739 |
| Named for | House of Hanover |
| Seat | Wilmington |
| Largest city | Wilmington |
| Area | |
| • Total | 328 sq mi (850 km2) |
| • Land | 192 sq mi (500 km2) |
| • Water | 137 sq mi (350 km2) 42%% |
| Population | |
| • Estimate (2019) | 234,473 |
| • Density | 1,058/sq mi (408/km2) |
| Time zone | UTC−5 (Eastern) |
| • Summer (DST) | UTC−4 (EDT) |
| Congressional district | 7th |
| Website | www |

New Hanover County is included in the Wilmington, NC Metropolitan Statistical Area, which also includes neighboring Pender County.
History
Located in the Low Country or Tidewater of North Carolina, the county was formed in 1729 as New Hanover Precinct of Bath County, from Craven Precinct. It was named for the House of Hanover, a German royal family then ruling Great Britain.[5]
In 1734 parts of New Hanover Precinct became Bladen Precinct and Onslow Precinct. With the abolition of Bath County in 1739, all of its constituent precincts became counties.
In 1750 the northern part of New Hanover County became Duplin County. In 1764 another part of New Hanover County was combined with part of Bladen County to form Brunswick County. Finally, in 1875 the separation of northern New Hanover County to form Pender County reduced it to its present dimensions. The county was developed as plantations, largely for the cultivation of tobacco and other commodity crops by gangs of enslaved African-American workers.
By 1860, the county seat and county were majority-black in population, with most of those people enslaved. Some of the closing battles of the American Civil War took place in this county, including the Second Battle of Fort Fisher (the last major coastal stronghold of the Confederacy) and the Battle of Wilmington. White Democrats were resentful when freedmen were given the vote.
Following the Reconstruction era, white Democrats regained control of the state legislature and continued to impose white supremacy across the state through Jim Crow laws. Violence by whites against blacks increased in the late 19th century, with 22 lynching deaths of African Americans recorded before the mid-20th century.[6][7]
Racial terrorism on a larger scale took place in the Wilmington Insurrection of 1898, when a group of white Democrats rejected a duly elected, biracial city government. After overthrowing the Fusionist government, the mayor and city council, they led mobs that rioted and attacked the city's black neighborhoods and residents. A total of 60-300 blacks are believed to have been killed in the rioting, leaders were driven out of the city, and the presses of a black-owned newspaper were destroyed, along with many houses and businesses.
The insurrection was planned by a group of nine conspirators, who included Hugh MacRae. He later donated land to New Hanover County for a park; it was named in his honor. A plaque was installed there explaining the donation and his life; it does not refer to his role in the 1898 coup d'état.
Soon after, the state passed a new constitution raising barriers to voter registration: this effectively disenfranchised most blacks and imposed Jim Crow laws, forcing blacks out of the political system and into legal second-class status. These civil rights injustices were largely maintained into the 1960s, three generations later.
Geography
According to the U.S. Census Bureau, the county has a total area of 328 square miles (850 km2), of which 192 square miles (500 km2) is land and 137 square miles (350 km2) (42%) is water.[8] It is the second-smallest county in North Carolina by land area (behind only Chowan County).
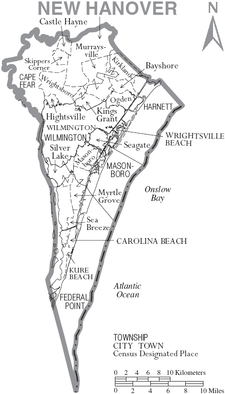
Islands
- Pleasure Island
- Figure Eight Island
- Masonboro Island
- Wrightsville Beach
Adjacent counties
- Pender County - north
- Brunswick County - west
Demographics
| Historical population | |||
|---|---|---|---|
| Census | Pop. | %± | |
| 1790 | 6,837 | — | |
| 1800 | 7,060 | 3.3% | |
| 1810 | 11,465 | 62.4% | |
| 1820 | 10,866 | −5.2% | |
| 1830 | 10,959 | 0.9% | |
| 1840 | 13,312 | 21.5% | |
| 1850 | 17,668 | 32.7% | |
| 1860 | 21,715 | 22.9% | |
| 1870 | 27,978 | 28.8% | |
| 1880 | 21,376 | −23.6% | |
| 1890 | 24,026 | 12.4% | |
| 1900 | 25,785 | 7.3% | |
| 1910 | 32,037 | 24.2% | |
| 1920 | 40,620 | 26.8% | |
| 1930 | 43,010 | 5.9% | |
| 1940 | 47,935 | 11.5% | |
| 1950 | 63,272 | 32.0% | |
| 1960 | 71,742 | 13.4% | |
| 1970 | 82,996 | 15.7% | |
| 1980 | 103,471 | 24.7% | |
| 1990 | 120,284 | 16.2% | |
| 2000 | 160,307 | 33.3% | |
| 2010 | 202,667 | 26.4% | |
| Est. 2019 | 234,473 | [9] | 15.7% |
| U.S. Decennial Census[10] 1790-1960[11] 1900-1990[12] 1990-2000[13] 2010-2013[1] | |||
As of the census[14] of 2000, there were 160,307 people, 68,183 households, and 41,591 families residing in the county. The population density was 806 people per square mile (311/km²). There were 79,616 housing units at an average density of 400 per square mile (155/km²). The racial makeup of the county was 79.91% White, 16.97% Black or African American, 0.39% Native American, 0.83% Asian, 0.06% Pacific Islander, 0.79% from other races, and 1.05% from two or more races. 2.04% of the population were Hispanic or Latino of any race. 14.3% were of English, 13.0% United States or American, 10.6% German and 10.2% Irish ancestry according to Census 2000.
There were 68,183 households out of which 26.10% had children under the age of 18 living with them, 46.50% were married couples living together, 11.50% had a female householder with no husband present, and 39.00% were non-families. 28.90% of all households were made up of individuals and 8.50% had someone living alone who was 65 years of age or older. The average household size were 2.29 and the average family size was 2.83.
In the county, the population was spread out with 21.00% under the age of 18, 12.00% from 18 to 24, 30.50% from 25 to 44, 23.70% from 45 to 64, and 12.80% who were 65 years of age or older. The median age was 36 years. For every 100 females there were 93.30 males. For every 100 females age 18 and over, there were 90.70 males.
The median income for a household in the county was $40,172, and the median income for a family was $50,861. Males had a median income of $35,801 versus $25,305 for females. The per capita income for the county was $23,123. About 8.30% of families and 13.10% of the population were below the poverty line, including 15.70% of those under age 18 and 9.00% of those age 65 or over.
Communities
City
- Wilmington (county seat)
Townships
- Cape Fear
- Federal Point
- Harnett
- Masonboro
- Wilmington
Census-designated places
Unincorporated communities
Law and government
New Hanover is considered a fairly evenly divided county in political terms, favoring Democrats and Republicans in near equal measure. In the 2004 presidential elections, the county supported George W. Bush over John Kerry by 56% to 44%. On that same day, it voted by 53% to 45% to re-elect Democratic Governor Mike Easley against local Republican Patrick J. Ballantine.
New Hanover County is primarily represented in the U.S. House of Representatives by the Republican David Rouser, who represents North Carolina's 7th congressional district. In 2012, a portion of Northwestern and Central New Hanover County was redistricted to the North Carolina's 3rd congressional district, which was represented by the Republican Walter B. Jones before his death, and in the North Carolina Senate by Sen. Michael V. Lee (R). Of its three members of the North Carolina House of Representatives, two are Republicans, and one is a Democrat.
New Hanover County is a member of the regional Cape Fear Council of Governments.
Politics
Although New Hanover County has been close in recent elections, it has voted for the Republican candidate for president in every election since 1980. Before 1968, it was a typical "Solid South" county except in 1928 when Herbert Hoover carried it due to anti-Catholicism.
| Year | Republican | Democratic | Third parties |
|---|---|---|---|
| 2016 | 49.5% 55,344 | 45.6% 50,979 | 5.0% 5,582 |
| 2012 | 51.5% 53,385 | 47.0% 48,668 | 1.5% 1,575 |
| 2008 | 50.2% 50,544 | 48.8% 49,145 | 1.0% 976 |
| 2004 | 55.8% 45,351 | 43.8% 35,572 | 0.4% 324 |
| 2000 | 55.0% 36,503 | 44.2% 29,292 | 0.8% 524 |
| 1996 | 50.9% 27,889 | 41.7% 22,839 | 7.4% 4,041 |
| 1992 | 46.7% 24,338 | 38.9% 20,291 | 14.4% 7,525 |
| 1988 | 60.6% 23,807 | 39.2% 15,401 | 0.3% 105 |
| 1984 | 65.2% 23,771 | 34.5% 12,591 | 0.3% 90 |
| 1980 | 53.5% 17,243 | 42.4% 13,670 | 4.1% 1,331 |
| 1976 | 48.1% 13,687 | 50.9% 14,504 | 1.0% 286 |
| 1972 | 74.4% 19,060 | 23.0% 5,894 | 2.6% 661 |
| 1968 | 37.0% 10,020 | 28.6% 7,750 | 34.3% 9,291 |
| 1964 | 49.1% 12,140 | 50.9% 12,584 | |
| 1960 | 42.6% 9,775 | 57.4% 13,182 | |
| 1956 | 48.0% 9,470 | 52.0% 10,247 | |
| 1952 | 47.5% 9,330 | 52.5% 10,330 | |
| 1948 | 28.3% 3,162 | 47.9% 5,364 | 23.8% 2,667 |
| 1944 | 23.0% 2,829 | 77.0% 9,467 | |
| 1940 | 16.0% 1,635 | 84.0% 8,600 | |
| 1936 | 15.0% 1,306 | 85.0% 7,379 | |
| 1932 | 18.8% 1,430 | 79.3% 6,030 | 1.9% 141 |
| 1928 | 60.6% 4,248 | 39.4% 2,760 | |
| 1924 | 18.8% 1,190 | 74.8% 4,735 | 6.4% 405 |
| 1920 | 14.8% 712 | 85.2% 4,102 | |
| 1916 | 17.3% 492 | 82.7% 2,355 | |
| 1912 | 6.2% 140 | 89.1% 2,021 | 4.7% 107 |
Education
The county is served by New Hanover County Schools.
Notable residents
New Hanover is the home county of famous basketball star Michael Jordan, and birth county of Lara Trump (the daughter-in-law of President Donald Trump).
See also
References
- "State & County QuickFacts". United States Census Bureau. Retrieved October 27, 2013.
- "North Carolina Land Area County Rank". www.usa.com. Retrieved 2018-09-17.
- "Find a County". National Association of Counties. Retrieved 2011-06-07.
- "North Carolina: Individual County Chronologies". North Carolina Atlas of Historical County Boundaries. The Newberry Library. 2009. Retrieved January 25, 2015.
- Proffitt, Martie (Apr 17, 1983). "Local history offers tasty tidbits". Star-News. pp. 8C. Retrieved 1 November 2015.
- Lynching in America/Supplement: Lynching by County, 3rd edition Archived 2017-10-23 at the Wayback Machine, 2017, Montgomery, Alabama: Equal Justice Initiative, p. 7
- Allen Johnson, "Lynching memorial a stark reminder of terrorism in America", News & Observer (Greensboro, NC), 25 April 2018
- "2010 Census Gazetteer Files". United States Census Bureau. August 22, 2012. Archived from the original on January 12, 2015. Retrieved January 18, 2015.
- "Population and Housing Unit Estimates". Retrieved March 28, 2020.
- "U.S. Decennial Census". United States Census Bureau. Retrieved January 18, 2015.
- "Historical Census Browser". University of Virginia Library. Retrieved January 18, 2015.
- Forstall, Richard L., ed. (March 27, 1995). "Population of Counties by Decennial Census: 1900 to 1990". United States Census Bureau. Retrieved January 18, 2015.
- "Census 2000 PHC-T-4. Ranking Tables for Counties: 1990 and 2000" (PDF). United States Census Bureau. April 2, 2001. Retrieved January 18, 2015.
- "U.S. Census website". United States Census Bureau. Retrieved 2008-01-31.
- Leip, David. "Dave Leip's Atlas of U.S. Presidential Elections". uselectionatlas.org. Retrieved 2018-03-16.
External links
| Wikimedia Commons has media related to New Hanover County, North Carolina. |

- Carolina Beach NC 411
- Wrightsville Beach NC 411
- New Hanover County government official website
- NCGenWeb New Hanover County - free genealogy resources for the county
- Wilmington North Carolina Relocation Guide
- Wilmington North Carolina Real Estate Search
Places adjacent to New Hanover County, North Carolina | ||||||||||
|---|---|---|---|---|---|---|---|---|---|---|
| ||||||||||
Municipalities and communities of New Hanover County, North Carolina, United States | ||
|---|---|---|
| City | 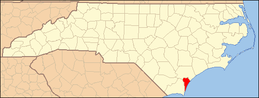 | |
| Towns | ||
| CDPs | ||
| Unincorporated communities | ||
New Hanover County Schools operates public schools in this county. | ||
| Public |
| |
| Private |
| |
| ||
| Authority control |
|
|---|