Lee County, North Carolina
Lee County is a county located in the U.S. state of North Carolina. As of the 2010 census, the population was 57,866.[1] The county seat is Sanford.[2] It was established on March 6, 1907, from parts of Chatham and Moore counties, and named for General Robert E. Lee, who served as the General in Chief of the Armies of the Confederate States in 1865.[3]
Lee County | |
|---|---|
| County of Lee | |
 Lee County Courthouse, 2007 | |
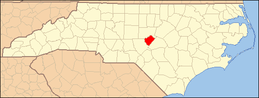
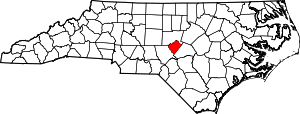 Location within the U.S. state of North Carolina | |
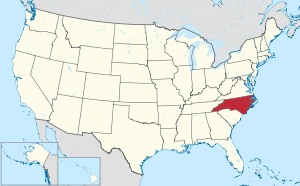 North Carolina's location within the U.S. | |
| Coordinates: 35°29′N 79°10′W | |
| Country | |
| State | |
| Founded | March 6, 1907 |
| Named for | General Robert E. Lee |
| Seat | Sanford |
| Largest city | Sanford |
| Area | |
| • Total | 259 sq mi (670 km2) |
| • Land | 255 sq mi (660 km2) |
| • Water | 4.1 sq mi (11 km2) 1.6%% |
| Population | |
| • Estimate (2018) | 61,452 |
| • Density | 227/sq mi (88/km2) |
| Time zone | UTC−5 (Eastern) |
| • Summer (DST) | UTC−4 (EDT) |
| Congressional district | 6th |
| Website | www |
Lee County comprises the Sanford Micropolitan Statistical Area, which is a part of the greater Raleigh-Durham-Chapel Hill, NC Combined Statistical Area, which had a 2012 estimated population of 1,998,808.
Geography
According to the U.S. Census Bureau, the county has a total area of 259 square miles (670 km2), of which 255 square miles (660 km2) is land and 4.1 square miles (11 km2) (1.6%) is water.[4]
Adjacent counties
- Chatham County - north
- Harnett County - southeast
- Moore County - southwest
Demographics
| Historical population | |||
|---|---|---|---|
| Census | Pop. | %± | |
| 1910 | 11,376 | — | |
| 1920 | 13,400 | 17.8% | |
| 1930 | 16,996 | 26.8% | |
| 1940 | 18,743 | 10.3% | |
| 1950 | 23,522 | 25.5% | |
| 1960 | 26,561 | 12.9% | |
| 1970 | 30,467 | 14.7% | |
| 1980 | 36,718 | 20.5% | |
| 1990 | 41,374 | 12.7% | |
| 2000 | 49,040 | 18.5% | |
| 2010 | 57,866 | 18.0% | |
| Est. 2018 | 61,452 | [5] | 6.2% |
| U.S. Decennial Census[6] 1790-1960[7] 1900-1990[8] 1990-2000[9] 2010-2013[1] | |||
As of the census[10] of 2000, there were 49,040 people, 18,466 households, and 13,369 families residing in the county. The population density was 191 people per square mile (74/km2). There were 19,909 housing units at an average density of 77 per square mile (30/km2). The racial makeup of the county was 70.03% White, 20.46% Black or African American, 0.42% Native American, 0.67% Asian, 0.04% Pacific Islander, 7.33% from other races, and 1.06% from two or more races. 11.65% of the population were Hispanic or Latino of any race.
By 2005 14.2% of the County population was Latino. 20.2% of the population was African-American. 64.2% of the population was non-Hispanic whites.
In 2000 there were 18,466 households, out of which 33.30% had children under the age of 18 living with them, 54.30% were married couples living together, 13.40% had a female householder with no husband present, and 27.60% were non-families. 23.50% of all households were made up of individuals, and 8.80% had someone living alone who was 65 years of age or older. The average household size was 2.61 and the average family size was 3.05.
In the county, the population was spread out, with 25.70% under the age of 18, 9.00% from 18 to 24, 29.70% from 25 to 44, 22.70% from 45 to 64, and 12.90% who were 65 years of age or older. The median age was 36 years. For every 100 females there were 97.50 males. For every 100 females age 18 and over, there were 95.00 males.
The median income for a household in the county was $38,900, and the median income for a family was $45,373. Males had a median income of $32,780 versus $23,660 for females. The per capita income for the county was $19,147. About 9.80% of families and 12.80% of the population were below the poverty line, including 16.50% of those under age 18 and 12.20% of those age 65 or over.
Communities

City
Town
Townships
The county is divided into seven townships, which are both numbered and named:
- 1 (Greenwood)
- 2 (Jonesboro)
- 3 (Cape Fear)
- 4 (Deep River)
- 5 (East Sanford)
- 6 (West Sanford)
- 7 (Pocket)
Politics, law and government
Lee is a typical "Solid South" county in terms of voting patterns. From its first election in 1908 it voted Democratic by large margins until 1968, except in the 1928 election when anti-Prohibition Catholic Al Smith held the county by single digits. In 1968, Lee's Democratic streak was broken when its electorate chose the American Independent candidate George Wallace. From 1972 onwards, Lee has voted Republican in every election except for Jimmy Carter's two elections in 1976 and 1980.
| Year | Republican | Democratic | Third parties |
|---|---|---|---|
| 2016 | 54.7% 13,712 | 41.7% 10,469 | 3.6% 903 |
| 2012 | 54.3% 13,158 | 44.6% 10,801 | 1.2% 280 |
| 2008 | 53.7% 12,775 | 45.3% 10,784 | 1.0% 229 |
| 2004 | 60.6% 11,834 | 39.2% 7,657 | 0.3% 52 |
| 2000 | 57.8% 9,406 | 41.7% 6,785 | 0.6% 92 |
| 1996 | 50.0% 7,321 | 43.0% 6,290 | 7.0% 1,019 |
| 1992 | 45.4% 6,658 | 39.9% 5,852 | 14.7% 2,149 |
| 1988 | 62.5% 7,104 | 37.2% 4,231 | 0.3% 36 |
| 1984 | 67.5% 8,198 | 32.3% 3,925 | 0.2% 28 |
| 1980 | 45.8% 4,847 | 51.3% 5,426 | 2.8% 301 |
| 1976 | 41.8% 3,691 | 57.8% 5,104 | 0.4% 36 |
| 1972 | 72.7% 5,836 | 25.2% 2,024 | 2.1% 166 |
| 1968 | 29.3% 2,586 | 28.6% 2,524 | 42.1% 3,711 |
| 1964 | 36.8% 2,753 | 63.2% 4,730 | |
| 1960 | 35.4% 2,563 | 64.6% 4,673 | |
| 1956 | 31.9% 1,948 | 68.1% 4,163 | |
| 1952 | 31.0% 2,105 | 69.0% 4,688 | |
| 1948 | 20.0% 871 | 74.4% 3,234 | 5.6% 243 |
| 1944 | 19.0% 808 | 81.0% 3,448 | |
| 1940 | 12.5% 527 | 87.5% 3,682 | |
| 1936 | 15.3% 670 | 84.8% 3,723 | |
| 1932 | 18.2% 681 | 81.5% 3,058 | 0.4% 13 |
| 1928 | 45.2% 1,416 | 54.8% 1,715 | |
| 1924 | 27.8% 710 | 71.8% 1,834 | 0.4% 10 |
| 1920 | 32.9% 1,143 | 67.1% 2,327 | |
| 1916 | 35.2% 573 | 64.8% 1,054 | |
| 1912 | 32.9% 451 | 62.8% 862 | 4.4% 60 |
Lee County is a member of the regional Triangle J Council of Governments. The county is governed by a seven-member board of County Commissioners, elected at large to serve four-year terms. Terms are staggered so that, every two years, three or four Commissioners are up for election. The Commissioners enact policies such as establishment of the property tax rate, regulation of land use and zoning outside municipal jurisdictions, and adoption of the annual budget. Commissioners usually meet on the first and third Mondays of each month.
Trivia
- The area has historically been one of the leading brick manufacturing areas in the United States.
- Cotton and tobacco are leading crops in the county.
- The county is divided between the Piedmont in the northern part of the county and the Sandhills in the south.
- Lee County sits in the middle of the Triassic Basin and has the state's most concentrated reserves of oil and natural gas.
See also
References
- "State & County QuickFacts". United States Census Bureau. Archived from the original on June 7, 2011. Retrieved October 21, 2013.
- "Find a County". National Association of Counties. Retrieved June 7, 2011.
- "Establishment of Lee County". www.leecountync.gov. Retrieved March 16, 2018.
- "2010 Census Gazetteer Files". United States Census Bureau. August 22, 2012. Archived from the original on January 12, 2015. Retrieved January 17, 2015.
- "US Census Est 2018". Retrieved May 7, 2019.
- "U.S. Decennial Census". United States Census Bureau. Retrieved January 17, 2015.
- "Historical Census Browser". University of Virginia Library. Retrieved January 17, 2015.
- Forstall, Richard L., ed. (March 27, 1995). "Population of Counties by Decennial Census: 1900 to 1990". United States Census Bureau. Retrieved January 17, 2015.
- "Census 2000 PHC-T-4. Ranking Tables for Counties: 1990 and 2000" (PDF). United States Census Bureau. April 2, 2001. Retrieved January 17, 2015.
- "U.S. Census website". United States Census Bureau. Retrieved January 31, 2008.
- Leip, David. "Dave Leip's Atlas of U.S. Presidential Elections". uselectionatlas.org. Retrieved March 16, 2018.
External links
| Wikimedia Commons has media related to Lee County, North Carolina. |
- Official
- General information
- NCGenWeb Lee County - free genealogy resources for the county
Places adjacent to Lee County, North Carolina | ||||||||||
|---|---|---|---|---|---|---|---|---|---|---|
| ||||||||||

| Authority control |
|
|---|