Rutherford County, North Carolina
Rutherford County is a county located in the southwestern area of the U.S. state of North Carolina. As of the 2010 census, the population was 67,810.[1] Its county seat is Rutherfordton.[2]
Rutherford County | |
|---|---|
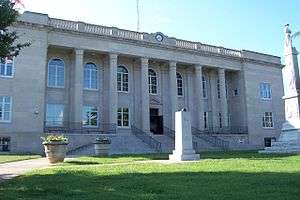 Rutherford County Courthouse in Rutherfordton | |
 Seal | |
| Motto(s): Small Town Friendly | |
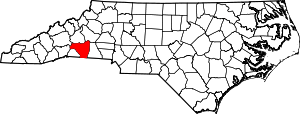 Location within the U.S. state of North Carolina | |
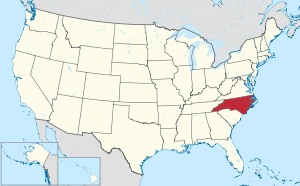 North Carolina's location within the U.S. | |
| Coordinates: 35°24′N 81°55′W | |
| Country | |
| State | |
| Founded | 1779 |
| Named for | Griffith Rutherford |
| Seat | Rutherfordton |
| Largest town | Forest City |
| Area | |
| • Total | 566 sq mi (1,470 km2) |
| • Land | 564 sq mi (1,460 km2) |
| • Water | 1.7 sq mi (4 km2) 0.3%% |
| Population | |
| • Estimate (2018) | 66,826 |
| • Density | 120/sq mi (50/km2) |
| Time zone | UTC−5 (Eastern) |
| • Summer (DST) | UTC−4 (EDT) |
| Congressional district | 10th |
| Website | rutherfordcountync |
Rutherford County comprises the Forest City, NC Micropolitan Statistical Area.
History
The county was formed in 1779 from the western part of the former Tryon County. It was named for Griffith Rutherford, leader of an expedition against the Cherokee in 1776 and a general in the American Revolutionary War.
In 1791 parts of Rutherford County and Burke County were combined to form Buncombe County. In 1841 parts of Rutherford and Lincoln counties were combined to form Cleveland County. In 1842 additional parts of Rutherford and Burke counties were combined to form McDowell County. Finally, in 1855 parts of Rutherford and Henderson counties were combined to form Polk County.
Geography
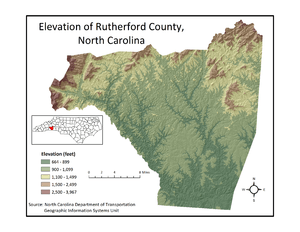
According to the U.S. Census Bureau, the county has a total area of 566 square miles (1,470 km2), of which 564 square miles (1,460 km2) is land and 1.7 square miles (4.4 km2) (0.3%) is water.[3]
Adjacent counties
- McDowell County - north
- Burke County - northeast
- Cleveland County - east
- Cherokee County, South Carolina - south
- Spartanburg County, South Carolina - south
- Polk County - southwest
- Henderson County - west
- Buncombe County - northwest
Demography
| Historical population | |||
|---|---|---|---|
| Census | Pop. | %± | |
| 1790 | 7,808 | — | |
| 1800 | 10,753 | 37.7% | |
| 1810 | 13,202 | 22.8% | |
| 1820 | 15,351 | 16.3% | |
| 1830 | 17,557 | 14.4% | |
| 1840 | 19,202 | 9.4% | |
| 1850 | 13,550 | −29.4% | |
| 1860 | 11,573 | −14.6% | |
| 1870 | 13,121 | 13.4% | |
| 1880 | 15,198 | 15.8% | |
| 1890 | 18,770 | 23.5% | |
| 1900 | 25,101 | 33.7% | |
| 1910 | 28,385 | 13.1% | |
| 1920 | 31,426 | 10.7% | |
| 1930 | 40,452 | 28.7% | |
| 1940 | 45,577 | 12.7% | |
| 1950 | 46,356 | 1.7% | |
| 1960 | 45,091 | −2.7% | |
| 1970 | 47,337 | 5.0% | |
| 1980 | 53,787 | 13.6% | |
| 1990 | 56,918 | 5.8% | |
| 2000 | 62,899 | 10.5% | |
| 2010 | 67,810 | 7.8% | |
| Est. 2018 | 66,826 | [4] | −1.5% |
| U.S. Decennial Census[5] 1790-1960[6] 1900-1990[7] 1990-2000[8] 2010-2013[1] | |||
As of the census[9] of 2000, there were 62,899 people, 25,191 households, and 17,935 families residing in the county. The population density was 112 people per square mile (43/km²). There were 29,535 housing units at an average density of 52 per square mile (20/km²). The racial makeup of the county was 86.79% White, 11.23% Black or African American, 0.20% Native American, 0.22% Asian, 0.03% Pacific Islander, 0.67% from other races, and 0.74% from two or more races. 1.81% of the population were Hispanic or Latino of any race.
The largest ancestry groups in Rutherford County are:[10]
- English - 44%
- Irish - 9%
- African American - 11%
- German - 5%
- Scotch-Irish - 4%
- Scottish - 3%
- Dutch - 2%
- Italian - 1%
- French or French Canadian (except Basque) - 1%
- Mexican - 1%
- Polish - 1%
There were 25,191 households out of which 30.00% had children under the age of 18 living with them, 55.40% were married couples living together, 11.70% had a female householder with no husband present, and 28.80% were non-families. 25.50% of all households were made up of individuals and 11.10% had someone living alone who was 65 years of age or older. The average household size was 2.44 and the average family size was 2.90.
In the county, the population was spread out with 23.80% under the age of 18, 8.00% from 18 to 24, 27.90% from 25 to 44, 24.30% from 45 to 64, and 16.00% who were 65 years of age or older. The median age was 38 years. For every 100 females there were 93.00 males. For every 100 females age 18 and over, there were 89.60 males.
The median income for a household in the county was $31,122, and the median income for a family was $37,787. Males had a median income of $28,890 versus $21,489 for females. The per capita income for the county was $16,270. About 10.40% of families and 13.90% of the population were below the poverty line, including 18.30% of those under age 18 and 13.80% of those age 65 or over.
Economy
In 2010, Rutherford County was selected as the location for a new $450 million data center for Facebook.[11][12]
Horsehead Corporation announced the construction of its new, state-of-the-art zinc and diversified metals production facility in Rutherford County, NC, near the municipality of Forest City.[13]
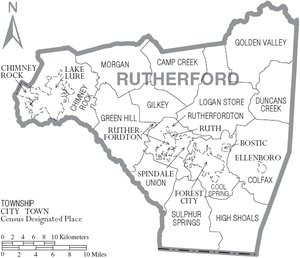
Communities
Towns
- Bostic
- Ellenboro
- Forest City
- Lake Lure
- Ruth
- Rutherfordton (county seat)
- Spindale
Village
Unincorporated communities
- Alexander Mills (merged with Forest City)
- Corinth
- Harris
- Hopewell
- Mount Vernon
- Union Mills
- Sandy Mush
Townships
- Camp Creek
- Chimney Rock
- Colfax
- Cool Spring
- Duncans Creek
- Gilkey
- Golden Valley
- Green Hill
- High Shoals
- Logan Store
- Morgan
- Rutherfordton
- Sulphur Springs
- Union
Politics
Rutherford is currently a powerfully Republican county. No Democratic presidential candidate has carried Rutherford County since Jimmy Carter did so in 1976 – and Hillary Clinton's 24.4 percent in 2016 is the worst performance ever by a Democrat. Before 1928 when Herbert Hoover won it, however, the county was a clear-cut part of the Democratic "Solid South".
| Year | Republican | Democratic | Third parties |
|---|---|---|---|
| 2016 | 72.2% 21,871 | 24.8% 7,512 | 3.1% 924 |
| 2012 | 66.0% 18,954 | 32.7% 9,374 | 1.3% 374 |
| 2008 | 65.4% 18,769 | 33.6% 9,641 | 1.1% 310 |
| 2004 | 66.3% 16,343 | 33.2% 8,184 | 0.5% 131 |
| 2000 | 63.3% 13,755 | 35.4% 7,697 | 1.2% 264 |
| 1996 | 52.7% 9,792 | 38.6% 7,162 | 8.7% 1,617 |
| 1992 | 48.0% 9,748 | 38.6% 7,855 | 13.4% 2,726 |
| 1988 | 59.7% 10,337 | 40.0% 6,926 | 0.3% 43 |
| 1984 | 62.2% 11,369 | 37.6% 6,862 | 0.2% 37 |
| 1980 | 49.3% 8,363 | 49.0% 8,315 | 1.7% 288 |
| 1976 | 39.2% 6,718 | 60.5% 10,361 | 0.3% 42 |
| 1972 | 68.8% 9,506 | 30.0% 4,140 | 1.2% 170 |
| 1968 | 46.1% 7,785 | 27.4% 4,622 | 26.5% 4,476 |
| 1964 | 42.7% 7,115 | 57.3% 9,541 | |
| 1960 | 51.3% 8,993 | 48.8% 8,554 | |
| 1956 | 53.2% 8,200 | 46.8% 7,208 | |
| 1952 | 52.0% 8,387 | 48.0% 7,755 | |
| 1948 | 37.0% 4,342 | 51.0% 5,992 | 12.1% 1,416 |
| 1944 | 38.9% 4,698 | 61.1% 7,379 | |
| 1940 | 32.2% 4,204 | 67.8% 8,869 | |
| 1936 | 32.8% 4,830 | 67.2% 9,911 | |
| 1932 | 34.7% 4,448 | 64.9% 8,336 | 0.4% 54 |
| 1928 | 58.2% 5,762 | 41.8% 4,146 | |
| 1924 | 43.2% 3,897 | 56.5% 5,101 | 0.3% 29 |
| 1920 | 44.0% 4,015 | 56.0% 5,101 | |
| 1916 | 43.4% 1,871 | 56.7% 2,445 | |
| 1912 | 2.1% 82 | 56.9% 2,180 | 40.9% 1,567 |
Notable people
- Smoky Burgess, record-setting major league baseball player
- Bryan Coker, 12th President of Maryville College
- Walter Dalton, former lieutenant governor of North Carolina (in office 2009-2013)
- Tim Earley, American poet
- Kay Hooper, best-selling author
- Robert McNair, Owner Houston Texans
- Burl Noggle, American historian born in Rutherford County in 1924
- Richard O'Sullivan, screenwriter and filmmaker
References
- "State & County QuickFacts". United States Census Bureau. Retrieved October 29, 2013.
- "Find a County". National Association of Counties. Retrieved 2011-06-07.
- "2010 Census Gazetteer Files". United States Census Bureau. August 22, 2012. Archived from the original on January 12, 2015. Retrieved January 19, 2015.
- "Population and Housing Unit Estimates". Retrieved July 24, 2018.
- "U.S. Decennial Census". United States Census Bureau. Retrieved January 19, 2015.
- "Historical Census Browser". University of Virginia Library. Retrieved January 19, 2015.
- Forstall, Richard L., ed. (March 27, 1995). "Population of Counties by Decennial Census: 1900 to 1990". United States Census Bureau. Retrieved January 19, 2015.
- "Census 2000 PHC-T-4. Ranking Tables for Counties: 1990 and 2000" (PDF). United States Census Bureau. April 2, 2001. Retrieved January 19, 2015.
- "U.S. Census website". United States Census Bureau. Retrieved 2008-01-31.
- Census, United States Bureau of the (1983). 1980 Census of Population and Housing: Census tracts. U.S. Department of Commerce, Bureau of the Census.
- "Archived copy". Archived from the original on 2013-07-03. Retrieved 2012-12-07.CS1 maint: archived copy as title (link)
- "Archived copy". Archived from the original on 2012-05-07. Retrieved 2012-05-27.CS1 maint: archived copy as title (link)
- Leip, David. "Dave Leip's Atlas of U.S. Presidential Elections". uselectionatlas.org. Retrieved 2018-03-17.
External links
- Rutherford County official website
- NCGenWeb Rutherford County- free genealogy resources for the county
- Rutherford County Tourism Information
- Genealogical Society of Old Tryon County
Places adjacent to Rutherford County, North Carolina | ||||||||||
|---|---|---|---|---|---|---|---|---|---|---|
| ||||||||||
Municipalities and communities of Rutherford County, North Carolina, United States | ||
|---|---|---|
| Towns | 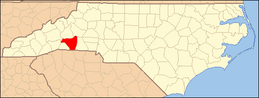 | |
| Village | ||
| CDPs | ||
| Unincorporated communities |
| |
| Authority control |
|
|---|