Petroleum
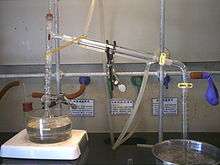
Petroleum (pronounced /pəˈtroʊliəm/) is a naturally occurring, yellowish-black liquid found in geological formations beneath the Earth's surface. It is commonly refined into various types of fuels. Components of petroleum are separated using a technique called fractional distillation, i.e. separation of a liquid mixture into fractions differing in boiling point by means of distillation, typically using a fractionating column.

It consists of naturally occurring hydrocarbons of various molecular weights and may contain miscellaneous organic compounds.[1] The name petroleum covers both naturally occurring unprocessed crude oil and petroleum products that are made up of refined crude oil. A fossil fuel, petroleum is formed when large quantities of dead organisms, mostly zooplankton and algae, are buried underneath sedimentary rock and subjected to both intense heat and pressure.
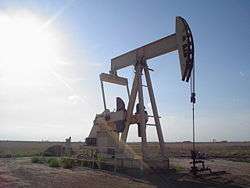
Petroleum has mostly been recovered by oil drilling (natural petroleum springs are rare). Drilling is carried out after studies of structural geology (at the reservoir scale), sedimentary basin analysis, and reservoir characterisation (mainly in terms of the porosity and permeability of geologic reservoir structures) have been completed.[2][3] It is refined and separated, most easily by distillation, into numerous consumer products, from gasoline (petrol) and kerosene to asphalt and chemical reagents used to make plastics, pesticides and pharmaceuticals.[4] Petroleum is used in manufacturing a wide variety of materials,[5] and it is estimated that the world consumes about 95 million barrels each day.
The use of petroleum as fuel causes global warming and ocean acidification. According to the UN's Intergovernmental Panel on Climate Change, without fossil fuel phase-out, including petroleum, there will be "severe, pervasive, and irreversible impacts for people and ecosystems".[6]
Etymology
The word petroleum comes from Medieval Latin petroleum (literally "rock oil"), which comes from Latin petra', "rock", (from Ancient Greek: πέτρα, romanized: petra, "rock") and Latin oleum, "oil", (from Ancient Greek: ἔλαιον, romanized: élaion, "oil").[7][8]
The term was used in the treatise De Natura Fossilium, published in 1546 by the German mineralogist Georg Bauer, also known as Georgius Agricola.[9] In the 19th century, the term petroleum was often used to refer to mineral oils produced by distillation from mined organic solids such as cannel coal (and later oil shale) and refined oils produced from them; in the United Kingdom, storage (and later transport) of these oils were regulated by a series of Petroleum Acts, from the Petroleum Act 1863 onwards.
History
Early
Petroleum, in one form or another, has been used since ancient times, and is now important across society, including in economy, politics and technology. The rise in importance was due to the invention of the internal combustion engine, the rise in commercial aviation, and the importance of petroleum to industrial organic chemistry, particularly the synthesis of plastics, fertilisers, solvents, adhesives and pesticides.
More than 4000 years ago, according to Herodotus and Diodorus Siculus, asphalt was used in the construction of the walls and towers of Babylon; there were oil pits near Ardericca (near Babylon), and a pitch spring on Zacynthus.[10] Great quantities of it were found on the banks of the river Issus, one of the tributaries of the Euphrates. Ancient Persian tablets indicate the medicinal and lighting uses of petroleum in the upper levels of their society.
The use of petroleum in ancient China dates back to more than 2000 years ago. In I Ching, one of the earliest Chinese writings cites that oil in its raw state, without refining, was first discovered, extracted, and used in China in the first century BCE. In addition, the Chinese were the first to record the use of petroleum as fuel as early as the fourth century BCE.[11][12][13] By 347 CE, oil was produced from bamboo-drilled wells in China.[14][15]
Crude oil was often distilled by Persian chemists, with clear descriptions given in Arabic handbooks such as those of Muhammad ibn Zakarīya Rāzi (Rhazes).[16] The streets of Baghdad were paved with tar, derived from petroleum that became accessible from natural fields in the region. In the 9th century, oil fields were exploited in the area around modern Baku, Azerbaijan. These fields were described by the Arab geographer Abu al-Hasan 'Alī al-Mas'ūdī in the 10th century, and by Marco Polo in the 13th century, who described the output of those wells as hundreds of shiploads.[17] Arab and Persian chemists also distilled crude oil in order to produce flammable products for military purposes. Through Islamic Spain, distillation became available in Western Europe by the 12th century.[18] It has also been present in Romania since the 13th century, being recorded as păcură.[19]
Early British explorers to Myanmar documented a flourishing oil extraction industry based in Yenangyaung that, in 1795, had hundreds of hand-dug wells under production.[20]
Pechelbronn (Pitch fountain) is said to be the first European site where petroleum has been explored and used. The still active Erdpechquelle, a spring where petroleum appears mixed with water has been used since 1498, notably for medical purposes. Oil sands have been mined since the 18th century.[21]
In Wietze in lower Saxony, natural asphalt/bitumen has been explored since the 18th century.[22] Both in Pechelbronn as in Wietze, the coal industry dominated the petroleum technologies.[23]
Modern
Chemist James Young noticed a natural petroleum seepage in the Riddings colliery at Alfreton, Derbyshire from which he distilled a light thin oil suitable for use as lamp oil, at the same time obtaining a more viscous oil suitable for lubricating machinery. In 1848, Young set up a small business refining the crude oil.[24]
Young eventually succeeded, by distilling cannel coal at a low heat, in creating a fluid resembling petroleum, which when treated in the same way as the seep oil gave similar products. Young found that by slow distillation he could obtain a number of useful liquids from it, one of which he named "paraffine oil" because at low temperatures it congealed into a substance resembling paraffin wax.[24]
The production of these oils and solid paraffin wax from coal formed the subject of his patent dated 17 October 1850. In 1850 Young & Meldrum and Edward William Binney entered into partnership under the title of E.W. Binney & Co. at Bathgate in West Lothian and E. Meldrum & Co. at Glasgow; their works at Bathgate were completed in 1851 and became the first truly commercial oil-works in the world with the first modern oil refinery.[25]
The world's first oil refinery was built in 1856 by Ignacy Łukasiewicz.[26] His achievements also included the discovery of how to distill kerosene from seep oil, the invention of the modern kerosene lamp (1853), the introduction of the first modern street lamp in Europe (1853), and the construction of the world's first modern oil well (1854).[27]
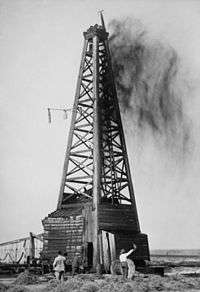
The demand for petroleum as a fuel for lighting in North America and around the world quickly grew.[28] Edwin Drake's 1859 well near Titusville, Pennsylvania, is popularly considered the first modern well. Already 1858 Georg Christian Konrad Hunäus had found a significant amount of petroleum while drilling for lignite 1858 in Wietze, Germany. Wietze later provided about 80% of the German consumption in the Wilhelminian Era.[29] The production stopped in 1963, but Wietze has hosted a Petroleum Museum since 1970.[30]
Drake's well is probably singled out because it was drilled, not dug; because it used a steam engine; because there was a company associated with it; and because it touched off a major boom.[31] However, there was considerable activity before Drake in various parts of the world in the mid-19th century. A group directed by Major Alexeyev of the Bakinskii Corps of Mining Engineers hand-drilled a well in the Baku region in 1848.[32] There were engine-drilled wells in West Virginia in the same year as Drake's well.[33] An early commercial well was hand dug in Poland in 1853, and another in nearby Romania in 1857. At around the same time the world's first, small, oil refinery was opened at Jasło in Poland, with a larger one opened at Ploiești in Romania shortly after. Romania is the first country in the world to have had its annual crude oil output officially recorded in international statistics: 275 tonnes for 1857.[34][35]
The first commercial oil well in Canada became operational in 1858 at Oil Springs, Ontario (then Canada West).[36] Businessman James Miller Williams dug several wells between 1855 and 1858 before discovering a rich reserve of oil four metres below ground.[37] Williams extracted 1.5 million litres of crude oil by 1860, refining much of it into kerosene lamp oil. Williams's well became commercially viable a year before Drake's Pennsylvania operation and could be argued to be the first commercial oil well in North America.[38] The discovery at Oil Springs touched off an oil boom which brought hundreds of speculators and workers to the area. Advances in drilling continued into 1862 when local driller Shaw reached a depth of 62 metres using the spring-pole drilling method.[39] On January 16, 1862, after an explosion of natural gas Canada's first oil gusher came into production, shooting into the air at a recorded rate of 3,000 barrels per day.[40] By the end of the 19th century the Russian Empire, particularly the Branobel company in Azerbaijan, had taken the lead in production.[41]

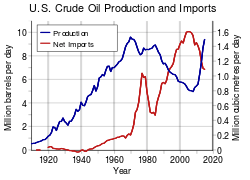
Access to oil was and still is a major factor in several military conflicts of the twentieth century, including World War II, during which oil facilities were a major strategic asset and were extensively bombed.[42] The German invasion of the Soviet Union included the goal to capture the Baku oilfields, as it would provide much needed oil-supplies for the German military which was suffering from blockades.[43] Oil exploration in North America during the early 20th century later led to the US becoming the leading producer by mid-century. As petroleum production in the US peaked during the 1960s, however, the United States was surpassed by Saudi Arabia and the Soviet Union.[44][45][46]
In 1973, Saudi Arabia and other Arab nations imposed an oil embargo against the United States, United Kingdom, Japan and other Western nations which supported Israel in the Yom Kippur War of October 1973.[47] The embargo caused an oil crisis with many short- and long-term effects on global politics and the global economy.[48]
Today, about 90 percent of vehicular fuel needs are met by oil. Petroleum also makes up 40 percent of total energy consumption in the United States, but is responsible for only 1 percent of electricity generation.[49] Petroleum's worth as a portable, dense energy source powering the vast majority of vehicles and as the base of many industrial chemicals makes it one of the world's most important commodities. Viability of the oil commodity is controlled by several key parameters: number of vehicles in the world competing for fuel; quantity of oil exported to the world market (Export Land Model); net energy gain (economically useful energy provided minus energy consumed); political stability of oil exporting nations; and ability to defend oil supply lines.
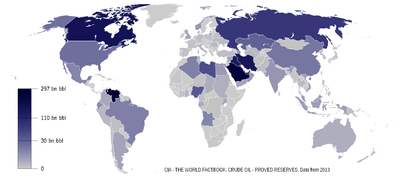
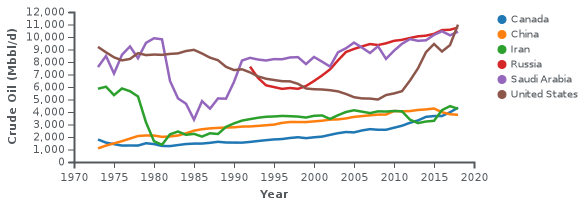
The top three oil producing countries are Russia, Saudi Arabia and the United States.[50] In 2018, due in part to developments in hydraulic fracturing and horizontal drilling, the United States became the world's largest producer.[51][52] About 80 percent of the world's readily accessible reserves are located in the Middle East, with 62.5 percent coming from the Arab 5: Saudi Arabia, United Arab Emirates, Iraq, Qatar and Kuwait. A large portion of the world's total oil exists as unconventional sources, such as bitumen in Athabasca oil sands and extra heavy oil in the Orinoco Belt. While significant volumes of oil are extracted from oil sands, particularly in Canada, logistical and technical hurdles remain, as oil extraction requires large amounts of heat and water, making its net energy content quite low relative to conventional crude oil. Thus, Canada's oil sands are not expected to provide more than a few million barrels per day in the foreseeable future.[53][54][55]
Composition
Petroleum includes not only crude oil, but all liquid, gaseous and solid hydrocarbons. Under surface pressure and temperature conditions, lighter hydrocarbons methane, ethane, propane and butane exist as gases, while pentane and heavier hydrocarbons are in the form of liquids or solids. However, in an underground oil reservoir the proportions of gas, liquid, and solid depend on subsurface conditions and on the phase diagram of the petroleum mixture.[56]
An oil well produces predominantly crude oil, with some natural gas dissolved in it. Because the pressure is lower at the surface than underground, some of the gas will come out of solution and be recovered (or burned) as associated gas or solution gas. A gas well produces predominantly natural gas. However, because the underground temperature and pressure are higher than at the surface, the gas may contain heavier hydrocarbons such as pentane, hexane, and heptane in the gaseous state. At surface conditions these will condense out of the gas to form "natural gas condensate", often shortened to condensate. Condensate resembles gasoline in appearance and is similar in composition to some volatile light crude oils.[57][58][59]
The proportion of light hydrocarbons in the petroleum mixture varies greatly among different oil fields, ranging from as much as 97 percent by weight in the lighter oils to as little as 50 percent in the heavier oils and bitumens.
The hydrocarbons in crude oil are mostly alkanes, cycloalkanes and various aromatic hydrocarbons, while the other organic compounds contain nitrogen, oxygen and sulfur, and trace amounts of metals such as iron, nickel, copper and vanadium. Many oil reservoirs contain live bacteria.[60] The exact molecular composition of crude oil varies widely from formation to formation but the proportion of chemical elements varies over fairly narrow limits as follows:[61]
| Element | Percent range |
|---|---|
| Carbon | 83 to 85% |
| Hydrogen | 10 to 14% |
| Nitrogen | 0.1 to 2% |
| Oxygen | 0.05 to 1.5% |
| Sulfur | 0.05 to 6.0% |
| Metals | < 0.1% |
Four different types of hydrocarbon molecules appear in crude oil. The relative percentage of each varies from oil to oil, determining the properties of each oil.[56]
| Hydrocarbon | Average | Range |
|---|---|---|
| Alkanes (paraffins) | 30% | 15 to 60% |
| Naphthenes | 49% | 30 to 60% |
| Aromatics | 15% | 3 to 30% |
| Asphaltics | 6% | remainder |
Crude oil varies greatly in appearance depending on its composition. It is usually black or dark brown (although it may be yellowish, reddish, or even greenish). In the reservoir it is usually found in association with natural gas, which being lighter forms a "gas cap" over the petroleum, and saline water which, being heavier than most forms of crude oil, generally sinks beneath it. Crude oil may also be found in a semi-solid form mixed with sand and water, as in the Athabasca oil sands in Canada, where it is usually referred to as crude bitumen. In Canada, bitumen is considered a sticky, black, tar-like form of crude oil which is so thick and heavy that it must be heated or diluted before it will flow.[63] Venezuela also has large amounts of oil in the Orinoco oil sands, although the hydrocarbons trapped in them are more fluid than in Canada and are usually called extra heavy oil. These oil sands resources are called unconventional oil to distinguish them from oil which can be extracted using traditional oil well methods. Between them, Canada and Venezuela contain an estimated 3.6 trillion barrels (570×109 m3) of bitumen and extra-heavy oil, about twice the volume of the world's reserves of conventional oil.[64]
Petroleum is used mostly, by volume, for refining into fuel oil and gasoline, both important "primary energy" sources. 84 percent by volume of the hydrocarbons present in petroleum is converted into energy-rich fuels (petroleum-based fuels), including gasoline, diesel, jet, heating, and other fuel oils, and liquefied petroleum gas.[65] The lighter grades of crude oil produce the best yields of these products, but as the world's reserves of light and medium oil are depleted, oil refineries are increasingly having to process heavy oil and bitumen, and use more complex and expensive methods to produce the products required. Because heavier crude oils have too much carbon and not enough hydrogen, these processes generally involve removing carbon from or adding hydrogen to the molecules, and using fluid catalytic cracking to convert the longer, more complex molecules in the oil to the shorter, simpler ones in the fuels.
Due to its high energy density, easy transportability and relative abundance, oil has become the world's most important source of energy since the mid-1950s. Petroleum is also the raw material for many chemical products, including pharmaceuticals, solvents, fertilizers, pesticides, and plastics; the 16 percent not used for energy production is converted into these other materials. Petroleum is found in porous rock formations in the upper strata of some areas of the Earth's crust. There is also petroleum in oil sands (tar sands). Known oil reserves are typically estimated at around 190 km3 (1.2 trillion (short scale) barrels) without oil sands,[66] or 595 km3 (3.74 trillion barrels) with oil sands.[67] Consumption is currently around 84 million barrels (13.4×10⁶ m3) per day, or 4.9 km3 per year, yielding a remaining oil supply of only about 120 years, if current demand remains static.[68]More recent studies, however, put the number at around 50 years[69][70].
Chemistry

Petroleum is a mixture of a very large number of different hydrocarbons; the most commonly found molecules are alkanes (paraffins), cycloalkanes (naphthenes), aromatic hydrocarbons, or more complicated chemicals like asphaltenes. Each petroleum variety has a unique mix of molecules, which define its physical and chemical properties, like color and viscosity.
The alkanes, also known as paraffins, are saturated hydrocarbons with straight or branched chains which contain only carbon and hydrogen and have the general formula CnH2n+2. They generally have from 5 to 40 carbon atoms per molecule, although trace amounts of shorter or longer molecules may be present in the mixture.
The alkanes from pentane (C5H12) to octane (C8H18) are refined into gasoline, the ones from nonane (C9H20) to hexadecane (C16H34) into diesel fuel, kerosene and jet fuel. Alkanes with more than 16 carbon atoms can be refined into fuel oil and lubricating oil. At the heavier end of the range, paraffin wax is an alkane with approximately 25 carbon atoms, while asphalt has 35 and up, although these are usually cracked by modern refineries into more valuable products. The shortest molecules, those with four or fewer carbon atoms, are in a gaseous state at room temperature. They are the petroleum gases. Depending on demand and the cost of recovery, these gases are either flared off, sold as liquefied petroleum gas under pressure, or used to power the refinery's own burners. During the winter, butane (C4H10), is blended into the gasoline pool at high rates, because its high vapour pressure assists with cold starts. Liquified under pressure slightly above atmospheric, it is best known for powering cigarette lighters, but it is also a main fuel source for many developing countries. Propane can be liquified under modest pressure, and is consumed for just about every application relying on petroleum for energy, from cooking to heating to transportation.
The cycloalkanes, also known as naphthenes, are saturated hydrocarbons which have one or more carbon rings to which hydrogen atoms are attached according to the formula CnH2n. Cycloalkanes have similar properties to alkanes but have higher boiling points.
The aromatic hydrocarbons are unsaturated hydrocarbons which have one or more planar six-carbon rings called benzene rings, to which hydrogen atoms are attached with the formula CnH2n-6. They tend to burn with a sooty flame, and many have a sweet aroma. Some are carcinogenic.
These different molecules are separated by fractional distillation at an oil refinery to produce gasoline, jet fuel, kerosene, and other hydrocarbons. For example, 2,2,4-trimethylpentane (isooctane), widely used in gasoline, has a chemical formula of C8H18 and it reacts with oxygen exothermically:[71]
- 2 C
8H
18(l) + 25 O
2(g) → 16 CO
2(g) + 18 H
2O(g) (ΔH = −5.51 MJ/mol of octane)
The number of various molecules in an oil sample can be determined by laboratory analysis. The molecules are typically extracted in a solvent, then separated in a gas chromatograph, and finally determined with a suitable detector, such as a flame ionization detector or a mass spectrometer.[72] Due to the large number of co-eluted hydrocarbons within oil, many cannot be resolved by traditional gas chromatography and typically appear as a hump in the chromatogram. This Unresolved Complex Mixture (UCM) of hydrocarbons is particularly apparent when analysing weathered oils and extracts from tissues of organisms exposed to oil. Some of the component of oil will mix with water: the water associated fraction of the oil.
Incomplete combustion of petroleum or gasoline results in production of toxic byproducts. Too little oxygen during combustion results in the formation of carbon monoxide. Due to the high temperatures and high pressures involved, exhaust gases from gasoline combustion in car engines usually include nitrogen oxides which are responsible for creation of photochemical smog.
Empirical equations for thermal properties
Heat of combustion
At a constant volume, the heat of combustion of a petroleum product can be approximated as follows:
- ,

where is measured in calories per gram and is the specific gravity at 60 °F (16 °C).


Thermal conductivity
The thermal conductivity of petroleum based liquids can be modeled as follows:[73]

where is measured in BTU · °F−1hr−1ft−1 , is measured in °F and is degrees API gravity.


Specific heat
The specific heat of petroleum oils can be modeled as follows:[74]
- ,

where is measured in BTU/(lb °F), is the temperature in Fahrenheit and is the specific gravity at 60 °F (16 °C).

In units of kcal/(kg·°C), the formula is:
- ,

where the temperature is in Celsius and is the specific gravity at 15 °C.
Latent heat of vaporization
The latent heat of vaporization can be modeled under atmospheric conditions as follows:
- ,

where is measured in BTU/lb, is measured in °F and is the specific gravity at 60 °F (16 °C).

In units of kcal/kg, the formula is:
- ,

where the temperature is in Celsius and is the specific gravity at 15 °C.[75]
Formation
Fossil petroleum

Petroleum is a fossil fuel derived from ancient fossilized organic materials, such as zooplankton and algae.[78][79] Vast amounts of these remains settled to sea or lake bottoms where they were covered in stagnant water (water with no dissolved oxygen) or sediments such as mud and silt faster than they could decompose aerobically. Approximately 1 m below this sediment or water oxygen concentration was low, below 0.1 mg/l, and anoxic conditions existed. Temperatures also remained constant.[79]
As further layers settled to the sea or lake bed, intense heat and pressure built up in the lower regions. This process caused the organic matter to change, first into a waxy material known as kerogen, found in various oil shales around the world, and then with more heat into liquid and gaseous hydrocarbons via a process known as catagenesis. Formation of petroleum occurs from hydrocarbon pyrolysis in a variety of mainly endothermic reactions at high temperature or pressure, or both.[79][80] These phases are described in detail below.
- Anaerobic decay
In the absence of plentiful oxygen, aerobic bacteria were prevented from decaying the organic matter after it was buried under a layer of sediment or water. However, anaerobic bacteria were able to reduce sulfates and nitrates among the matter to H2S and N2 respectively by using the matter as a source for other reactants. Due to such anaerobic bacteria, at first this matter began to break apart mostly via hydrolysis: polysaccharides and proteins were hydrolyzed to simple sugars and amino acids respectively. These were further anaerobically oxidized at an accelerated rate by the enzymes of the bacteria: e.g., amino acids went through oxidative deamination to imino acids, which in turn reacted further to ammonia and α-keto acids. Monosaccharides in turn ultimately decayed to CO2 and methane. The anaerobic decay products of amino acids, monosaccharides, phenols and aldehydes combined to fulvic acids. Fats and waxes were not extensively hydrolyzed under these mild conditions.[79]
- Kerogen formation
Some phenolic compounds produced from previous reactions worked as bactericides and the actinomycetales order of bacteria also produced antibiotic compounds (e.g., streptomycin). Thus the action of anaerobic bacteria ceased at about 10 m below the water or sediment. The mixture at this depth contained fulvic acids, unreacted and partially reacted fats and waxes, slightly modified lignin, resins and other hydrocarbons.[79] As more layers of organic matter settled to the sea or lake bed, intense heat and pressure built up in the lower regions.[80] As a consequence, compounds of this mixture began to combine in poorly understood ways to kerogen. Combination happened in a similar fashion as phenol and formaldehyde molecules react to urea-formaldehyde resins, but kerogen formation occurred in a more complex manner due to a bigger variety of reactants. The total process of kerogen formation from the beginning of anaerobic decay is called diagenesis, a word that means a transformation of materials by dissolution and recombination of their constituents.[79]
- Transformation of kerogen into fossil fuels
Kerogen formation continued to the depth of about 1 km from the Earth's surface where temperatures may reach around 50 °C. Kerogen formation represents a halfway point between organic matter and fossil fuels: kerogen can be exposed to oxygen, oxidize and thus be lost or it could be buried deeper inside the Earth's crust and be subjected to conditions which allow it to slowly transform into fossil fuels like petroleum. The latter happened through catagenesis in which the reactions were mostly radical rearrangements of kerogen. These reactions took thousands to millions of years and no external reactants were involved. Due to radical nature of these reactions, kerogen reacted towards two classes of products: those with low H/C ratio (anthracene or products similar to it) and those with high H/C ratio (methane or products similar to it); i.e., carbon-rich or hydrogen-rich products. Because catagenesis was closed off from external reactants, the resulting composition of the fuel mixture was dependent on the composition of the kerogen via reaction stoichiometry. 3 main types of kerogen exist: type I (algal), II (liptinic) and III (humic), which were formed mainly from algae, plankton and woody plants (this term includes trees, shrubs and lianas) respectively.[79]
Catagenesis was pyrolytic despite of the fact that it happened at relatively low temperatures (when compared to commercial pyrolysis plants) of 60 to several hundred °C. Pyrolysis was possible because of the long reaction times involved. Heat for catagenesis came from the decomposition of radioactive materials of the crust, especially 40K, 232Th, 235U and 238U. The heat varied with geothermal gradient and was typically 10-30 °C per km of depth from the Earth's surface. Unusual magma intrusions, however, could have created greater localized heating.[79]
Geologists often refer to the temperature range in which oil forms as an "oil window".[81][79] Below the minimum temperature oil remains trapped in the form of kerogen. Above the maximum temperature the oil is converted to natural gas through the process of thermal cracking. Sometimes, oil formed at extreme depths may migrate and become trapped at a much shallower level. The Athabasca Oil Sands are one example of this.[79]
Abiogenic petroleum
An alternative mechanism to the one described above was proposed by Russian scientists in the mid-1850s, the hypothesis of abiogenic petroleum origin (petroleum formed by inorganic means), but this is contradicted by geological and geochemical evidence.[82] Abiogenic sources of oil have been found, but never in commercially profitable amounts. "The controversy isn't over whether abiogenic oil reserves exist," said Larry Nation of the American Association of Petroleum Geologists. "The controversy is over how much they contribute to Earth's overall reserves and how much time and effort geologists should devote to seeking them out."[83]
Reservoirs
.svg.png)
Three conditions must be present for oil reservoirs to form:
- a source rock rich in hydrocarbon material buried deeply enough for subterranean heat to cook it into oil,
- a porous and permeable reservoir rock where it can accumulate,
- a caprock (seal) or other mechanism to prevent the oil from escaping to the surface. Within these reservoirs, fluids will typically organize themselves like a three-layer cake with a layer of water below the oil layer and a layer of gas above it, although the different layers vary in size between reservoirs. Because most hydrocarbons are less dense than rock or water, they often migrate upward through adjacent rock layers until either reaching the surface or becoming trapped within porous rocks (known as reservoirs) by impermeable rocks above. However, the process is influenced by underground water flows, causing oil to migrate hundreds of kilometres horizontally or even short distances downward before becoming trapped in a reservoir. When hydrocarbons are concentrated in a trap, an oil field forms, from which the liquid can be extracted by drilling and pumping.
The reactions that produce oil and natural gas are often modeled as first order breakdown reactions, where hydrocarbons are broken down to oil and natural gas by a set of parallel reactions, and oil eventually breaks down to natural gas by another set of reactions. The latter set is regularly used in petrochemical plants and oil refineries.
Wells are drilled into oil reservoirs to extract the crude oil. "Natural lift" production methods that rely on the natural reservoir pressure to force the oil to the surface are usually sufficient for a while after reservoirs are first tapped. In some reservoirs, such as in the Middle East, the natural pressure is sufficient over a long time. The natural pressure in most reservoirs, however, eventually dissipates. Then the oil must be extracted using "artificial lift" means. Over time, these "primary" methods become less effective and "secondary" production methods may be used. A common secondary method is "waterflood" or injection of water into the reservoir to increase pressure and force the oil to the drilled shaft or "wellbore." Eventually "tertiary" or "enhanced" oil recovery methods may be used to increase the oil's flow characteristics by injecting steam, carbon dioxide and other gases or chemicals into the reservoir. In the United States, primary production methods account for less than 40 percent of the oil produced on a daily basis, secondary methods account for about half, and tertiary recovery the remaining 10 percent. Extracting oil (or "bitumen") from oil/tar sand and oil shale deposits requires mining the sand or shale and heating it in a vessel or retort, or using "in-situ" methods of injecting heated liquids into the deposit and then pumping the liquid back out saturated with oil.
Unconventional oil reservoirs
Oil-eating bacteria biodegrade oil that has escaped to the surface. Oil sands are reservoirs of partially biodegraded oil still in the process of escaping and being biodegraded, but they contain so much migrating oil that, although most of it has escaped, vast amounts are still present—more than can be found in conventional oil reservoirs. The lighter fractions of the crude oil are destroyed first, resulting in reservoirs containing an extremely heavy form of crude oil, called crude bitumen in Canada, or extra-heavy crude oil in Venezuela. These two countries have the world's largest deposits of oil sands.
On the other hand, oil shales are source rocks that have not been exposed to heat or pressure long enough to convert their trapped hydrocarbons into crude oil. Technically speaking, oil shales are not always shales and do not contain oil, but are fined-grain sedimentary rocks containing an insoluble organic solid called kerogen. The kerogen in the rock can be converted into crude oil using heat and pressure to simulate natural processes. The method has been known for centuries and was patented in 1694 under British Crown Patent No. 330 covering, "A way to extract and make great quantities of pitch, tar, and oil out of a sort of stone." Although oil shales are found in many countries, the United States has the world's largest deposits.[84]
Classification
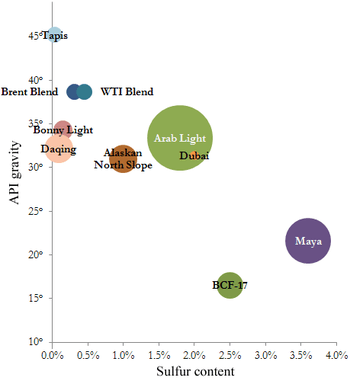
The petroleum industry generally classifies crude oil by the geographic location it is produced in (e.g., West Texas Intermediate, Brent, or Oman), its API gravity (an oil industry measure of density), and its sulfur content. Crude oil may be considered light if it has low density or heavy if it has high density; and it may be referred to as sweet if it contains relatively little sulfur or sour if it contains substantial amounts of sulfur.
The geographic location is important because it affects transportation costs to the refinery. Light crude oil is more desirable than heavy oil since it produces a higher yield of gasoline, while sweet oil commands a higher price than sour oil because it has fewer environmental problems and requires less refining to meet sulfur standards imposed on fuels in consuming countries. Each crude oil has unique molecular characteristics which are revealed by the use of Crude oil assay analysis in petroleum laboratories.[85]
Barrels from an area in which the crude oil's molecular characteristics have been determined and the oil has been classified are used as pricing references throughout the world. Some of the common reference crudes are:
- West Texas Intermediate (WTI), a very high-quality, sweet, light oil delivered at Cushing, Oklahoma for North American oil
- Brent Blend, consisting of 15 oils from fields in the Brent and Ninian systems in the East Shetland Basin of the North Sea. The oil is landed at Sullom Voe terminal in Shetland. Oil production from Europe, Africa and Middle Eastern oil flowing West tends to be priced off this oil, which forms a benchmark
- Dubai-Oman, used as benchmark for Middle East sour crude oil flowing to the Asia-Pacific region
- Tapis (from Malaysia, used as a reference for light Far East oil)
- Minas (from Indonesia, used as a reference for heavy Far East oil)
- The OPEC Reference Basket, a weighted average of oil blends from various OPEC (The Organization of the Petroleum Exporting Countries) countries
- Midway Sunset Heavy, by which heavy oil in California is priced[86]
- Western Canadian Select the benchmark crude oil for emerging heavy, high TAN (acidic) crudes.[87]
There are declining amounts of these benchmark oils being produced each year, so other oils are more commonly what is actually delivered. While the reference price may be for West Texas Intermediate delivered at Cushing, the actual oil being traded may be a discounted Canadian heavy oil—Western Canadian Select—delivered at Hardisty, Alberta, and for a Brent Blend delivered at Shetland, it may be a discounted Russian Export Blend delivered at the port of Primorsk.[88]
Industry
The petroleum industry is involved in the global processes of exploration, extraction, refining, transporting (often with oil tankers and pipelines), and marketing petroleum products. The largest volume products of the industry are fuel oil and gasoline. Petroleum is also the raw material for many chemical products, including pharmaceuticals, solvents, fertilizers, pesticides, and plastics. The industry is usually divided into three major components: upstream, midstream and downstream. Midstream operations are usually included in the downstream category.
Petroleum is vital to many industries, and is of importance to the maintenance of industrialized civilization itself, and thus is a critical concern to many nations. Oil accounts for a large percentage of the world's energy consumption, ranging from a low of 32 percent for Europe and Asia, up to a high of 53 percent for the Middle East, South and Central America (44%), Africa (41%), and North America (40%). The world at large consumes 30 billion barrels (4.8 km3) of oil per year, and the top oil consumers largely consist of developed nations. In fact, 24 percent of the oil consumed in 2004 went to the United States alone,[90] though by 2007 this had dropped to 21 percent of world oil consumed.[91]
In the US, in the states of Arizona, California, Hawaii, Nevada, Oregon and Washington, the Western States Petroleum Association (WSPA) represents companies responsible for producing, distributing, refining, transporting and marketing petroleum. This non-profit trade association was founded in 1907, and is the oldest petroleum trade association in the United States.[92]
Shipping
In the 1950s, shipping costs made up 33 percent of the price of oil transported from the Persian Gulf to the United States,[93] but due to the development of supertankers in the 1970s, the cost of shipping dropped to only 5 percent of the price of Persian oil in the US.[93] Due to the increase of the value of the crude oil during the last 30 years, the share of the shipping cost on the final cost of the delivered commodity was less than 3% in 2010. For example, in 2010 the shipping cost from the Persian Gulf to the US was in the range of 20 $/t and the cost of the delivered crude oil around 800 $/t.
Price
After the collapse of the OPEC-administered pricing system in 1985, and a short-lived experiment with netback pricing, oil-exporting countries adopted a market-linked pricing mechanism. First adopted by PEMEX in 1986, market-linked pricing was widely accepted, and by 1988 became and still is the main method for pricing crude oil in international trade. The current reference, or pricing markers, are Brent, WTI, and Dubai/Oman.[94] Other important market is in Shanghai, because of high consumption in China(rising in XXI century). It is also uncommon, because it shifted trading from USD to RMB.[95]
Uses
The chemical structure of petroleum is heterogeneous, composed of hydrocarbon chains of different lengths. Because of this, petroleum may be taken to oil refineries and the hydrocarbon chemicals separated by distillation and treated by other chemical processes, to be used for a variety of purposes. The total cost per plant is about 9 billion dollars.
Fuels
The most common distillation fractions of petroleum are fuels. Fuels include (by increasing boiling temperature range):[61]
| Fraction | Boiling range oC |
|---|---|
| Liquefied petroleum gas (LPG) | −40 |
| Butane | −12 to −1 |
| Gasoline/Petrol | −1 to 110 |
| Jet fuel | 150 to 205 |
| Kerosene | 205 to 260 |
| Fuel oil | 205 to 290 |
| Diesel fuel | 260 to 315 |
Petroleum classification according to chemical composition.[96]
| Class of petroleum | Composition of 250–300 °C fraction, wt. % | ||||
|---|---|---|---|---|---|
| Par. | Napth | Arom. | Wax | Asph. | |
| Paraffinic | 46–61 | 22–32 | 12–25 | 1.5–10 | 0–6 |
| Paraffinic-naphtenic | 42–45 | 38–39 | 16–20 | 1–6 | 0–6 |
| Naphthenic | 15–26 | 61–76 | 8–13 | Trace | 0–6 |
| Paraffinic-naphtenic-aromatic | 27–35 | 36–47 | 26–33 | 0.5–1 | 0–10 |
| Aromatic | 0–8 | 57–78 | 20–25 | 0–0.5 | 0–20 |
Other derivatives
Certain types of resultant hydrocarbons may be mixed with other non-hydrocarbons, to create other end products:
- Alkenes (olefins), which can be manufactured into plastics or other compounds
- Lubricants (produces light machine oils, motor oils, and greases, adding viscosity stabilizers as required)
- Wax, used in the packaging of frozen foods, among others
- Sulfur or sulfuric acid. These are useful industrial materials. Sulfuric acid is usually prepared as the acid precursor oleum, a byproduct of sulfur removal from fuels.
- Bulk tar
- Asphalt
- Petroleum coke, used in speciality carbon products or as solid fuel
- Paraffin wax
- Aromatic petrochemicals to be used as precursors in other chemical production
Agriculture
Since the 1940s, agricultural productivity has increased dramatically, due largely to the increased use of energy-intensive mechanization, fertilizers and pesticides.
Use by country
Consumption statistics
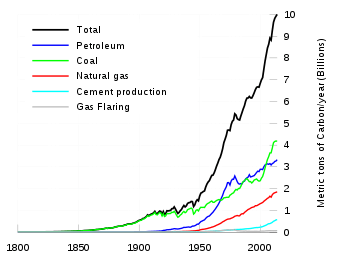 Global fossil carbon emissions, an indicator of consumption, from 1800.TotalOil
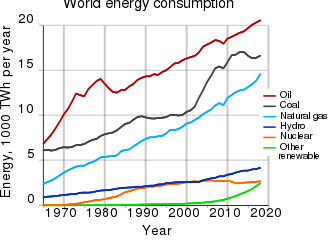 Rate of world energy usage per year from 1970.[97]
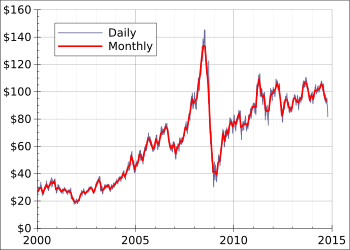
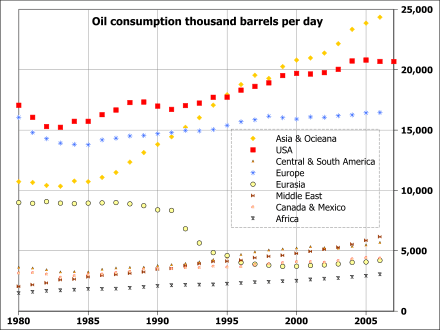
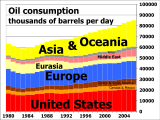 Daily oil consumption from 1980 to 2006.
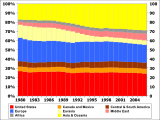
 Oil consumption 1980 to 2007 by region.
Consumption
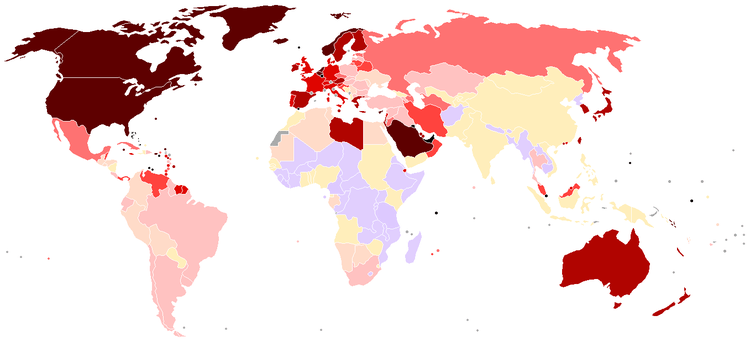
According to the US Energy Information Administration (EIA) estimate for 2011, the world consumes 87.421 million barrels of oil each day.
|
> 0.07 0.07–0.05 0.05–0.035 0.035–0.025 0.025–0.02 |
0.02–0.015 0.015–0.01 0.01–0.005 0.005–0.0015 < 0.0015 |
This table orders the amount of petroleum consumed in 2011 in thousand barrels (1000 bbl) per day and in thousand cubic metres (1000 m3) per day:[98][99]
| Consuming nation 2011 | (1000 bbl/ day) |
(1000 m3/ day) |
Population in millions |
bbl/year per capita |
m3/year per capita |
National production/ consumption |
|---|---|---|---|---|---|---|
| United States 1 | 18,835.5 | 2,994.6 | 314 | 21.8 | 3.47 | 0.51 |
| China | 9,790.0 | 1,556.5 | 1345 | 2.7 | 0.43 | 0.41 |
| Japan 2 | 4,464.1 | 709.7 | 127 | 12.8 | 2.04 | 0.03 |
| India 2 | 3,292.2 | 523.4 | 1198 | 1 | 0.16 | 0.26 |
| Russia 1 | 3,145.1 | 500.0 | 140 | 8.1 | 1.29 | 3.35 |
| Saudi Arabia (OPEC) | 2,817.5 | 447.9 | 27 | 40 | 6.4 | 3.64 |
| Brazil | 2,594.2 | 412.4 | 193 | 4.9 | 0.78 | 0.99 |
| Germany 2 | 2,400.1 | 381.6 | 82 | 10.7 | 1.70 | 0.06 |
| Canada | 2,259.1 | 359.2 | 33 | 24.6 | 3.91 | 1.54 |
| South Korea 2 | 2,230.2 | 354.6 | 48 | 16.8 | 2.67 | 0.02 |
| Mexico 1 | 2,132.7 | 339.1 | 109 | 7.1 | 1.13 | 1.39 |
| France 2 | 1,791.5 | 284.8 | 62 | 10.5 | 1.67 | 0.03 |
| Iran (OPEC) | 1,694.4 | 269.4 | 74 | 8.3 | 1.32 | 2.54 |
| United Kingdom 1 | 1,607.9 | 255.6 | 61 | 9.5 | 1.51 | 0.93 |
| Italy 2 | 1,453.6 | 231.1 | 60 | 8.9 | 1.41 | 0.10 |
Source: US Energy Information Administration
Population Data:[100]
1 peak production of oil already passed in this state
2 This country is not a major oil producer
Production
In petroleum industry parlance, production refers to the quantity of crude extracted from reserves, not the literal creation of the product.
| Country | Oil Production (bbl/day, 2016)[102] | |
|---|---|---|
| 1 | 10,551,497 | |
| 2 | 10,460,710 | |
| 3 | 8,875,817 | |
| 4 | 4,451,516 | |
| 5 | 3,990,956 | |
| 6 | 3,980,650 | |
| 7 | 3,662,694 | |
| 8 | 3,106,077 | |
| 9 | 2,923,825 | |
| 10 | 2,515,459 | |
| 11 | 2,276,967 | |
| 12 | 2,186,877 | |
| 13 | 1,999,885 | |
| 14 | 1,769,615 | |
| 15 | 1,647,975 | |
| 16 | 1,595,199 | |
| 17 | 1,522,902 | |
| 18 | 1,348,361 | |
| 19 | 1,006,841 | |
| 20 | 939,760 |
Exportation
In order of net exports in 2011, 2009 and 2006 in thousand bbl/d and thousand m3/d:
| # | Exporting nation | 103bbl/d (2011) | 103m3/d (2011) | 103bbl/d (2009) | 103m3/d (2009) | 103bbl/d (2006) | 103m3/d (2006) |
|---|---|---|---|---|---|---|---|
| 1 | Saudi Arabia (OPEC) | 8,336 | 1,325 | 7,322 | 1,164 | 8,651 | 1,376 |
| 2 | Russia 1 | 7,083 | 1,126 | 7,194 | 1,144 | 6,565 | 1,044 |
| 3 | Iran (OPEC) | 2,540 | 403 | 2,486 | 395 | 2,519 | 401 |
| 4 | United Arab Emirates (OPEC) | 2,524 | 401 | 2,303 | 366 | 2,515 | 400 |
| 5 | Kuwait (OPEC) | 2,343 | 373 | 2,124 | 338 | 2,150 | 342 |
| 6 | Nigeria (OPEC) | 2,257 | 359 | 1,939 | 308 | 2,146 | 341 |
| 7 | Iraq (OPEC) | 1,915 | 304 | 1,764 | 280 | 1,438 | 229 |
| 8 | Angola (OPEC) | 1,760 | 280 | 1,878 | 299 | 1,363 | 217 |
| 9 | Norway 1 | 1,752 | 279 | 2,132 | 339 | 2,542 | 404 |
| 10 | Venezuela (OPEC) 1 | 1,715 | 273 | 1,748 | 278 | 2,203 | 350 |
| 11 | Algeria (OPEC) 1 | 1,568 | 249 | 1,767 | 281 | 1,847 | 297 |
| 12 | Qatar (OPEC) | 1,468 | 233 | 1,066 | 169 | – | – |
| 13 | Canada 2 | 1,405 | 223 | 1,168 | 187 | 1,071 | 170 |
| 14 | Kazakhstan | 1,396 | 222 | 1,299 | 207 | 1,114 | 177 |
| 15 | Azerbaijan 1 | 836 | 133 | 912 | 145 | 532 | 85 |
| 16 | Trinidad and Tobago 1 | 177 | 112 | 167 | 160 | 155 | 199 |
Source: US Energy Information Administration
1 peak production already passed in this state
2 Canadian statistics are complicated by the fact it is both an importer and exporter of crude oil, and refines large amounts of oil for the U.S. market. It is the leading source of U.S. imports of oil and products, averaging 2,500,000 bbl/d (400,000 m3/d) in August 2007.[103]
Total world production/consumption (as of 2005) is approximately 84 million barrels per day (13,400,000 m3/d).
Importation

In order of net imports in 2011, 2009 and 2006 in thousand bbl/d and thousand m3/d:
| # | Importing nation | 103bbl/day (2011) | 103m3/day (2011) | 103bbl/day (2009) | 103m3/day (2009) | 103bbl/day (2006) | 103m3/day (2006) |
|---|---|---|---|---|---|---|---|
| 1 | United States 1 | 8,728 | 1,388 | 9,631 | 1,531 | 12,220 | 1,943 |
| 2 | China 2 | 5,487 | 872 | 4,328 | 688 | 3,438 | 547 |
| 3 | Japan | 4,329 | 688 | 4,235 | 673 | 5,097 | 810 |
| 4 | India | 2,349 | 373 | 2,233 | 355 | 1,687 | 268 |
| 5 | Germany | 2,235 | 355 | 2,323 | 369 | 2,483 | 395 |
| 6 | South Korea | 2,170 | 345 | 2,139 | 340 | 2,150 | 342 |
| 7 | France | 1,697 | 270 | 1,749 | 278 | 1,893 | 301 |
| 8 | Spain | 1,346 | 214 | 1,439 | 229 | 1,555 | 247 |
| 9 | Italy | 1,292 | 205 | 1,381 | 220 | 1,558 | 248 |
| 10 | Singapore | 1,172 | 186 | 916 | 146 | 787 | 125 |
| 11 | Republic of China (Taiwan) | 1,009 | 160 | 944 | 150 | 942 | 150 |
| 12 | Netherlands | 948 | 151 | 973 | 155 | 936 | 149 |
| 13 | Turkey | 650 | 103 | 650 | 103 | 576 | 92 |
| 14 | Belgium | 634 | 101 | 597 | 95 | 546 | 87 |
| 15 | Thailand | 592 | 94 | 538 | 86 | 606 | 96 |
Source: US Energy Information Administration
1 peak production of oil expected in 2020[104]
2 Major oil producer whose production is still increasing
Non-producing consumers
Countries whose oil production is 10% or less of their consumption.
| # | Consuming nation | (bbl/day) | (m3/day) |
|---|---|---|---|
| 1 | Japan | 5,578,000 | 886,831 |
| 2 | Germany | 2,677,000 | 425,609 |
| 3 | South Korea | 2,061,000 | 327,673 |
| 4 | France | 2,060,000 | 327,514 |
| 5 | Italy | 1,874,000 | 297,942 |
| 6 | Spain | 1,537,000 | 244,363 |
| 7 | Netherlands | 946,700 | 150,513 |
| 8 | Turkey | 575,011 | 91,663 |
Source: CIA World Factbook
Environmental effects
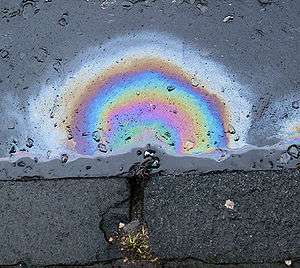
Because petroleum is a naturally occurring substance, its presence in the environment need not be the result of human causes such as accidents and routine activities (seismic exploration, drilling, extraction, refining and combustion). Phenomena such as seeps[105] and tar pits are examples of areas that petroleum affects without man's involvement. Regardless of source, petroleum's effects when released into the environment are similar.
Global warming
When burned, petroleum releases carbon dioxide, a greenhouse gas. Along with the burning of coal, petroleum combustion is the largest contributor to the increase in atmospheric CO2.[106][107] Atmospheric CO2 has risen over the last 150 years to current levels of over 415 ppmv,[108] from the 180–300 ppmv of the prior 800 thousand years.[109][110][111] This rise in temperature has reduced the minimum Arctic ice pack to 4,320,000 km2 (1,670,000 sq mi), a loss of almost half since satellite measurements started in 1979.[112][113] Because of this melt, more oil reserves have been revealed. About 13 percent of the world's undiscovered oil resides in the Arctic.[114]
Ocean acidification
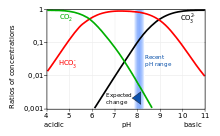
Ocean acidification is the increase in the acidity of the Earth's oceans caused by the uptake of carbon dioxide (CO
2) from the atmosphere. This increase in acidity inhibits all marine life—having a greater impact on smaller organisms as well as shelled organisms (see scallops).[115]
Extraction
Oil extraction is simply the removal of oil from the reservoir (oil pool). Oil is often recovered as a water-in-oil emulsion, and specialty chemicals called demulsifiers are used to separate the oil from water. Oil extraction is costly and sometimes environmentally damaging. Offshore exploration and extraction of oil disturbs the surrounding marine environment.[116]
Oil spills
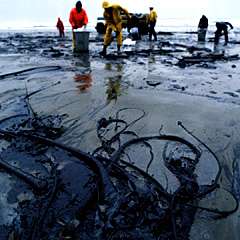

Crude oil and refined fuel spills from tanker ship accidents have damaged natural ecosystems in Alaska, the Gulf of Mexico, the Galápagos Islands, France and many other places.
The quantity of oil spilled during accidents has ranged from a few hundred tons to several hundred thousand tons (e.g., Deepwater Horizon oil spill, SS Atlantic Empress, Amoco Cadiz). Smaller spills have already proven to have a great impact on ecosystems, such as the Exxon Valdez oil spill.
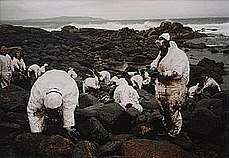
Oil spills at sea are generally much more damaging than those on land, since they can spread for hundreds of nautical miles in a thin oil slick which can cover beaches with a thin coating of oil. This can kill sea birds, mammals, shellfish and other organisms it coats. Oil spills on land are more readily containable if a makeshift earth dam can be rapidly bulldozed around the spill site before most of the oil escapes, and land animals can avoid the oil more easily.
Control of oil spills is difficult, requires ad hoc methods, and often a large amount of manpower. The dropping of bombs and incendiary devices from aircraft on the SS Torrey Canyon wreck produced poor results;[117] modern techniques would include pumping the oil from the wreck, like in the Prestige oil spill or the Erika oil spill.[118]
Though crude oil is predominantly composed of various hydrocarbons, certain nitrogen heterocyclic compounds, such as pyridine, picoline, and quinoline are reported as contaminants associated with crude oil, as well as facilities processing oil shale or coal, and have also been found at legacy wood treatment sites. These compounds have a very high water solubility, and thus tend to dissolve and move with water. Certain naturally occurring bacteria, such as Micrococcus, Arthrobacter, and Rhodococcus have been shown to degrade these contaminants.[119]
Tarballs
A tarball is a blob of crude oil (not to be confused with tar, which is a man-made product derived from pine trees or refined from petroleum) which has been weathered after floating in the ocean. Tarballs are an aquatic pollutant in most environments, although they can occur naturally, for example in the Santa Barbara Channel of California[120][121] or in the Gulf of Mexico off Texas.[122] Their concentration and features have been used to assess the extent of oil spills. Their composition can be used to identify their sources of origin,[123][124] and tarballs themselves may be dispersed over long distances by deep sea currents.[121] They are slowly decomposed by bacteria, including Chromobacterium violaceum, Cladosporium resinae, Bacillus submarinus, Micrococcus varians, Pseudomonas aeruginosa, Candida marina and Saccharomyces estuari.[120]
Whales
James S. Robbins has argued that the advent of petroleum-refined kerosene saved some species of great whales from extinction by providing an inexpensive substitute for whale oil, thus eliminating the economic imperative for open-boat whaling.[125]
Alternatives
In the United States in 2007 about 70 percent of petroleum was used for transportation (e.g. gasoline, diesel, jet fuel), 24 percent by industry (e.g. production of plastics), 5 percent for residential and commercial uses, and 2 percent for electricity production.[126] Outside of the US, a higher proportion of petroleum tends to be used for electricity.[127]
Vehicle fuels
Petroleum-based vehicle fuels can be replaced by either alternative fuels, or other methods of propulsion such as electric or nuclear.

Alternative fuel vehicles refers to both:
- Vehicles that use alternative fuels used in standard or modified internal combustion engines such as natural gas vehicles, neat ethanol vehicles, flexible-fuel vehicles, biodiesel-powered vehicles, propane autogas, and hydrogen vehicles.
- Vehicles with advanced propulsion systems that reduce or substitute petroleum use such as battery electric vehicles, plug-in hybrid electric vehicles, hybrid electric vehicles, and hydrogen fuel cell vehicles.
Industrial oils
Biological feedstocks do exist for industrial uses such as Bioplastic production.[128]
Electricity
In oil producing countries with little refinery capacity, oil is sometimes burned to produce electricity. Renewable energy technologies such as solar power, wind power, micro hydro, biomass and biofuels are used, but the primary alternatives remain large-scale hydroelectricity, nuclear and coal-fired generation.
Future production
Consumption in the twentieth and twenty-first centuries has been abundantly pushed by automobile sector growth. The 1985–2003 oil glut even fueled the sales of low fuel economy vehicles in OECD countries. The 2008 economic crisis seems to have had some impact on the sales of such vehicles; still, in 2008 oil consumption showed a small increase.
In 2016 Goldman Sachs predicted lower demand for oil due to emerging economies concerns, especially China.[129] The BRICS (Brasil, Russia, India, China, South Africa) countries might also kick in, as China briefly was the first automobile market in December 2009.[130] The immediate outlook still hints upwards. In the long term, uncertainties linger; the OPEC believes that the OECD countries will push low consumption policies at some point in the future; when that happens, it will definitely curb oil sales, and both OPEC and the Energy Information Administration (EIA) kept lowering their 2020 consumption estimates during the past five years.[131] A detailed review of International Energy Agency oil projections have revealed that revisions of world oil production, price and investments have been motivated by a combination of demand and supply factors.[132] All together, Non-OPEC conventional projections have been fairly stable the last 15 years, while downward revisions were mainly allocated to OPEC. Recent upward revisions are primarily a result of US tight oil.
Production will also face an increasingly complex situation; while OPEC countries still have large reserves at low production prices, newly found reservoirs often lead to higher prices; offshore giants such as Tupi, Guara and Tiber demand high investments and ever-increasing technological abilities. Subsalt reservoirs such as Tupi were unknown in the twentieth century, mainly because the industry was unable to probe them. Enhanced Oil Recovery (EOR) techniques (example: DaQing, China[133]) will continue to play a major role in increasing the world's recoverable oil.
The expected availability of petroleum resources has always been around 35 years or even less since the start of the modern exploration. The oil constant, an insider pun in the German industry, refers to that effect.[134]
A growing number of divestment campaigns from major funds pushed by newer generations who question the sustainability of petroleum may hinder the financing of future oil prospection and production.
Peak oil
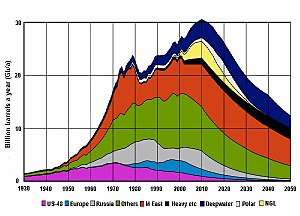
Peak oil is a term applied to the projection that future petroleum production (whether for individual oil wells, entire oil fields, whole countries, or worldwide production) will eventually peak and then decline at a similar rate to the rate of increase before the peak as these reserves are exhausted. The peak of oil discoveries was in 1965, and oil production per year has surpassed oil discoveries every year since 1980.[135] However, this does not mean that potential oil production has surpassed oil demand.
Hubbert applied his theory to accurately predict the peak of U.S. conventional oil production at a date between 1966 and 1970. This prediction was based on data available at the time of his publication in 1956. In the same paper, Hubbert predicts world peak oil in "half a century" after his publication, which would be 2006.[136]
It is difficult to predict the oil peak in any given region, due to the lack of knowledge and/or transparency in accounting of global oil reserves.[137] Based on available production data, proponents have previously predicted the peak for the world to be in years 1989, 1995, or 1995–2000. Some of these predictions date from before the recession of the early 1980s, and the consequent reduction in global consumption, the effect of which was to delay the date of any peak by several years. Just as the 1971 U.S. peak in oil production was only clearly recognized after the fact, a peak in world production will be difficult to discern until production clearly drops off.[138] The peak is also a moving target as it is now measured as "liquids", which includes synthetic fuels, instead of just conventional oil.[139]
The International Energy Agency (IEA) said in 2010 that production of conventional crude oil had peaked in 2006 at 70 MBBL/d, then flattened at 68 or 69 thereafter.[140][141] Since virtually all economic sectors rely heavily on petroleum, peak oil, if it were to occur, could lead to a "partial or complete failure of markets".[142] In the mid-2000s, widespread fears of an imminent peak led to the "peak oil movement," in which over one hundred thousand Americans prepared, individually and collectively, for the "post-carbon" future.[143]
While there has been much focus historically on peak oil supply, focus is increasingly shifting to peak demand as more countries seek to transition to renewable energy. The GeGaLo index of geopolitical gains and losses assesses how the geopolitical position of 156 countries may change if the world fully transitions to renewable energy resources. Former oil exporters are expected to lose power, while the positions of former oil importers and countries rich in renewable energy resources is expected to strengthen.[144]
Unconventional oil
Unconventional oil is petroleum produced or extracted using techniques other than the conventional methods.[145][146] The calculus for peak oil has changed with the introduction of unconventional production methods. In particular, the combination of horizontal drilling and hydraulic fracturing has resulted in a significant increase in production from previously uneconomic plays.[147] Analysts expected that $150 billion would be spent on further developing North American tight oil fields in 2015. The large increase in tight oil production is one of the reasons behind the price drop in late 2014.[148] Certain rock strata contain hydrocarbons but have low permeability and are not thick from a vertical perspective. Conventional vertical wells would be unable to economically retrieve these hydrocarbons. Horizontal drilling, extending horizontally through the strata, permits the well to access a much greater volume of the strata. Hydraulic fracturing creates greater permeability and increases hydrocarbon flow to the wellbore.
See also
Notes
- "EIA Energy Kids – Oil (petroleum)". www.eia.gov. Archived from the original on July 7, 2017. Retrieved March 18, 2018.
- Guerriero V, et al. (2012). "A permeability model for naturally fractured carbonate reservoirs". Marine and Petroleum Geology. 40: 115–134. doi:10.1016/j.marpetgeo.2012.11.002.
- Guerriero V, et al. (2011). "Improved statistical multi-scale analysis of fractures in carbonate reservoir analogues". Tectonophysics. 504 (1): 14–24. Bibcode:2011Tectp.504...14G. doi:10.1016/j.tecto.2011.01.003.
- "Organic Hydrocarbons: Compounds made from carbon and hydrogen". Archived from the original on July 19, 2011.
- "Libyan tremors threaten to rattle the oil world". The Hindu. Chennai, India. March 1, 2011. Archived from the original on March 6, 2011.
- Intergovernmental Panel on Climate Change. "Climate Change 2014 Synthesis Report." p. 56 (https://ar5-syr.ipcc.ch/ipcc/ipcc/resources/pdf/IPCC_SynthesisReport.pdf)
- "petroleum", in the American Heritage Dictionary
- Medieval Latin: literally, rock oil = Latin petr(a) rock (< Greek pétra) + oleum oil http://www.thefreedictionary.com/petroleum
- Bauer (1546)
-

- Zhiguo, Gao (1998). Environmental regulation of oil and gas. London: Kluwer Law International. p. 8. ISBN 978-90-411-0726-8. OCLC 39313498.
- Deng, Yinke (2011). Ancient Chinese Inventions. p. 40. ISBN 978-0-521-18692-6.
- Burke, Michael (2008). Nanotechnology: The Business. p. 3. ISBN 978-1-4200-5399-9.
- Totten, George E. "ASTM International – Standards Worldwide". www.astm.org. Archived from the original on July 6, 2017. Retrieved March 18, 2018.
- Dalvi, Samir (2015). Fundamentals of Oil & Gas Industry for Beginners. ISBN 978-93-5206-419-9.
- Forbes, Robert James (1958). Studies in Early Petroleum History. Brill Publishers. p. 149.
- Salim Al-Hassani (2008). "1000 Years of Missing Industrial History". In Emilia Calvo Labarta; Mercè Comes Maymo; Roser Puig Aguilar; Mònica Rius Pinies (eds.). A shared legacy: Islamic science East and West. Edicions Universitat Barcelona. pp. 57–82 [63]. ISBN 978-84-475-3285-8.
- Joseph P. Riva Jr.; Gordon I. Atwater. "petroleum". Encyclopædia Britannica. Retrieved June 30, 2008.
- Istoria Romaniei, Vol II, p. 300, 1960
- Longmuir, Marilyn V. (2001). Oil in Burma : the extraction of "earth-oil" to 1914. Bangkok: White Lotus Press. p. 329. ISBN 978-974-7534-60-3. OCLC 48517638.
- "The oil wells of Alsace; a discovery made more than a century ago. What a Pennsylvania operator saw abroad – primitive methods of obtaining oil – the process similar to that used in coal mining" (PDF). New York Times. February 23, 1880.
- Erdöl in Wietze (1. Aufl ed.). Horb am Neckar: Geiger. 1994. ISBN 978-3-89264-910-6. OCLC 75489983.
- Karlsch, Rainer; Stokes, Raymond G. (2003). Faktor Öl : die Mineralölwirtschaft in Deutschland 1859–1974. Stokes, Raymond G. Munich: C.H. Beck. ISBN 978-3-406-50276-7. OCLC 52134361.
- Russell, Loris S. (2003). A Heritage of Light: Lamps and Lighting in the Early Canadian Home. University of Toronto Press. ISBN 978-0-8020-3765-7.
- info@undiscoveredscotland.co.uk, Undiscovered Scotland. "James Young: Biography on Undiscovered Scotland". www.undiscoveredscotland.co.uk. Archived from the original on June 29, 2017. Retrieved March 18, 2018.
- Frank, Alison Fleig (2005). Oil Empire: Visions of Prosperity in Austrian Galicia (Harvard Historical Studies). Harvard University Press. ISBN 978-0-674-01887-7.
- "Skansen Przemysłu Naftowego w Bóbrce / Museum of Oil Industry at Bobrka". May 19, 2007. Archived from the original on May 19, 2007. Retrieved March 18, 2018.
- Maugeri, Leonardo (2005). The age of oil : the mythology, history, and future of the world's most controversial resource (1st Lyons Press ed.). Guilford, CN: Lyons Press. p. 3. ISBN 978-1-59921-118-3. OCLC 212226551.
- Lucius, Robert von (June 23, 2009). "Deutsche Erdölförderung: Klein-Texas in der Lüneburger Heide". FAZ.NET (in German). ISSN 0174-4909. Archived from the original on January 26, 2017. Retrieved March 18, 2018.
- "Deutsches Erdölmuseum Wietze". www.erdoelmuseum.de. Archived from the original on October 14, 2017. Retrieved March 18, 2018.
- Vassiliou, Marius S. (2018). Historical dictionary of the petroleum industry, 2nd Edition. Lanham, MD: Rowman and Littlefield. p. 621. ISBN 978-1-5381-1159-8. OCLC 315479839.
- Matveichuk, Alexander A (2004). "Intersection of Oil Parallels: Historical Essays". Russian Oil and Gas Institute.
- McKain, David L.; Bernard, L. Allen (1994). Where It All Began: The Story of the People and Places Where the Oil Industry Began – West Virginia and South-eastern Ohio. Parkersburg, WV: D.L. McKain. ASIN B0006P93DY.
- "The History Of Romanian Oil Industry". rri.ro. Archived from the original on June 3, 2009.
- Thomas Eakins. "Scenes from Modern Life: World Events: 1844–1856". pbs.org. Archived from the original on July 5, 2017.
- Oil Museum of Canada, Black Gold: Canada's Oil Heritage, Oil Springs: Boom & Bust Archived July 29, 2013, at the Wayback Machine
- Turnbull Elford, Jean. "Canada West's Last Frontier". Lambton County Historical Society, 1982, p. 110
- "Oil Museum of Canada, Black Gold: Canada's Oil Heritage". lclmg.org. Archived from the original on July 29, 2013.
- May, Gary (1998). Hard oiler! : the story of Canadiansʼ quest for oil at home and abroad. Toronto: Dundurn Press. p. 43. ISBN 978-1-55002-316-9. OCLC 278980961.
- Ford, R.W. A (1988). History of the Chemical Industry in Lambton County. p. 5.
- Akiner(2004), p. 5
- Baldwin, Hanson. "Oil Strategy in World War II". oil150.com. American Petroleum Institute Quarterly – Centennial Issue. pp. 10–11. Archived from the original on August 15, 2009.
- Alakbarov, Farid. "10.2 An Overview – Baku: City that Oil Built". azer.com. Archived from the original on December 13, 2010. Retrieved March 18, 2018.
- Times, Chrisopher S. Wren Special to The New York (November 13, 1974). "Soviet Moves Ahead of U.S. in oil output". The New York Times. ISSN 0362-4331. Retrieved April 4, 2020.
- "US expected to surpass Saudi Arabia, Russia as world's top oil producer". Christian Science Monitor. July 12, 2018. ISSN 0882-7729. Retrieved April 5, 2020.
- Annual Energy Review. The Administration. 1990. p. 252.
- "The Arab Oil Threat". The New York Times. November 23, 1973.
- "The price of oil – in context". CBC News. April 18, 2006. Archived from the original on June 9, 2007.
- "EIA – Electricity Data". www.eia.gov. Archived from the original on July 10, 2017. Retrieved April 18, 2017.
- "Top Oil Producers and Consumers". InfoPlease. Archived from the original on April 25, 2017. Retrieved March 18, 2018.
- "US soon to leapfrog Saudis, Russia as top oil producer". www.abqjournal.com. The Associated Press. Retrieved October 6, 2018.
- "The United States is now the largest global crude oil producer". www.eia.gov. Today in Energy – U.S. Energy Information Administration (EIA). Retrieved October 6, 2018.
- "Canada's oil sands survive, but can't thrive in a $50 oil world". Reuters. October 18, 2017. Retrieved April 5, 2020.
- "Crude Oil Forecast | Canadian Association of Petroleum Producers". CAPP. Retrieved April 5, 2020.
- "IHS Markit: Canadian oil sands production to be ~1M barrels higher by 2030 but with lower annual growth; boosted by deterioration in Venezuela". Green Car Congress. Retrieved April 5, 2020.
- Norman, J. Hyne (2001). Nontechnical guide to petroleum geology, exploration, drilling, and production (2nd ed.). Tulsa, OK: Penn Well Corp. pp. 1–4. ISBN 978-0-87814-823-3. OCLC 49853640.
- Speight, James G. (2019). Heavy Oil Recovery and Upgrading. Elsevier. p. 13. ISBN 978-0-12-813025-4.
- "Condensate Gas – an overview | ScienceDirect Topics". www.sciencedirect.com. Retrieved April 6, 2020.
- Hilyard, Joseph (2012). The Oil & Gas Industry: A Nontechnical Guide. PennWell Books. p. 31. ISBN 978-1-59370-254-0.
- Ollivier, Bernard; Magot, Michel (2005). Petroleum Microbiology. Washington, DC: American Society of Microbiology. doi:10.1128/9781555817589. ISBN 978-1-55581-758-9.
- G., Speight, J. (1999). The chemistry and technology of petroleum (3rd ed., rev. and expanded ed.). New York: Marcel Dekker. pp. 215–216, 543. ISBN 978-0-8247-0217-5. OCLC 44958948.
- Alboudwarej; et al. (Summer 2006). "Highlighting Heavy Oil" (PDF). Oilfield Review. Archived from the original on April 11, 2012. Retrieved July 4, 2012. Cite journal requires
|journal=(help) - "Oil Sands – Glossary". Mines and Minerals Act. Government of Alberta. 2007. Archived from the original on November 1, 2007. Retrieved October 2, 2008.
- "Oil Sands in Canada and Venezuela". Infomine Inc. 2008. Archived from the original on December 19, 2008. Retrieved October 2, 2008.
- "Crude oil is made into different fuels". Eia.doe.gov. Archived from the original on August 23, 2009. Retrieved August 29, 2010.
- "EIA reserves estimates". Eia.doe.gov. Archived from the original on August 30, 2010. Retrieved August 29, 2010.
- "CERA report on total world oil". Cera.com. November 14, 2006. Archived from the original on November 25, 2010. Retrieved August 29, 2010.
- "Peak oil: Does it really matter?". Oil & Gas Middle East. Retrieved April 6, 2020.
- "Energy Alternatives and the Future of Oil and Gas in the Gulf". Al Jazeera Center for Studies. Retrieved April 6, 2020.
- "How long will world's oil reserves last? 53 years, says BP". Christian Science Monitor. July 14, 2014. ISSN 0882-7729. Retrieved April 6, 2020.
- "Heat of Combustion of Fuels". Webmo.net. Archived from the original on July 8, 2017. Retrieved August 29, 2010.
- Use of ozone depleting substances in laboratories Archived February 27, 2008, at the Wayback Machine. TemaNord 2003:516.
- Mansure, A.J. (1996). "SciTech Connect: Hot oiling spreadsheet". osti.gov. Albuquerque, NM: Sandia National Labs, Geothermal Research Dept. doi:10.2172/446318. OSTI 446318.
- Hydroprocessing of heavy oils and residua. Speight, James G., Ancheyta Juárez, Jorge. Boca Raton, FL: CRC Press. 2007. p. 25. ISBN 978-0-8493-7419-7. OCLC 76828908.CS1 maint: others (link)
- United States Bureau of Standards, "Thermal Properties of Petroleum Products". Miscellaneous Publication No. 97, November 9, 1929.
- Treibs, A.E. (1936). "Chlorophyll- und Häminderivate in organischen Mineralstoffen". Angew. Chem. 49 (38): 682–686. doi:10.1002/ange.19360493803.
- Kvenvolden, K.A. (2006). "Organic geochemistry – A retrospective of its first 70 years". Org. Geochem. 37: 1–11. doi:10.1016/j.orggeochem.2005.09.001.
- Kvenvolden, Keith A. (2006). "Organic geochemistry – A retrospective of its first 70 years". Organic Geochemistry. 37: 1–11. doi:10.1016/j.orggeochem.2005.09.001.
- Schobert, Harold H. (2013). Chemistry of fossil fuels and biofuels. Cambridge: Cambridge University Press. pp. 103–130. ISBN 978-0-521-11400-4. OCLC 795763460.
- Braun, R.L.; Burnham, A.K. (June 1993). "Chemical reaction model for oil and gas generation from type 1 and type 2 kerogen". Lawrence Livermore National Laboratory. doi:10.2172/10169154. Cite journal requires
|journal=(help) - Polar Prospects:A minerals treaty for Antarctica. United States, Office of Technology Assessment. 1989. p. 104. ISBN 978-1-4289-2232-7.
- Glasby, Geoffrey P (2006). "Abiogenic origin of hydrocarbons: an historical overview" (PDF). Resource Geology. 56 (1): 85–98. doi:10.1111/j.1751-3928.2006.tb00271.x. Retrieved January 29, 2008.
- "The Mysterious Origin and Supply of Oil". Live Science. Archived from the original on January 27, 2016.
- Lambertson, Giles (February 16, 2008). "Oil Shale: Ready to Unlock the Rock". Construction Equipment Guide. Archived from the original on July 11, 2017. Retrieved May 21, 2008.
- Rhodes, C. (2008). The oil question: Nature and prognosis. Science Progress, 91(4), 317-375. https://doi.org/10.3184/003685008X395201
- "Chevron Crude Oil Marketing – North America Posted Pricing – California". Crudemarketing.chevron.com. May 1, 2007. Archived from the original on June 7, 2010. Retrieved August 29, 2010.
- Natural Resources Canada (May 2011). Canadian Crude Oil, Natural Gas and Petroleum Products: Review of 2009 & Outlook to 2030 (PDF) (Report). Ottawa: Government of Canada. p. 9. ISBN 978-1100164366. Archived from the original (PDF) on October 3, 2013.
- "Light Sweet Crude Oil". About the Exchange. New York Mercantile Exchange (NYMEX). 2006. Archived from the original on March 14, 2008. Retrieved April 21, 2008.
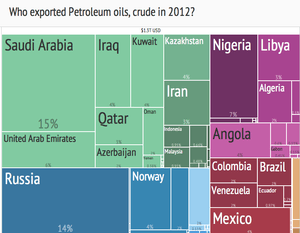
- "Who exported Petroleum oils, crude in 2012?". harvard.edu. The Atlas Of Economic Complexity. Archived from the original on July 24, 2014.
- "International Energy Annual 2004". Energy Information Administration. July 14, 2006. Archived from the original (XLS) on September 25, 2008.
- "Yearbook 2008 – crude oil". Energy data. Archived from the original on September 21, 2010.
- "About Us". Western States Petroleum Association. Archived from the original on June 16, 2008. Retrieved November 3, 2008.
- "A liquid market: Thanks to LNG, spare gas can now be sold the world over". The Economist. July 14, 2012. Archived from the original on June 14, 2014. Retrieved January 6, 2013.
- Oil in the 21st century : issues, challenges and opportunities. Mabro, Robert., Organization of Petroleum Exporting Countries. Oxford: Published by the Oxford University Press for the Organization of the Petroleum Exporting Countries. 2006. p. 351. ISBN 978-0-19-920738-1. OCLC 77082224.CS1 maint: others (link)
- "Shanghai crude futures eat into Western benchmarks as China pushes yuan". Reuters. August 30, 2018.
- Simanzhenkov, Vasily; Idem, Raphael (2003). Crude Oil Chemistry. CRC Press. p. 33. ISBN 978-0-203-01404-2. Retrieved November 10, 2014.
- BP: Statistical Review of World Energy Archived May 16, 2013, at the Wayback Machine, Workbook (xlsx), London, 2012
- U.S. Energy Information Administration. Excel file Archived October 6, 2008, at the Wayback Machine from this Archived November 10, 2008, at the Wayback Machine web page. Table Posted: March 1, 2010
- From DSW-Datareport 2008 ("Deutsche Stiftung Weltbevölkerung")
- "IBGE". Archived from the original on September 4, 2010. Retrieved August 29, 2010.
- "Crude oil including lease condensate production (Mb/d)". U.S. Energy Information Administration. Retrieved April 14, 2020.
- "Production of Crude Oil including Lease Condensate 2016" (CVS download). U.S. Energy Information Administration. Archived from the original on May 22, 2015. Retrieved May 30, 2017.
- "U.S. Imports by Country of Origin". U.S. Energy Information Administration. Archived from the original on January 3, 2018. Retrieved February 21, 2018.
- "AEO2014 Early Release Overview Archived December 20, 2013, at the Wayback Machine" Early report Archived December 20, 2013, at the Wayback Machine US Energy Information Administration, December 2013. Accessed: December 2013. Quote:"Domestic production of crude oil .. increases sharply .. is expected to level off and then slowly decline after 2020"
- "Archived copy". Archived from the original on August 20, 2008. Retrieved May 17, 2010.CS1 maint: archived copy as title (link) Natural Oil and Gas Seeps in California
- Marland, Gregg; Houghton, R. A.; Gillett, Nathan P.; Conway, Thomas J.; Ciais, Philippe; Buitenhuis, Erik T.; Field, Christopher B.; Raupach, Michael R.; Quéré, Corinne Le (November 20, 2007). "Contributions to accelerating atmospheric CO2 growth from economic activity, carbon intensity, and efficiency of natural sinks". Proceedings of the National Academy of Sciences. 104 (47): 18866–18870. Bibcode:2007PNAS..10418866C. doi:10.1073/pnas.0702737104. ISSN 0027-8424. PMC 2141868. PMID 17962418.
- Zheng, Bo; Zaehle, Sönke; Wright, Rebecca; Wiltshire, Andrew J.; Walker, Anthony P.; Viovy, Nicolas; Werf, Guido R. van der; Laan-Luijkx, Ingrid T. van der; Tubiello, Francesco N. (December 5, 2018). "Global Carbon Budget 2018". Earth System Science Data. 10 (4): 2141–2194. Bibcode:2018ESSD...10.2141L. doi:10.5194/essd-10-2141-2018. ISSN 1866-3508.
- US Department of Commerce, NOAA. "Global Monitoring Laboratory – Carbon Cycle Greenhouse Gases". www.esrl.noaa.gov. Retrieved May 24, 2020.
- Historical trends in carbon dioxide concentrations and temperature, on a geological and recent time scale Archived July 24, 2011, at the Wayback Machine. (June 2007). In UNEP/GRID-Arendal Maps and Graphics Library. Retrieved 19:14, February 19, 2011.
- Deep ice tells long climate story Archived August 30, 2007, at the Wayback Machine. Retrieved 19:14, February 19, 2011.
- Mitchell, John F.B. (1989). "The "Greenhouse" Effect and Climate Change". Reviews of Geophysics. 27 (1): 115–139. Bibcode:1989RvGeo..27..115M. CiteSeerX 10.1.1.459.471. doi:10.1029/RG027i001p00115. Archived from the original on September 4, 2008.
- Change, NASA Global Climate. "Arctic Sea Ice Minimum". Climate Change: Vital Signs of the Planet. Retrieved May 24, 2020.
- McKibbin, Bill. Eaarth: Making a Life on a Tough New Planet. New York: Times, 2010 ISBN 978-0-312-54119-4
- Gautier, D.L.; Bird, K.J.; Charpentier, R.R.; Grantz, A.; Houseknecht, D.W.; Klett, T.R.; Moore, T.E.; Pitman, J.K.; Schenk, C.J.; Schuenemeyer, J.H.; Sorensen, K.; Tennyson, M.E.; Valin, Z.C.; Wandrey, C.J. (2009). "Assessment of Undiscovered Oil and Gas in the Arctic". Science. 324 (5931): 1175–1179. Bibcode:2009Sci...324.1175G. doi:10.1126/science.1169467. ISSN 0036-8075. PMID 19478178.
- "Acidic ocean deadly for Vancouver Island scallop industry". cbc.ca. February 26, 2014. Archived from the original on April 27, 2014.
- Waste discharges during the offshore oil and gas activity Archived September 26, 2009, at the Wayback Machine by Stanislave Patin, tr. Elena Cascio
- Torrey Canyon bombing by the Navy and RAF
- "Pumping of the Erika cargo". Total.com. Archived from the original on November 19, 2008. Retrieved August 29, 2010.
- Sims, Gerald K.; O'Loughlin, Edward J.; Crawford, Ronald L. (1989). "Degradation of pyridines in the environment". Critical Reviews in Environmental Control. 19 (4): 309–340. doi:10.1080/10643388909388372.
- Itah A.Y. and Essien J.P. (October 2005). "Growth Profile and Hydrocarbonoclastic Potential of Microorganisms Isolated from Tarballs in the Bight of Bonny, Nigeria". World Journal of Microbiology and Biotechnology. 21 (6–7): 1317–1322. doi:10.1007/s11274-004-6694-z.CS1 maint: uses authors parameter (link)
- Hostettler, Frances D.; Rosenbauer, Robert J.; Lorenson, Thomas D.; Dougherty, Jennifer (2004). "Geochemical characterization of tarballs on beaches along the California coast. Part I – Shallow seepage impacting the Santa Barbara Channel Islands, Santa Cruz, Santa Rosa and San Miguel". Organic Geochemistry. 35 (6): 725–746. doi:10.1016/j.orggeochem.2004.01.022.
- Drew Jubera (August 1987). "Texas Primer: The Tar Ball". Texas Monthly. Archived from the original on July 7, 2015. Retrieved October 20, 2014.
- Knap Anthony H, Burns Kathryn A, Dawson Rodger, Ehrhardt Manfred, and Palmork Karsten H (December 1984). "Dissolved/dispersed hydrocarbons, tarballs and the surface microlayer: Experiences from an IOC/UNEP Workshop in Bermuda". Marine Pollution Bulletin. 17 (7): 313–319. doi:10.1016/0025-326X(86)90217-1.CS1 maint: uses authors parameter (link)
- Wang, Zhendi; Fingas, Merv; Landriault, Michael; Sigouin, Lise; Castle, Bill; Hostetter, David; Zhang, Dachung; Spencer, Brad (July 1998). "Identification and Linkage of Tarballs from the Coasts of Vancouver Island and Northern California Using GC/MS and Isotopic Techniques". Journal of High Resolution Chromatography. 21 (7): 383–395. doi:10.1002/(SICI)1521-4168(19980701)21:7<383::AID-JHRC383>3.0.CO;2-3.
- How Capitalism Saved the Whales Archived March 15, 2012, at the Wayback Machine by James S. Robbins, The Freeman, August, 1992.
- "U.S. Primary Energy Consumption by Source and Sector, 2007" Archived May 6, 2010, at the Wayback Machine. Energy Information Administration
- Shrestha, Ram M. (September 13, 2006). "Power Sector Development and Environmental Emissions in Selected South Asian Countries" (PDF).
- Bioprocessing Archived July 23, 2008, at the Wayback Machine Seattle Times (2003)
- Hume, Neil (March 8, 2016). "Goldman Sachs says commodity rally is unlikely to last". Financial Times. ISSN 0307-1766. Retrieved March 8, 2016.
- Chris Hogg (February 10, 2009). "China's car industry overtakes US". BBC News. Archived from the original on October 19, 2011.
- OPEC Secretariat (2008). "World Oil Outlook 2008" (PDF). Archived from the original (PDF) on April 7, 2009.
- Wachtmeister, Henrik; Henke, Petter; Höök, Mikael (2018). "Oil projections in retrospect: Revisions, accuracy and current uncertainty". Applied Energy. 220: 138–153. doi:10.1016/j.apenergy.2018.03.013.
- Ni Weiling (October 16, 2006). "Daqing Oilfield rejuvenated by virtue of technology". Archived from the original on December 12, 2011.
- Samuel Schubert, Peter Slominski UTB, 2010: Die Energiepolitik der EU Johannes Pollak, 235 Seiten, p. 20
- Campbell CJ (December 2000). "Peak Oil Presentation at the Technical University of Clausthal". Archived from the original on July 5, 2007.
- Hubbert, Marion King; Shell Development Company (1956). "Nuclear energy and the fossil fuels" (PDF). Drilling and Production Practice. 95. Archived from the original (PDF) on May 27, 2008.
- "New study raises doubts about Saudi oil reserves". Iags.org. March 31, 2004. Archived from the original on May 29, 2010. Retrieved August 29, 2010.
- Peak Oil Info and Strategies Archived June 17, 2012, at the Wayback Machine "The only uncertainty about peak oil is the time scale, which is difficult to predict accurately."
- "Peak Oil": The Eventual End of the Oil Age Archived May 26, 2012, at the Wayback Machine p. 12
- "Is 'Peak Oil' Behind Us? Archived November 17, 2010, at the Wayback Machine". The New York Times. November 14, 2010
- "Has the World Already Passed "Peak Oil"? Archived August 12, 2014, at the Wayback Machine". National Geographic News. November 9, 2010
- "Military Study Warns of a Potentially Drastic Oil Crisis Archived May 18, 2012, at the Wayback Machine". Spiegel Online. September 1, 2010.
- Schneider-Mayerson Matthew (2015). Peak Oil: Apocalyptic Environmentalism and Libertarian Political Culture. University of Chicago Press. ISBN 978-0-226-28543-6.
- Overland, Indra; Bazilian, Morgan; Ilimbek Uulu, Talgat; Vakulchuk, Roman; Westphal, Kirsten (2019). "The GeGaLo index: Geopolitical gains and losses after energy transition". Energy Strategy Reviews. 26: 100406. doi:10.1016/j.esr.2019.100406.
- Cheraghian, Goshtasp (February 2016). "Effects of titanium dioxide nanoparticles on the efficiency of surfactant flooding of heavy oil in a glass micromodel". Petroleum Science and Technology. 34 (3): 260–267. doi:10.1080/10916466.2015.1132233. ISSN 1091-6466.
- Cheraghian, Goshtasp (2017). "Evaluation of Clay and Fumed Silica Nanoparticles on Adsorption of Surfactant Polymer during Enhanced Oil Recovery". Journal of the Japan Petroleum Institute (in Japanese). 60 (2): 85–94. doi:10.1627/jpi.60.85. ISSN 1346-8804.
- U.S. Crude Oil Production Forecast – Analysis of Crude Types (PDF), Washington, DC: U.S. Energy Information Administration, May 28, 2015, retrieved September 13, 2018,
U.S. oil production has grown rapidly in recent years. U.S. Energy Information Administration (EIA) data, which reflect combined production of crude oil and lease condensate, show a rise from 5.6 million barrels per day (bbl/d) in 2011 to 7.5 million bbl/d in 2013, and a record 1.2 million bbl/d increase to 8.7 million bbl/d in 2014. Increasing production of light crude oil in low-permeability or tight resource formations in regions like the Bakken, Permian Basin, and Eagle Ford (often referred to as light tight oil) account for nearly all the net growth in U.S. crude oil production.
EIA’s latest Short-Term Energy Outlook, issued in May 2015, reflects continued production growth in 2015 and 2016, albeit at a slower pace than in 2013 and 2014, with U.S. crude oil production in 2016 forecast to reach 9.2 million bbl/d. Beyond 2016, the Annual Energy Outlook 2015 (AEO2015) projects further production growth, although its pace and duration remains highly uncertain. - Ovale, Peder (December 11, 2014). "Her ser du hvorfor oljeprisen faller". Archived from the original on December 13, 2014. In English Teknisk Ukeblad, 11 December 2014. Accessed: 11 December 2014.
References
- Akiner, Shirin; Aldis, Anne, eds. (2004). The Caspian: Politics, Energy and Security. New York: Routledge. ISBN 978-0-7007-0501-6.
- Bauer Georg, Bandy Mark Chance (tr.), Bandy Jean A. (tr.) (1546). De Natura Fossilium. vi (in Latin).CS1 maint: multiple names: authors list (link) translated 1955
- Hyne, Norman J. (2001). Nontechnical Guide to Petroleum Geology, Exploration, Drilling, and Production. PennWell Corporation. ISBN 978-0-87814-823-3.
- Mabro, Robert; Organization of Petroleum Exporting Countries (2006). Oil in the 21st century: issues, challenges and opportunities. Oxford Press. ISBN 978-0-19-920738-1.
- Maugeri, Leonardo (2005). The Age of Oil: What They Don't Want You to Know About the World's Most Controversial Resource. Guilford, CT: Globe Pequot. p. 15. ISBN 978-1-59921-118-3.
- Speight, James G. (1999). The Chemistry and Technology of Petroleum. Marcel Dekker. ISBN 978-0-8247-0217-5.
- Speight, James G; Ancheyta, Jorge, eds. (2007). Hydroprocessing of Heavy Oils and Residua. CRC Press. ISBN 978-0-8493-7419-7.
- Vassiliou, Marius (2018). Historical Dictionary of the Petroleum Industry, 2nd Edition. Rowman & Littlefield. ISBN 978-1-5381-1159-8.
Further reading
- Kenney, J., Kutcherov, V., Bendeliani, N. and Alekseev, V. (2002). "The evolution of multicomponent systems at high pressures: VI. The thermodynamic stability of the hydrogen–carbon system: The genesis of hydrocarbons and the origin of petroleum". Proceedings of the National Academy of Sciences of the United States of America. 99 (17): 10976–10981. arXiv:physics/0505003. Bibcode:2002PNAS...9910976K. doi:10.1073/pnas.172376899. PMC 123195. PMID 12177438.CS1 maint: multiple names: authors list (link)
External links
| Wikimedia Commons has media related to Petroleum. |
| Wikisource has the text of the 1905 New International Encyclopedia article Petroleum. |
- Global Fossil Infrastructure Tracker
- API – the trade association of the US oil industry. (American Petroleum Institute)
- U.S. Energy Information Administration
- Joint Organisations Data Initiative | Oil and Gas Data Transparency
- U.S. National Library of Medicine: Hazardous Substances Databank – Crude Oil
- Crude: 2007 Australian Broadcasting Corporation documentary about the formation