Aylesbury Vale District Council elections
Map showing the composition of Aylesbury Vale District Council as of the last election in 2015. Conservatives in blue, Liberal Democrats in yellow, UK Independence Party in purple, Labour in red and Independents in grey.
Aylesbury Vale District Council in Buckinghamshire, England is elected every four years. Since the last boundary changes in 2015, 59 councillors have been elected from 33 wards.[1]
Political control
Since the first election to the council in 1973 political control of the council has been held by the following parties:[2]
| Party in control | Years |
|---|---|
| Independent | 1973 - 1976 |
| No overall control | 1976–1979 |
| Conservative | 1979–1991 |
| No overall control | 1991–1995 |
| Liberal Democrats | 1995–1999 |
| No overall control | 1999–2003 |
| Conservative | 2003–present |
Council elections
Summary of the council composition after each council election, click on the year for full details of each election.
| Year | Conservative | Liberal Democrats (including predecessor parties) | UK Independence Party | Labour | Independent | Liberal (post 1989) | Independent Conservative | Residents | Notes |
|---|---|---|---|---|---|---|---|---|---|
| 1973[3] | 11 | 0 | 0 | 12 | 31 | 0 | 0 | 0 | |
| 1976[3] | 29 | 2 | 0 | 9 | 16 | 0 | 1 | 1 | New ward boundaries[4] |
| 1979[3] | 33 | 1 | 0 | 8 | 14 | 0 | 1 | 1 | |
| 1983[3] | 34 | 5 | 0 | 4 | 14 | 0 | 1 | 0 | |
| 1987[3] | 34 | 14 | 0 | 2 | 8 | 0 | 0 | 0 | |
| 1991[3] | 28 | 21 | 0 | 1 | 7 | 1 | 0 | 0 | District boundary changes took place but the number of seats remained the same[5][6] |
| 1995[7] | 12 | 33 | 0 | 5 | 8 | 0 | 0 | 0 | |
| 1999[8] | 24 | 26 | 0 | 1 | 7 | 0 | 0 | 0 | |
| 2003[9] | 30 | 25 | 0 | 0 | 4 | 0 | 0 | 0 | New ward boundaries increased the number of seats by 1[9][10] |
| 2007[11] | 37 | 21 | 0 | 0 | 1 | 0 | 0 | 0 | Some new ward boundaries[12][13] |
| 2011[14] | 37 | 16 | 3 | 2 | 1 | 0 | 0 | 0 | |
| 2015[15] | 43 | 9 | 4 | 2 | 1 | 0 | 0 | 0 | New ward boundaries[16] |
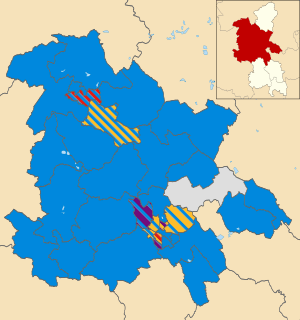
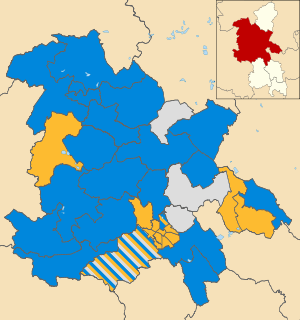
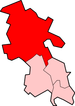
District result maps
 2003 results map
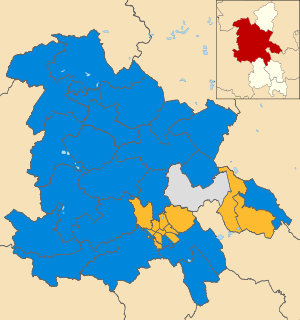 2007 results map
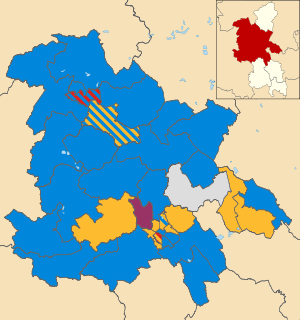 2011 results map
- 2015 results map
By-election results
By-elections occur when seats become vacant between council elections. Below is a summary of recent by-elections;[17] full by-election results can be found by clicking on the by-election name.
1995-1999
| Party | Candidate | Votes | % | ± | |
|---|---|---|---|---|---|
| Independent | 388 | 54.2 | +54.2 | ||
| Liberal Democrat | 236 | 33.0 | -23.5 | ||
| Labour | 92 | 12.8 | +12.8 | ||
| Majority | 152 | 21.2 | |||
| Turnout | 716 | 47.0 | |||
| Independent gain from Liberal Democrat | Swing | ||||
| Party | Candidate | Votes | % | ± | |
|---|---|---|---|---|---|
| Conservative | 492 | 55.8 | +33.1 | ||
| Liberal Democrat | 273 | 30.1 | -4.5 | ||
| Labour | 117 | 13.3 | +4.1 | ||
| Majority | 219 | 25.7 | |||
| Turnout | 882 | 29.0 | |||
| Conservative gain from Liberal Democrat | Swing | ||||
| Party | Candidate | Votes | % | ± | |
|---|---|---|---|---|---|
| Conservative | 830 | 46.2 | +13.2 | ||
| Liberal Democrat | 638 | 35.5 | -10.5 | ||
| Labour | 160 | 8.9 | -12.1 | ||
| Majority | 192 | 10.7 | |||
| Turnout | 1,628 | 31.0 | |||
| Conservative gain from Liberal Democrat | Swing | ||||
| Party | Candidate | Votes | % | ± | |
|---|---|---|---|---|---|
| Liberal Democrat | 263 | 43.1 | -11.3 | ||
| Labour | 193 | 31.6 | +0.1 | ||
| Conservative | 154 | 25.2 | +11.1 | ||
| Majority | 70 | 11.5 | |||
| Turnout | 610 | 12.0 | |||
| Liberal Democrat hold | Swing | ||||
| Party | Candidate | Votes | % | ± | |
|---|---|---|---|---|---|
| Liberal Democrat | 949 | 55.8 | +2.7 | ||
| Conservative | 483 | 28.4 | -2.8 | ||
| Labour | 161 | 9.5 | -5.6 | ||
| Independent | 109 | 6.4 | +6.4 | ||
| Majority | 466 | 27.4 | |||
| Turnout | 1,702 | 42.8 | |||
| Liberal Democrat hold | Swing | ||||
| Party | Candidate | Votes | % | ± | |
|---|---|---|---|---|---|
| Liberal Democrat | 305 | 47.9 | -1.1 | ||
| Conservative | 248 | 38.9 | +22.7 | ||
| Labour | 83 | 13.0 | -17.7 | ||
| Majority | 57 | 9.0 | |||
| Turnout | 636 | 24.9 | |||
| Liberal Democrat hold | Swing | ||||
| Party | Candidate | Votes | % | ± | |
|---|---|---|---|---|---|
| Liberal Democrat | 498 | 48.3 | +6.5 | ||
| Conservative | 313 | 30.3 | +17.4 | ||
| Labour | 221 | 21.4 | -12.9 | ||
| Majority | 185 | 18.0 | |||
| Turnout | 1,032 | 17.1 | |||
| Liberal Democrat gain from Labour | Swing | ||||
| Party | Candidate | Votes | % | ± | |
|---|---|---|---|---|---|
| Conservative | 412 | 52.9 | +3.0 | ||
| Liberal Democrat | 212 | 27.2 | +7.8 | ||
| Labour | 155 | 19.9 | -10.8 | ||
| Majority | 200 | 25.7 | |||
| Turnout | 779 | 37.0 | |||
| Conservative hold | Swing | ||||
| Party | Candidate | Votes | % | ± | |
|---|---|---|---|---|---|
| Conservative | 211 | 44.3 | -2.4 | ||
| Liberal Democrat | 208 | 43.7 | -9.6 | ||
| Labour | 57 | 12.0 | +12.0 | ||
| Majority | 150 | 0.6 | |||
| Turnout | 476 | 33.6 | |||
| Conservative gain from Liberal Democrat | Swing | ||||
1999-2003
| Party | Candidate | Votes | % | ± | |
|---|---|---|---|---|---|
| Conservative | 480 | 50.5 | +5.1 | ||
| Liberal Democrat | 471 | 49.5 | -5.1 | ||
| Majority | 9 | 1.0 | |||
| Turnout | 951 | 44.3 | |||
| Conservative gain from Liberal Democrat | Swing | ||||
| Party | Candidate | Votes | % | ± | |
|---|---|---|---|---|---|
| Liberal Democrat | 579 | 80.1 | +27.4 | ||
| Conservative | 144 | 19.9 | +0.5 | ||
| Majority | 435 | 60.2 | |||
| Turnout | 723 | 12.2 | |||
| Liberal Democrat hold | Swing | ||||
| Party | Candidate | Votes | % | ± | |
|---|---|---|---|---|---|
| Conservative | 760 | 49.2 | +7.8 | ||
| Liberal Democrat | 703 | 45.5 | -13.1 | ||
| Labour | 82 | 5.3 | +5.3 | ||
| Majority | 57 | 3.7 | |||
| Turnout | 1,545 | 30.2 | |||
| Conservative gain from Liberal Democrat | Swing | ||||
| Party | Candidate | Votes | % | ± | |
|---|---|---|---|---|---|
| Liberal Democrat | 521 | 47.2 | +2.8 | ||
| Conservative | 283 | 25.6 | +10.8 | ||
| Independent | 172 | 15.5 | +0.6 | ||
| Labour | 128 | 11.6 | -14.3 | ||
| Majority | 238 | 21.6 | |||
| Turnout | 1,104 | 21.1 | |||
| Liberal Democrat hold | Swing | ||||
2003-2007
| Party | Candidate | Votes | % | ± | |
|---|---|---|---|---|---|
| Liberal Democrat | Maria Butler | 382 | 47.5 | -10.7 | |
| Conservative | Wajid Kiani | 248 | 30.8 | +16.4 | |
| Aylesbury Resident's Action Party | David Davies | 129 | 16.0 | -11.4 | |
| Labour | Neal Bonham | 46 | 5.7 | +5.7 | |
| Majority | 134 | 16.7 | |||
| Turnout | 805 | 21.4 | |||
| Liberal Democrat hold | Swing | ||||
| Party | Candidate | Votes | % | ± | |
|---|---|---|---|---|---|
| Conservative | 885 | 54.2 | +12.9 | ||
| Liberal Democrat | Hannah Saul | 577 | 35.4 | +11.6 | |
| Independent | 170 | 10.4 | -24.5 | ||
| Majority | 308 | 18.8 | |||
| Turnout | 1,632 | 37.5 | |||
| Conservative hold | Swing | ||||
| Party | Candidate | Votes | % | ± | |
|---|---|---|---|---|---|
| Conservative | Huw Lewis | 328 | 38.8 | -7.8 | |
| Labour | Robin Stuchbury | 285 | 33.7 | +2.8 | |
| Liberal Democrat | Charles Burke | 198 | 23.4 | +0.9 | |
| Independent | Philipp Von Both | 35 | 4.1 | +4.1 | |
| Majority | 43 | 5.1 | |||
| Turnout | 846 | 21.7 | |||
| Conservative hold | Swing | ||||
| Party | Candidate | Votes | % | ± | |
|---|---|---|---|---|---|
| Conservative | Janet Blake | 557 | 63.4 | -7.2 | |
| Liberal Democrat | Llewellyn Monger | 322 | 36.6 | +36.6 | |
| Majority | 235 | 26.8 | |||
| Turnout | 879 | 40.2 | |||
| Conservative hold | Swing | ||||
| Party | Candidate | Votes | % | ± | |
|---|---|---|---|---|---|
| Liberal Democrat | Tuffail Hussain | 559 | 56.3 | +3.5 | |
| Conservative | Jane Sale | 343 | 34.6 | +14.5 | |
| Residents | Suzanna Copcutt | 90 | 9.1 | -0.2 | |
| Majority | 216 | 21.7 | |||
| Turnout | 992 | 24.0 | |||
| Liberal Democrat hold | Swing | ||||
2007-2011
| Party | Candidate | Votes | % | ± | |
|---|---|---|---|---|---|
| Liberal Democrat | Graham Webster | 354 | 50.6 | -1.9 | |
| Conservative | Mark Winn | 213 | 30.5 | -5.9 | |
| Labour | Michael Beall | 67 | 9.6 | +9.6 | |
| UKIP | Brian Adams | 65 | 9.3 | -1.9 | |
| Majority | 141 | 20.1 | |||
| Turnout | 699 | 26.9 | |||
| Liberal Democrat hold | Swing | ||||
| Party | Candidate | Votes | % | ± | |
|---|---|---|---|---|---|
| Conservative | Pearl Lewis | 343 | 49.7 | -30.7 | |
| UKIP | John Russell | 151 | 21.9 | +21.9 | |
| Liberal Democrat | Ian Metherell | 133 | 19.3 | +19.3 | |
| Independent | Mark Benson | 63 | 9.1 | +9.1 | |
| Majority | 192 | 27.8 | |||
| Turnout | 690 | 33.4 | |||
| Conservative hold | Swing | ||||
2015-present
| Party | Candidate | Votes | % | ± | |
|---|---|---|---|---|---|
| Liberal Democrat | Susan Morgan | 785 | 63.5 | +37.9 | |
| Labour | Gary Andrew Paxton | 151 | 12.2 | -10.0 | |
| Conservative | Ammer Raheel | 147 | 11.9 | -9.3 | |
| UKIP | Philip Peter Gomm | 111 | 9.0 | -14.4 | |
| Green | Nigel Antony Foster | 43 | 3.5 | -4.2 | |
| Majority | 634 | 51.3 | |||
| Turnout | 1,244 | 27 | |||
| Liberal Democrat gain from UKIP | Swing | ||||
References
- ↑ "The Aylesbury Vale (Electoral Changes) Order 2014". legislation.gov.uk. Retrieved 25 February 2017.
- ↑ "Aylesbury Vale". BBC News Online. Retrieved 2010-02-07.
- 1 2 3 4 5 6 "Aylesbury Vale District Council Election Results 1973-2011" (PDF). The Elections Centre. Retrieved 26 February 2017.
- ↑ legislation.gov.uk - The District of Aylesbury Vale (Electoral Arrangements) Order 1975. Retrieved on 19 November 2015.
- ↑ legislation.gov.uk - The Bedfordshire, Buckinghamshire and Cambridgeshire (County Boundaries) Order 1991. Retrieved on 5 November 2015.
- ↑ legislation.gov.uk - The Buckinghamshire, Hertfordshire, Northamptonshire and Oxfordshire (County Boundaries) Order 1991. Retrieved on 5 November 2015.
- ↑ "Complete list of results from thursday's council elections - Council elections". The Times. 6 May 1995.
- ↑ "How the nations voted - Election". The Times. 8 May 1999. p. 48.
- 1 2 "Local elections". BBC News Online. Retrieved 26 February 2017.
- ↑ legislation.gov.uk - The District of Aylesbury Vale (Electoral Changes) Order 2002. Retrieved on 4 October 2015.
- ↑ "Aylesbury Vale". BBC News Online. 4 May 2007. Retrieved 26 February 2017.
- ↑ legislation.gov.uk - The Aylesbury Vale (Parish Electoral Arrangements and Electoral Changes) Order 2007. Retrieved on 3 November 2015.
- ↑ legislation.gov.uk - The Aylesbury Vale (Parish Electoral Arrangements and Electoral Changes) (Amendment) Order 2009. Retrieved on 3 November 2015.
- ↑ "District Election - Thursday 5th May 2011". Aylesbury Vale District Council. Retrieved 26 February 2017.
- ↑ "District Election - Thursday 7th May 2015". Aylesbury Vale District Council. Retrieved 26 February 2017.
- ↑ legislation.gov.uk - The Aylesbury Vale (Electoral Changes) Order 2014. Retrieved on 3 November 2015.
- ↑ "Local Authority Byelection Results". Retrieved 26 February 2017.
- ↑ "East Enders desert BNP". guardian.co.uk. 2002-06-28. Retrieved 2010-02-07.
- ↑ "Results of Quarrendon By-election". Aylesbury Vale District Council. Archived from the original on 2003-12-03. Retrieved 2010-02-07.
- ↑ "Close byelection victory for Tories". guardian.co.uk. 2004-03-26. Retrieved 2010-02-07.
- ↑ "Tories defend council majority". guardian.co.uk. 2004-11-19. Retrieved 2010-02-07.
- ↑ "Results of Town, District and County by-election for Buckingham South". Aylesbury Vale District Council. Archived from the original on 2004-12-08. Retrieved 2010-02-07.
- ↑ "BNP gets second place in Derbyshire election". guardian.co.uk. 2006-02-03. Retrieved 2010-02-07.
- ↑ "Results of the Gatehouse Ward by-elections". Aylesbury Vale District Council. 2006-07-29. Retrieved 2010-02-07.
- ↑ "Aylesbury central by-election result". The Bucks Herald. 2010-02-11. Retrieved 2010-02-12.
- ↑ "Results of Luffield Abbey by-election". Buckingham Today. 2010-02-12. Archived from the original on 13 March 2010. Retrieved 2010-02-12.
- ↑ http://aylesburyvale.moderngov.co.uk/mgElectionAreaResults.aspx?ID=99&RPID=638477
External links
| Buckinghamshire County Council | |
|---|---|
| Milton Keynes Council | |
| Aylesbury Vale District Council | |
| Chiltern District Council |
|
| South Bucks District Council |
|
| Wycombe District Council |
|
| |
This article is issued from
Wikipedia.
The text is licensed under Creative Commons - Attribution - Sharealike.
Additional terms may apply for the media files.