Marshall County, Tennessee
| Marshall County, Tennessee | |
|---|---|
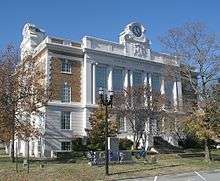 Marshall County courthouse in Lewisburg | |
|
Location in the U.S. state of Tennessee | |
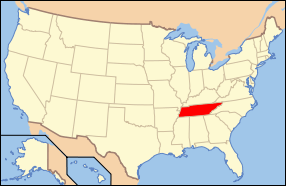 Tennessee's location in the U.S. | |
| Founded | February 20, 1836 |
| Named for | John Marshall[1] |
| Seat | Lewisburg |
| Largest city | Lewisburg |
| Area | |
| • Total | 376 sq mi (974 km2) |
| • Land | 375 sq mi (971 km2) |
| • Water | 0.7 sq mi (2 km2), 0.2% |
| Population | |
| • (2010) | 30,617 |
| • Density | 82/sq mi (32/km2) |
| Congressional district | 4th |
| Time zone | Central: UTC−6/−5 |
| Website |
marshallcountytn |
Marshall County is a county located in the U.S. state of Tennessee. As of the 2010 census, the population was 30,617.[2] Its county seat is Lewisburg.[3]
Marshall County comprises the Lewisburg Micropolitan Statistical Area, which is also included in the Nashville-Davidson-Murfreseboro Combined Statistical Area. It is in Middle Tennessee, one of the three Grand Divisions of the state.
The Tennessee Walking Horse Breeders' and Exhibitors' Association is based here. In addition, the fainting goat is another animal breed developed here. To celebrate this unique breed, the county holds an annual festival known as "Goats, Music and More," drawing visitors from around the world.[4]
History
Marshall County was created in 1836 from parts of Giles, Bedford, Lincoln and Maury counties. It was named after the American jurist, John Marshall, Chief Justice of the U.S. Supreme Court.[1]
The economy was based on agriculture in the antebellum years and well into the twentieth century. Planters had depended on the labor of enslaved African Americans to work the commodity crops of tobacco and hemp, as well as care for thoroughbred horses and other quality livestock. The breed known as the Tennessee Walking Horse was developed here.
After the war, blacks and whites struggled to adjust to emancipation and a free labor market. Freedmen founded Needmore as a community in Marshall County after the Civil War where they could live as neighbors and be relatively free of white supervision.[5]
Whites committed violence against freedmen to re-establish and maintain dominance after the war. In the period after Reconstruction and into the early 20th century, whites in Marshall County committed eight lynchings of African Americans. This was the fifth-highest total of any county in the state, but three other counties, including two nearby, also had eight lynchings each.[6]
Among these lynchings were the murders of John Milligan (also spelled Millikin) and John L. Hunter in the Needmore settlement near the county seat of Lewisburg in August 1903. Governor James B. Frazier offered a reward for information, as Whitecaps were blamed for the deaths, and the state was trying to eliminate this secret, vigilante group.[5] In the early 20th century, numerous African Americans left the county during the period of the Great Migration to northern and midwestern industrial cities for work.
Three Tennessee governors— Henry Horton, Jim Nance McCord, and Buford Ellington— were each living in Marshall County at the time of their election as governor.
Geography
According to the U.S. Census Bureau, the county has a total area of 376 square miles (970 km2), of which 375 square miles (970 km2) is land and 0.7 square miles (1.8 km2) (0.2%) is water.[7] The Duck River drains much of the county.
Adjacent counties
- Rutherford County (northeast)
- Bedford County (east)
- Lincoln County (southeast)
- Giles County (southwest)
- Maury County (west)
- Williamson County (northwest)
State protected areas
- Henry Horton State Park
- Wilson School Road Forest and Cedar Glades State Natural Area
Demographics
| Historical population | |||
|---|---|---|---|
| Census | Pop. | %± | |
| 1840 | 14,555 | — | |
| 1850 | 15,616 | 7.3% | |
| 1860 | 14,592 | −6.6% | |
| 1870 | 16,207 | 11.1% | |
| 1880 | 19,259 | 18.8% | |
| 1890 | 18,906 | −1.8% | |
| 1900 | 18,763 | −0.8% | |
| 1910 | 16,872 | −10.1% | |
| 1920 | 17,375 | 3.0% | |
| 1930 | 15,574 | −10.4% | |
| 1940 | 16,030 | 2.9% | |
| 1950 | 17,768 | 10.8% | |
| 1960 | 16,859 | −5.1% | |
| 1970 | 17,319 | 2.7% | |
| 1980 | 19,698 | 13.7% | |
| 1990 | 21,539 | 9.3% | |
| 2000 | 26,767 | 24.3% | |
| 2010 | 30,617 | 14.4% | |
| Est. 2016 | 31,915 | [8] | 4.2% |
| U.S. Decennial Census[9] 1790-1960[10] 1900-1990[11] 1990-2000[12] 2010-2014[2] | |||
As of the census[14] of 2000, there were 26,767 people, 10,307 households, and 7,472 families residing in the county. The population density was 71 people per square mile (28/km²). There were 11,181 housing units at an average density of 30 per square mile (12/km²). The racial makeup of the county was 89.42% White, 7.77% Black or African American, 0.25% Native American, 0.31% Asian, 0.01% Pacific Islander, 1.46% from other races, and 0.77% from two or more races. 2.87% of the population were Hispanic or Latino of any race.
There were 10,307 households out of which 33.80% had children under the age of 18 living with them, 56.80% were married couples living together, 11.60% had a female householder with no husband present, and 27.50% were non-families. 23.90% of all households were made up of individuals and 10.00% had someone living alone who was 65 years of age or older. The average household size was 2.56 and the average family size was 3.02.
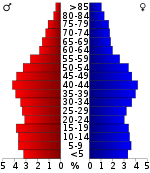
In the county, the population was spread out with 25.60% under the age of 18, 8.70% from 18 to 24, 29.90% from 25 to 44, 23.20% from 45 to 64, and 12.60% who were 65 years of age or older. The median age was 36 years. For every 100 females there were 95.40 males. For every 100 females age 18 and over, there were 92.90 males.
The median income for a household in the county was $38,457, and the median income for a family was $45,731. Males had a median income of $31,876 versus $22,362 for females. The per capita income for the county was $17,749. About 7.30% of families and 10.00% of the population were below the poverty line, including 10.80% of those under age 18 and 13.10% of those age 65 or over.
Communities
City
Towns
- Chapel Hill
- Cornersville
- Petersburg (partial)
Unincorporated communities
Politics
| Year | Republican | Democratic | Third Parties |
|---|---|---|---|
| 2016 | 71.4% 8,184 | 24.9% 2,852 | 3.7% 419 |
| 2012 | 63.6% 6,832 | 34.7% 3,725 | 1.7% 184 |
| 2008 | 59.8% 6,755 | 38.3% 4,320 | 1.9% 214 |
| 2004 | 54.9% 5,825 | 44.5% 4,722 | 0.6% 68 |
| 2000 | 43.9% 4,105 | 54.6% 5,107 | 1.6% 147 |
| 1996 | 35.1% 2,781 | 56.2% 4,447 | 8.7% 685 |
| 1992 | 31.1% 2,516 | 55.5% 4,491 | 13.5% 1,091 |
| 1988 | 51.4% 2,975 | 48.3% 2,795 | 0.4% 21 |
| 1984 | 53.4% 3,416 | 45.9% 2,935 | 0.7% 42 |
| 1980 | 34.2% 2,282 | 64.2% 4,277 | 1.6% 107 |
| 1976 | 27.0% 1,674 | 71.8% 4,457 | 1.3% 78 |
| 1972 | 59.2% 2,593 | 34.9% 1,526 | 5.9% 259 |
| 1968 | 19.7% 1,202 | 25.0% 1,527 | 55.3% 3,379 |
| 1964 | 25.2% 1,340 | 74.9% 3,989 | |
| 1960 | 31.9% 1,717 | 67.3% 3,625 | 0.8% 45 |
| 1956 | 26.6% 1,527 | 71.4% 4,100 | 2.1% 118 |
| 1952 | 28.4% 1,525 | 71.6% 3,837 | |
| 1948 | 12.0% 517 | 71.2% 3,059 | 16.7% 719 |
| 1944 | 11.6% 500 | 88.3% 3,812 | 0.1% 3 |
| 1940 | 11.0% 389 | 88.9% 3,132 | 0.1% 2 |
| 1936 | 11.0% 300 | 88.8% 2,431 | 0.3% 8 |
| 1932 | 11.5% 283 | 87.7% 2,167 | 0.8% 20 |
| 1928 | 50.0% 735 | 50.0% 735 | |
| 1924 | 16.7% 349 | 81.3% 1,696 | 1.9% 40 |
| 1920 | 29.0% 753 | 70.4% 1,828 | 0.6% 15 |
| 1916 | 21.6% 461 | 77.4% 1,652 | 1.0% 21 |
| 1912 | 18.6% 376 | 76.6% 1,551 | 4.8% 98 |
See also
References
- 1 2 Carroll Van West, "Marshall County," Tennessee Encyclopedia of History and Culture. Retrieved: 11 March 2013.
- 1 2 "State & County QuickFacts". United States Census Bureau. Retrieved December 6, 2013.
- ↑ "Find a County". National Association of Counties. Retrieved 2011-06-07.
- ↑ About the Festival Archived 2013-10-16 at the Wayback Machine., Goats, Music and More website, 2013. Retrieved: 23 October 2013.
- 1 2 "Reward for Whitecaps", Lewisburg Tribune News, 11 August 1903- Vol.3 (posted by Martha Smotherman Mendez), Genealogy Trails; accessed 25 May 2018
- ↑ Lynching in America, Third Edition: Supplement by County, p. 9, Equal Justice Initiative, Mobile, AL, 2017
- ↑ "2010 Census Gazetteer Files". United States Census Bureau. August 22, 2012. Retrieved April 9, 2015.
- ↑ "Population and Housing Unit Estimates". Retrieved June 9, 2017.
- ↑ "U.S. Decennial Census". United States Census Bureau. Retrieved April 9, 2015.
- ↑ "Historical Census Browser". University of Virginia Library. Retrieved April 9, 2015.
- ↑ Forstall, Richard L., ed. (March 27, 1995). "Population of Counties by Decennial Census: 1900 to 1990". United States Census Bureau. Retrieved April 9, 2015.
- ↑ "Census 2000 PHC-T-4. Ranking Tables for Counties: 1990 and 2000" (PDF). United States Census Bureau. April 2, 2001. Retrieved April 9, 2015.
- ↑ Based on 2000 census data
- ↑ "American FactFinder". United States Census Bureau. Retrieved 2011-05-14.
- ↑ Leip, David. "Dave Leip's Atlas of U.S. Presidential Elections". uselectionatlas.org. Retrieved 2018-03-11.
External links
| Wikimedia Commons has media related to Marshall County, Tennessee. |
- Official site
- Marshall County Chamber of Commerce
- Tennessee Walking Horse Breeders' and Exhibitors' Association
- Annual Fainting Goat Festival
- Marshall County, TNGenWeb - free genealogy resources for the county
- Marshall County at Curlie (based on DMOZ)
Places adjacent to Marshall County, Tennessee | ||||||||||
|---|---|---|---|---|---|---|---|---|---|---|
| ||||||||||
Municipalities and communities of Marshall County, Tennessee, United States | ||
|---|---|---|
| City | ||
| Towns | ||
| Unincorporated communities | ||
| Ghost town | ||
| Footnotes | ‡This populated place also has portions in an adjacent county or counties | |