Results of the 2016 United Kingdom European Union membership referendum
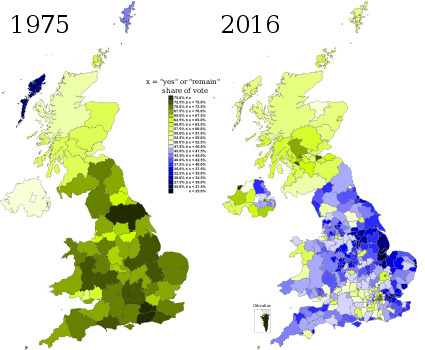
The 2016 United Kingdom European Union membership referendum took place in the United Kingdom and Gibraltar on 23 June 2016.[1][2] Membership of the European Union had been a topic of debate in the United Kingdom since the country joined the European Communities (then often called the "Common Market" by British people) in 1973. This referendum was conducted very differently from the European Communities membership referendum in 1975; a more localised and regionalised counting procedure was used, and the ballot was overseen by the Electoral Commission, a public body which did not exist at the time of the first vote. This article lists, by voting area for Great Britain and Gibraltar and by parliamentary constituency for Northern Ireland, all the results of the referendum, each ordered into national and regional sections.
| United Kingdom European Union membership referendum | ||||||||||||||||||||||
|---|---|---|---|---|---|---|---|---|---|---|---|---|---|---|---|---|---|---|---|---|---|---|
| Should the United Kingdom remain a member of the European Union or leave the European Union? | ||||||||||||||||||||||
| Location | United Kingdom (including Gibraltar) | |||||||||||||||||||||
| Date | 23 June 2016 | |||||||||||||||||||||
| ||||||||||||||||||||||
| ||||||||||||||||||||||
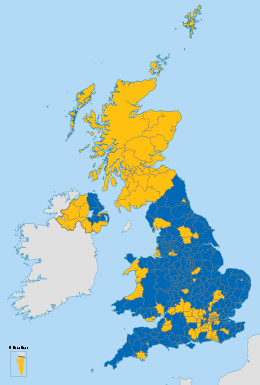
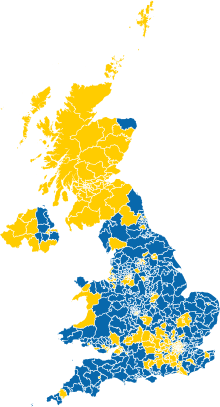
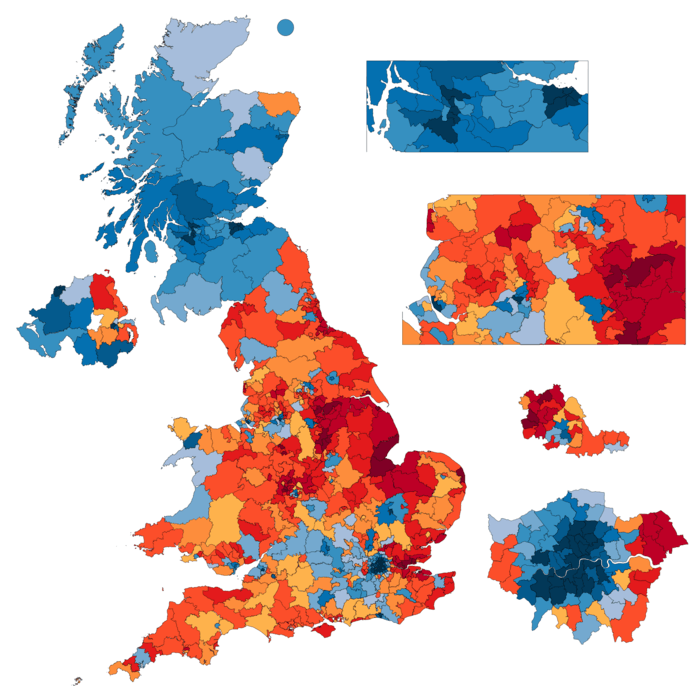
| On the map, the darker shades for a colour indicate a larger margin. The results for Northern Ireland are by Parliamentary constituency. | ||||||||||||||||||||||

.svg.png)
Under the provisions of the European Union Referendum Act 2015, there were a total of 382 voting areas across twelve regions, using the same boundaries as used in European Parliamentary elections since 1999, under the provisions of the European Parliamentary Elections Act 2002, with votes counted at local authority level. In England the 326 local government districts were used as the voting areas; these consist of all unitary authorities, all metropolitan boroughs, all shire districts, the London boroughs, the City of London and the Isles of Scilly.[3] The nine regions of England were then also used to count the votes at the regional level, with Gibraltar being regarded as part of South West England. Northern Ireland was a single voting area as well as being a regional count, although local totals by Westminster parliamentary constituency area were announced.[3] In Scotland the 32 Scottish council areas were used as voting areas and a single national count.[3] In Wales the 22 Welsh council areas were used as the voting areas and a single national count.[3]
Counting began as soon as the polls closed on 23 June from 2200 BST onwards (making it the first UK-wide referendum to be counted overnight) and took nine hours and twenty minutes to complete. The result of the referendum was forecast by the BBC just before 04:40 BST (around 6 hours 40 minutes after polls closed), with around 308 results declared at the time. The first result announced was Gibraltar, and the last was Cornwall.
On 23 June 2016, the recorded result was that the UK voted to leave the European Union by 51.89% for Leave to 48.11% for Remain, a margin of 3.78%. This corresponded to 17,410,742 votes to leave and 16,141,241 to remain, a margin of 1,269,501 votes.
United Kingdom
The final result of the referendum for the United Kingdom and Gibraltar was declared at Manchester Town Hall at 0720 BST on Friday 24 June 2016, after all the 382 voting areas and the twelve UK regions had declared their results, by the then "Chief Counting Officer" (CCO) for the referendum, Jenny Watson. In a UK-wide referendum, the position of "Chief Counting Officer" (CCO) is held by the chair of the Electoral Commission.[4] The following figures are as reported by the Electoral Commission.[5]
With a national turnout of 72%, the target to secure the majority win for the winning side was 16,788,672 votes. The decision by the electorate was to "Leave the European Union" which won by a majority of 1,269,501 votes (3.78%) over those who had voted in favour of "Remain a member of the European Union", with England and Wales voting to "Leave" while Scotland and Northern Ireland voted to "Remain".
| Choice | Votes | % |
|---|---|---|
| Leave the European Union | 17,410,742 | 51.89 |
| Remain a member of the European Union | 16,141,241 | 48.11 |
| Valid votes | 33,551,983 | 99.92 |
| Invalid or blank votes | 25,359 | 0.08 |
| Total votes | 33,577,342 | 100.00 |
| Registered voters and turnout | 46,500,001 | 72.21 |
| Source: Electoral Commission[6] | ||
| Leave: 17,410,742 (51.9%) |
Remain: 16,141,241 (48.1%) | ||
| ▲ | |||
Results by United Kingdom regions
| Region | Electorate | Voter turnout, of eligible |
Votes | Proportion of votes | |||
|---|---|---|---|---|---|---|---|
| Remain | Leave | Remain | Leave | ||||
| East Midlands | 3,384,299 | 74.2% | 1,033,036 | 1,475,479 | 41.18% | 58.82% | |
| East of England | 4,398,796 | 75.7% | 1,448,616 | 1,880,367 | 43.52% | 56.48% | |
| Greater London | 5,424,768 | 69.7% | 2,263,519 | 1,513,232 | 59.93% | 40.07% | |
| North East England | 1,934,341 | 69.3% | 562,595 | 778,103 | 41.96% | 58.04% | |
| North West England | 5,241,568 | 70.0% | 1,699,020 | 1,966,925 | 46.35% | 53.65% | |
| Northern Ireland | 1,260,955 | 62.7% | 440,707 | 349,442 | 55.78% | 44.22% | |
| Scotland | 3,987,112 | 67.2% | 1,661,191 | 1,018,322 | 62.00% | 38.00% | |
| South East England | 6,465,404 | 76.8% | 2,391,718 | 2,567,965 | 48.22% | 51.78% | |
| South West England (including Gibraltar) |
4,138,134 | 76.7% | 1,503,019 | 1,669,711 | 47.37% | 52.63% | |
| Wales | 2,270,272 | 71.7% | 772,347 | 854,572 | 47.47% | 52.53% | |
| West Midlands | 4,116,572 | 72.0% | 1,207,175 | 1,755,687 | 40.74% | 59.26% | |
| Yorkshire and the Humber | 3,877,780 | 70.7% | 1,158,298 | 1,580,937 | 42.29% | 57.71% | |
Results by United Kingdom constituent countries
| Country | Electorate | Voter turnout, of eligible |
Votes | Proportion of votes | |||
|---|---|---|---|---|---|---|---|
| Remain | Leave | Remain | Leave | ||||
| England (and Gibraltar) |
39,005,781 | 73.0% | 13,266,996 | 15,188,406 | 46.62% | 53.38% | |
| Northern Ireland | 1,260,955 | 62.7% | 440,707 | 349,442 | 55.78% | 44.22% | |
| Scotland | 3,987,112 | 67.2% | 1,661,191 | 1,018,322 | 62.00% | 38.00% | |
| Wales | 2,270,272 | 71.7% | 772,347 | 854,572 | 47.47% | 52.53% | |
Returns from United Kingdom major cities
Out of over 33.5 million valid votes cast across the United Kingdom, over 8.8 million, or just over one quarter, were cast in thirty major cities that each gathered 100,000 votes or more.
In those 30 cities, votes to Remain outnumbered those to Leave by over 900,000 (4,872,810 to 3,955,595 or 55.2% to 44.8%), while in the other voting areas, the votes to Leave outnumbered those to Remain by nearly 2.2 million (13,455,147 to 11,268,431, or 54.4% to 45.6%).
| City | Voting region (& Remain %) [b] |
Total votes |
Turn- out |
Votes | Percent of votes [b] | |||
|---|---|---|---|---|---|---|---|---|
| Remain | Leave | Margin [c] | Remain | Leave | ||||
| Greater London | London (59.9%) | 3,776,751 | 69.7% | 2,263,519 | 1,513,232 | +750,287 | 59.9% | 40.1% |
| Birmingham | W. Midlands (40.7%) | 450,702 | 63.7% | 223,451 | 227,251 | −3,800 | 49.6% | 50.4% |
| Leeds | Yorks/Humber (42.3%) | 387,337 | 71.3% | 194,863 | 192,474 | +2,389 | 50.3% | 49.7% |
| Sheffield | Yorks/Humber (42.3%) | 266,753 | 67.3% | 130,735 | 136,018 | −5,283 | 49.0% | 51.0% |
| Glasgow | Scotland (62.0%) | 252,809 | 56.2% | 168,335 | 84,474 | +83,861 | 66.6% | 33.4% |
| Edinburgh | Scotland (62.0%) | 252,294 | 72.9% | 187,796 | 64,498 | +123,298 | 74.4% | 25.6% |
| Bradford | Yorks/Humber (42.3%) | 228,488 | 66.7% | 104,575 | 123,913 | −19,338 | 45.8% | 54.2% |
| Bristol | South West (41.2%) | 228,445 | 73.1% | 141,027 | 87,418 | +53,609 | 61.7% | 38.3% |
| Liverpool | North West (46.3%) | 203,554 | 64.0% | 118,453 | 85,101 | +33,352 | 58.2% | 41.8% |
| Manchester | North West (46.3%) | 201,814 | 59.7% | 121,823 | 79,991 | +41,832 | 60.4% | 39.6% |
| Wakefield | Yorks/Humber (42.3%) | 175,042 | 71.1% | 58,877 | 116,165 | −57,288 | 33.6% | 66.4% |
| Cardiff | Wales (47.5%) | 169,604 | 69.6% | 101,788 | 67,816 | +33,972 | 60.0% | 40.0% |
| greater Belfast [lower-alpha 1] | N. Ireland (55.8%) | 158,365 | — | 94,915 | 63,450 | +31,465 | 59.9% | 40.1% |
| Coventry | W. Midlands (40.7%) | 153,064 | 69.2% | 67,967 | 85,097 | −17,130 | 44.4% | 55.6% |
| Brighton & Hove | South East (48.2%) | 146,675 | 74.0% | 100,648 | 46,027 | +54,621 | 68.6% | 31.4% |
| Leicester | E. Midlands (41.2%) | 138,972 | 65.0% | 70,980 | 67,992 | +2,988 | 51.1% | 48.9% |
| Sunderland | North East (42.0%) | 134,324 | 64.8% | 51,930 | 82,394 | −30,464 | 38.7% | 61.3% |
| Plymouth | South West (41.2%) | 133,455 | 71.4% | 53,458 | 79,997 | −26,539 | 40.1% | 59.9% |
| Newcastle upon Tyne | North East (42.0%) | 129,003 | 67.6% | 65,405 | 63,598 | +1,807 | 50.7% | 49.3% |
| Nottingham | E. Midlands (41.2%) | 120,661 | 61.8% | 59,318 | 61,343 | −2,025 | 49.2% | 50.8% |
| Derby | E. Midlands (41.2%) | 120,655 | 70.5% | 51,612 | 69,043 | −17,431 | 42.8% | 57.2% |
| Swansea | Wales (47.5%) | 120,243 | 69.5% | 58,307 | 61,936 | −3,629 | 48.5% | 51.5% |
| Wolverhampton | W. Midlands (40.7%) | 117,936 | 67.5% | 44,138 | 73,798 | −29,660 | 37.4% | 62.6% |
| Stoke-on-Trent | W. Midlands (40.7%) | 117,590 | 65.7% | 36,027 | 81,563 | −45,536 | 30.6% | 69.4% |
| Kingston upon Hull | Yorks/Humber (42.3%) | 113,355 | 62.9% | 36,709 | 76,646 | −39,937 | 32.4% | 67.6% |
| Salford | North West (46.3%) | 109,815 | 63.2% | 47,430 | 62,385 | −14,955 | 43.2% | 56.8% |
| York | Yorks/Humber (42.3%) | 109,600 | 70.6% | 63,617 | 45,983 | +17,634 | 58.0% | 42.0% |
| Southampton | South East (48.2%) | 107,665 | 68.1% | 49,738 | 57,927 | −8,189 | 46.2% | 53.8% |
| Aberdeen | Scotland (62.0%) | 104,714 | 67.9% | 63,985 | 40,729 | +23,256 | 61.1% | 38.9% |
| Portsmouth | South East (48.2%) | 98,720 | 70.3% | 41,384 | 57,336 | −15,952 | 41.9% | 58.1% |
| Total of 30 cities | U.K. (48.1%) | 8,828,405 | — | 4,872,810 | 3,955,595 | +917,215 | 55.2% | 44.8% |
| Other voting areas | U.K. (48.1%) | 24,723,578 | — | 11,268,431 | 13,455,147 | −2,186,716 | 45.6% | 54.4% |
| United Kingdom | U.K. | 33,551,983 | 72.2% | 16,141,241 | 17,410,742 | −1,269,501 | 48.1% | 51.9% |
| Notes: [a] Vote totals for Belfast are based on the returns from the four parliamentary constituencies in Belfast. These include areas in districts outside the City of Belfast. [b] Lighter shades indicate a prevailing Remain or Leave vote of 52.0% or less; darker shades one of 58.0% or more. [c] Margins are (arbitrarily) positive (+) when they indicate the excess of Remain votes over Leave, and negative (−) when they indicate the excess of Leave votes over Remain. | ||||||||
England
The English local districts were used as the voting areas for the referendum in England; these consist of all unitary authorities, all metropolitan boroughs, all shire districts, the London boroughs, the City of London and the Isles of Scilly.[3]
Unlike the other constituent countries of the United Kingdom there was no centralised national count of the votes in England as counting was done within the nine separate regions. Figures from Gibraltar are included in the South West England region.
| United Kingdom European Union membership referendum, 2016 England (including Gibraltar) | |||
| Choice | Votes | % | |
|---|---|---|---|
| Leave the European Union | 15,188,406 | 53.38% | |
| Remain a member of the European Union | 13,266,996 | 46.62% | |
| Valid votes | 28,455,482 | 99.92% | |
| Invalid or blank votes | 22,184 | 0.08% | |
| Total votes | 28,477,666 | 100.00% | |
| Registered voters and turnout | 39,005,781 | 73.01% | |
| Leave: 15,188,406 (53.4%) |
Remain: 13,266,996 (46.6%) | ||
| ▲ | |||
England was broken down into 9 regional count areas using the same regional constituency boundaries as used in European Parliamentary elections.
East Midlands
.svg.png)
| United Kingdom European Union membership referendum, 2016 East Midlands | |||
| Choice | Votes | % | |
|---|---|---|---|
| Leave the European Union | 1,475,479 | 58.82% | |
| Remain a member of the European Union | 1,033,036 | 41.18% | |
| Valid votes | 2,508,515 | 99.92% | |
| Invalid or blank votes | 1,891 | 0.08% | |
| Total votes | 2,510,496 | 100.00% | |
| Registered voters and turnout | 3,384,299 | 74.18% | |
| Source: Electoral Commission | |||
| Leave: 1,475,479 (58.9%) |
Remain: 1,033,036 (41.1%) | ||
| ▲ | |||
The East Midlands region was broken down into 40 voting areas.
| District | Voter turnout, of eligible |
Votes | Proportion of votes | ||
|---|---|---|---|---|---|
| Remain | Leave | Remain | Leave | ||
| Amber Valley | 76.3% | 29,319 | 44,501 | 39.7% | 60.3% |
| Ashfield | 72.8% | 20,179 | 46,720 | 30.2% | 69.8% |
| Bassetlaw | 74.8% | 20,575 | 43,392 | 32.2% | 67.8% |
| Blaby | 76.5% | 22,888 | 33,583 | 40.5% | 59.5% |
| Bolsover | 72.3% | 12,242 | 29,730 | 29.2% | 70.8% |
| Boston | 77.2% | 7,430 | 22,974 | 24.4% | 75.6% |
| Broxtowe | 78.3% | 29,672 | 35,754 | 45.4% | 54.6% |
| Charnwood | 70.4% | 43,500 | 50,672 | 46.2% | 53.8% |
| Chesterfield | 71.9% | 22,946 | 34,478 | 40.0% | 60.0% |
| Corby | 74.1% | 11,470 | 20,611 | 35.8% | 64.2% |
| Daventry | 80.9% | 20,443 | 28,938 | 41.4% | 58.6% |
| Derby | 70.5% | 51,612 | 69,043 | 42.8% | 57.2% |
| Derbyshire Dales | 81.9% | 22,633 | 24,095 | 48.4% | 51.6% |
| East Lindsey | 74.9% | 23,515 | 56,613 | 29.3% | 70.7% |
| East Northamptonshire | 76.9% | 21,680 | 30,894 | 41.2% | 58.8% |
| Erewash | 76.0% | 25,791 | 40,739 | 38.8% | 61.2% |
| Gedling | 76.5% | 30,035 | 37,542 | 44.4% | 55.6% |
| High Peak | 75.6% | 27,116 | 27,717 | 49.5% | 50.5% |
| Harborough | 81.4% | 27,028 | 27,850 | 49.3% | 50.7% |
| Hinckley & Bosworth | 76.7% | 25,969 | 39,501 | 39.7% | 60.3% |
| Kettering | 76.4% | 21,030 | 32,877 | 39.0% | 61.0% |
| Leicester | 65.0% | 70,980 | 67,992 | 51.1% | 48.9% |
| Lincoln | 69.3% | 18,902 | 24,992 | 43.1% | 56.9% |
| Mansfield | 72.6% | 16,417 | 39,927 | 29.1% | 70.9% |
| Melton | 81.3% | 12,695 | 17,610 | 41.9% | 58.1% |
| Newark and Sherwood | 76.8% | 26,571 | 40,516 | 39.6% | 60.4% |
| North East Derbyshire | 75.2% | 22,075 | 37,235 | 37.2% | 62.8% |
| Northampton | 72.6% | 43,805 | 61,454 | 41.6% | 58.4% |
| North Kesteven | 78.4% | 25,570 | 42,183 | 37.7% | 62.3% |
| North West Leicestershire | 77.9% | 22,642 | 34,969 | 39.3% | 60.7% |
| Nottingham | 61.8% | 59,318 | 61,343 | 49.2% | 50.8% |
| Oadby and Wigston | 73.7% | 14,292 | 17,173 | 45.4% | 54.6% |
| Rushcliffe | 81.5% | 40,522 | 29,888 | 57.6% | 42.4% |
| Rutland | 78.1% | 11,353 | 11,613 | 49.4% | 50.6% |
| South Derbyshire | 76.8% | 22,479 | 34,216 | 39.6% | 60.4% |
| South Holland | 75.3% | 13,074 | 36,423 | 26.4% | 73.6% |
| South Kesteven | 78.2% | 33,047 | 49,424 | 40.1% | 59.9% |
| South Northamptonshire | 79.4% | 25,853 | 30,771 | 45.7% | 54.3% |
| Wellingborough | 75.4% | 15,462 | 25,679 | 37.6% | 62.4% |
| West Lindsey | 74.5% | 20,906 | 33,847 | 38.2% | 61.8% |
East of England
.svg.png)
| United Kingdom European Union membership referendum, 2016 East of England | |||
| Choice | Votes | % | |
|---|---|---|---|
| Leave the European Union | 1,880,367 | 56.48% | |
| Remain a member of the European Union | 1,448,616 | 43.52% | |
| Valid votes | 3,328,983 | 99.93% | |
| Invalid or blank votes | 2,329 | 0.07% | |
| Total votes | 3,331,312 | 100.00% | |
| Registered voters and turnout | 4,398,796 | 75.73% | |
| Source: Electoral Commission | |||
| Leave: 1,880,367 (56.5%) |
Remain: 1,448,616 (43.5%) | ||
| ▲ | |||
The East of England region was broken down into 47 voting areas.
| District | Voter turnout, of eligible |
Votes | Proportion of votes | ||
|---|---|---|---|---|---|
| Remain | Leave | Remain | Leave | ||
| Babergh | 78.2% | 25,309 | 29,933 | 45.8% | 54.2% |
| Basildon | 73.8% | 30,748 | 67,251 | 31.4% | 68.6% |
| Bedford | 72.1% | 41,497 | 44,569 | 48.2% | 51.8% |
| Braintree | 76.6% | 33,523 | 52,713 | 38.9% | 61.1% |
| Breckland | 74.3% | 26,313 | 47,235 | 35.8% | 64.2% |
| Brentwood | 79.5% | 19,077 | 27,627 | 40.8% | 59.2% |
| Broadland | 78.3% | 35,469 | 42,268 | 45.6% | 54.4% |
| Broxbourne | 73.7% | 17,166 | 33,706 | 33.7% | 66.3% |
| Cambridge | 72.2% | 42,682 | 15,117 | 73.8% | 26.2% |
| Castle Point | 75.3% | 14,154 | 37,691 | 27.3% | 72.7% |
| Central Bedfordshire | 77.8% | 69,670 | 89,134 | 43.9% | 56.1% |
| Chelmsford | 77.6% | 47,545 | 53,249 | 47.2% | 52.8% |
| Colchester | 75.1% | 44,414 | 51,305 | 46.4% | 53.6% |
| Dacorum | 79.1% | 42,542 | 43,702 | 49.3% | 50.7% |
| East Cambridgeshire | 77.0% | 23,599 | 24,487 | 49.1% | 50.9% |
| East Hertfordshire | 80.3% | 42,372 | 42,994 | 49.6% | 50.4% |
| Epping Forest | 76.8% | 28,676 | 48,176 | 37.3% | 62.7% |
| Fenland | 73.7% | 15,055 | 37,571 | 28.6% | 71.4% |
| Forest Heath | 72.5% | 9,791 | 18,160 | 35.0% | 65.0% |
| Great Yarmouth | 69.0% | 14,284 | 35,844 | 28.5% | 71.5% |
| Harlow | 73.5% | 13,867 | 29,602 | 31.9% | 68.1% |
| Hertsmere | 76.6% | 27,593 | 28,532 | 49.2% | 50.8% |
| Huntingdonshire | 77.8% | 45,729 | 54,198 | 45.8% | 54.2% |
| Ipswich | 72.5% | 27,698 | 38,655 | 41.7% | 58.3% |
| King's Lynn and West Norfolk | 74.7% | 28,587 | 56,493 | 33.6% | 66.4% |
| Luton | 66.2% | 36,708 | 47,773 | 43.5% | 56.5% |
| Maldon | 79.1% | 14,529 | 24,302 | 37.4% | 62.6% |
| Mid Suffolk | 78.1% | 27,391 | 33,794 | 44.8% | 55.2% |
| North Hertfordshire | 78.2% | 42,234 | 35,438 | 54.4% | 45.6% |
| North Norfolk | 76.8% | 26,214 | 37,576 | 41.1% | 58.9% |
| Norwich | 69.1% | 37,326 | 29,040 | 56.2% | 43.8% |
| Peterborough | 72.3% | 34,176 | 53,216 | 39.1% | 60.9% |
| Rochford | 78.8% | 17,510 | 34,937 | 33.4% | 66.6% |
| South Cambridgeshire | 81.2% | 56,128 | 37,061 | 60.2% | 39.8% |
| Southend-on-Sea | 72.8% | 39,348 | 54,522 | 41.9% | 58.1% |
| South Norfolk | 78.5% | 38,817 | 41,541 | 48.3% | 51.7% |
| St Albans | 82.4% | 54,208 | 32,237 | 62.7% | 37.3% |
| St. Edmundsbury | 76.7% | 26,986 | 35,224 | 43.4% | 56.6% |
| Stevenage | 73.7% | 18,659 | 27,126 | 40.8% | 59.2% |
| Suffolk Coastal | 80.6% | 37,218 | 41,966 | 47.0% | 53.0% |
| Tendring | 74.4% | 25,210 | 57,447 | 30.5% | 69.5% |
| Three Rivers | 78.4% | 25,751 | 27,097 | 48.7% | 51.3% |
| Thurrock | 72.7% | 22,151 | 57,765 | 27.7% | 72.3% |
| Uttlesford | 80.2% | 25,619 | 26,324 | 49.3% | 50.7% |
| Watford | 71.6% | 23,167 | 23,419 | 49.7% | 50.3% |
| Waveney | 72.6% | 24,356 | 41,290 | 37.1% | 62.9% |
| Welwyn Hatfield | 75.0% | 27,550 | 31,060 | 47.0% | 53.0% |
Greater London
.svg.png)
| United Kingdom European Union membership referendum, 2016 Greater London | |||
| Choice | Votes | % | |
|---|---|---|---|
| Remain a member of the European Union | 2,263,519 | 59.93% | |
| Leave the European Union | 1,513,232 | 40.07% | |
| Valid votes | 3,776,751 | 99.88% | |
| Invalid or blank votes | 4,453 | 0.12% | |
| Total votes | 3,781,204 | 100.00% | |
| Registered voters and turnout | 5,424,768 | 69.70% | |
| Source: Electoral Commission | |||
| Leave: 1,513,232 (40.1%) |
Remain: 2,263,519 (59.9%) | ||
| ▲ | |||
The Greater London region was broken down into 33 voting areas.
| District | Voter turnout, of eligible |
Votes | Proportion of votes | ||
|---|---|---|---|---|---|
| Remain | Leave | Remain | Leave | ||
| Barking and Dagenham | 63.8% | 27,750 | 46,130 | 37.6% | 62.4% |
| Barnet | 72.1% | 100,210 | 60,823 | 62.2% | 37.8% |
| Bexley | 75.2% | 47,603 | 80,886 | 37.0% | 63.0% |
| Brent | 65.0% | 72,523 | 48,881 | 59.7% | 40.3% |
| Bromley | 78.8% | 92,398 | 90,034 | 50.6% | 49.4% |
| Camden | 65.4% | 71,295 | 23,838 | 74.9% | 25.1% |
| City of London | 73.5% | 3,312 | 1,087 | 75.3% | 24.7% |
| City of Westminster | 64.9% | 53,928 | 24,268 | 69.0% | 31.0% |
| Croydon | 69.8% | 92,913 | 78,221 | 54.3% | 45.7% |
| Ealing | 70.0% | 90,024 | 59,017 | 60.4% | 39.6% |
| Enfield | 69.0% | 76,425 | 60,481 | 55.8% | 44.2% |
| Greenwich | 69.5% | 65,248 | 52,117 | 55.6% | 44.4% |
| Hackney | 65.1% | 83,398 | 22,868 | 78.5% | 21.5% |
| Haringey | 70.5% | 79,991 | 25,855 | 75.6% | 24.4% |
| Harrow | 72.2% | 64,042 | 53,183 | 54.6% | 45.4% |
| Hammersmith and Fulham | 69.9% | 56,188 | 24,054 | 70.0% | 30.0% |
| Havering | 76.0% | 42,201 | 96,885 | 30.3% | 69.7% |
| Hillingdon | 68.9% | 58,040 | 74,982 | 43.6% | 56.4% |
| Hounslow | 69.7% | 58,755 | 56,321 | 51.1% | 48.9% |
| Islington | 70.3% | 76,420 | 25,180 | 75.2% | 24.8% |
| Kensington and Chelsea | 65.9% | 37,601 | 17,138 | 68.7% | 31.3% |
| Kingston upon Thames | 78.3% | 52,533 | 32,737 | 61.6% | 38.4% |
| Lambeth | 67.3% | 111,584 | 30,340 | 78.6% | 21.4% |
| Lewisham | 63.0% | 86,955 | 37,518 | 69.9% | 30.1% |
| Merton | 73.4% | 63,003 | 37,097 | 62.9% | 37.1% |
| Newham | 59.2% | 55,328 | 49,371 | 52.8% | 47.2% |
| Redbridge | 67.5% | 69,213 | 59,020 | 54.0% | 46.0% |
| Richmond upon Thames | 82.0% | 75,396 | 33,410 | 69.3% | 30.7% |
| Southwark | 66.1% | 94,293 | 35,209 | 72.8% | 27.2% |
| Sutton | 76.0% | 49,319 | 57,241 | 46.3% | 53.7% |
| Tower Hamlets | 64.5% | 73,011 | 35,224 | 67.5% | 32.5% |
| Waltham Forest | 66.6% | 64,156 | 44,395 | 59.1% | 40.9% |
| Wandsworth | 71.9% | 118,463 | 39,421 | 75.0% | 25.0% |
North East England
.svg.png)
| United Kingdom European Union membership referendum, 2016 North East England | |||
| Choice | Votes | % | |
|---|---|---|---|
| Leave the European Union | 778,103 | 58.04% | |
| Remain a member of the European Union | 562,595 | 41.96% | |
| Valid votes | 1,340,698 | 99.95% | |
| Invalid or blank votes | 689 | 0.05% | |
| Total votes | 1,341,387 | 100.00% | |
| Registered voters and turnout | 1,934,341 | 69.35% | |
| Source: Electoral Commission | |||
| Leave: 778,103 (58%) |
Remain: 562,595 (42%) | ||
| ▲ | |||
The North East England region was broken down into 12 voting areas.
| District | Voter turnout, of eligible |
Votes | Proportion of votes | ||
|---|---|---|---|---|---|
| Remain | Leave | Remain | Leave | ||
| Darlington | 71.0% | 24,172 | 30,994 | 43.8% | 56.2% |
| County Durham | 68.7% | 113,521 | 153,877 | 42.5% | 57.5% |
| Gateshead | 70.6% | 44,429 | 58,529 | 43.2% | 57.8% |
| Hartlepool | 65.5% | 14,029 | 32,071 | 30.4% | 69.6% |
| Middlesbrough | 64.9% | 21,181 | 40,177 | 34.5% | 65.5% |
| Newcastle upon Tyne | 67.6% | 65,405 | 63,598 | 50.7% | 49.3% |
| North Tyneside | 72.3% | 52,873 | 60,589 | 46.6% | 53.4% |
| Northumberland | 74.3% | 82,022 | 96,699 | 45.9% | 54.1% |
| Redcar and Cleveland | 70.2% | 24,586 | 48,128 | 33.8% | 66.2% |
| South Tyneside | 68.2% | 30,014 | 49,065 | 38.0% | 62.0% |
| Stockton-on-Tees | 71.0% | 38,433 | 61,982 | 38.3% | 61.7% |
| Sunderland | 64.8% | 51,930 | 82,394 | 38.7% | 61.3% |
North West England
.svg.png)
| United Kingdom European Union membership referendum, 2016 North West England | |||
| Choice | Votes | % | |
|---|---|---|---|
| Leave the European Union | 1,966,925 | 53.65% | |
| Remain a member of the European Union | 1,699,020 | 46.35% | |
| Valid votes | 3,665,945 | 99.93% | |
| Invalid or blank votes | 2,682 | 0.07% | |
| Total votes | 3,668,627 | 100.00% | |
| Registered voters and turnout | 5,241,568 | 69.99% | |
| Source: Electoral Commission | |||
| Leave: 1,966,925 (53.7%) |
Remain: 1,699,020 (46.3%) | ||
| ▲ | |||
The North West England region was broken down into 39 voting areas.
| District | Voter turnout, of eligible |
Votes | Proportion of votes | ||
|---|---|---|---|---|---|
| Remain | Leave | Remain | Leave | ||
| Allerdale | 72.9% | 22,429 | 31,809 | 41.4% | 58.6% |
| Barrow-in-Furness | 67.8% | 14,207 | 21,867 | 39.4% | 60.6% |
| Blackburn with Darwen | 65.2% | 28,522 | 36,799 | 43.7% | 56.3% |
| Blackpool | 65.4% | 21,781 | 45,146 | 32.5% | 67.5% |
| Bolton | 70.1% | 57,589 | 80,491 | 41.7% | 58.3% |
| Burnley | 67.2% | 14,462 | 28,854 | 33.4% | 66.6% |
| Bury | 71.3% | 46,354 | 54,674 | 45.9% | 54.1% |
| Carlisle | 74.5% | 23,788 | 35,895 | 39.9% | 60.1% |
| Cheshire East | 77.3% | 107,962 | 113,163 | 48.8% | 51.2% |
| Cheshire West and Chester | 74.5% | 95,455 | 98,082 | 49.3% | 50.7% |
| Chorley | 75.5% | 27,417 | 36,098 | 43.2% | 56.8% |
| Copeland | 70.0% | 14,419 | 23,528 | 38.0% | 62.0% |
| Eden | 75.7% | 14,807 | 16,911 | 46.7% | 53.3% |
| Fylde | 75.5% | 19,889 | 26,317 | 43.0% | 57.0% |
| Halton | 68.2% | 27,678 | 37,327 | 42.6% | 57.4% |
| Hyndburn | 64.7% | 13,569 | 26,568 | 33.8% | 66.2% |
| Knowsley | 63.5% | 34,345 | 36,558 | 48.4% | 51.6% |
| Lancaster | 72.6% | 35,732 | 37,309 | 48.9% | 51.1% |
| Liverpool | 64.0% | 118,453 | 85,101 | 58.2% | 41.8% |
| Manchester | 59.7% | 121,823 | 79,991 | 60.4% | 39.6% |
| Oldham | 67.9% | 42,034 | 65,369 | 39.1% | 60.9% |
| Pendle | 70.2% | 16,704 | 28,631 | 36.8% | 63.2% |
| Preston | 68.7% | 30,227 | 34,518 | 46.7% | 53.3% |
| Ribble Valley | 79.0% | 15,892 | 20,550 | 43.6% | 56.4% |
| Rochdale | 65.9% | 41,217 | 62,014 | 39.9% | 60.1% |
| Rossendale | 72.4% | 15,012 | 23,169 | 39.3% | 60.7% |
| Salford | 63.2% | 47,430 | 62,385 | 43.2% | 56.8% |
| Sefton | 71.7% | 76,702 | 71,176 | 51.9% | 48.1% |
| South Lakeland | 79.7% | 34,531 | 30,800 | 52.9% | 47.1% |
| South Ribble | 75.3% | 26,406 | 37,318 | 41.4% | 58.6% |
| St. Helens | 68.8% | 39,322 | 54,357 | 42.0% | 58.0% |
| Stockport | 74.9% | 85,559 | 77,930 | 52.5% | 47.5% |
| Tameside | 66.0% | 43,118 | 67,829 | 38.9% | 61.1% |
| Trafford | 75.8% | 72,293 | 53,018 | 57.7% | 42.3% |
| Warrington | 73.3% | 52,657 | 62,487 | 45.7% | 54.3% |
| West Lancashire | 74.4% | 28,546 | 35,323 | 44.7% | 55.3% |
| Wigan | 69.2% | 58,942 | 104,331 | 36.1% | 63.9% |
| Wirral | 70.9% | 88,931 | 83,069 | 51.7% | 48.3% |
| Wyre | 74.6% | 22,816 | 40,163 | 36.2% | 63.8% |
South East England
.svg.png)
| United Kingdom European Union membership referendum, 2016 South East England | |||
| Choice | Votes | % | |
|---|---|---|---|
| Leave the European Union | 2,567,965 | 51.78% | |
| Remain a member of the European Union | 2,391,718 | 48.22% | |
| Valid votes | 4,959,683 | 99.93% | |
| Invalid or blank votes | 3,427 | 0.07% | |
| Total votes | 4,963,110 | 100.00% | |
| Registered voters and turnout | 6,465,404 | 76.76% | |
| Source: Electoral Commission | |||
| Leave: 2,567,965 (51.8%) |
Remain: 2,391,718 (48.2%) | ||
| ▲ | |||
The South East England region was broken down into 67 voting areas.
| District | Voter turnout, of eligible |
Votes | Proportion of votes | ||
|---|---|---|---|---|---|
| Remain | Leave | Remain | Leave | ||
| Adur | 76.4% | 16,914 | 20,315 | 45.4% | 54.6% |
| Arun | 77.8% | 34,193 | 56,936 | 37.5% | 62.5% |
| Ashford | 77.1% | 28,314 | 41,472 | 40.6% | 59.4% |
| Aylesbury Vale | 78.4% | 52,877 | 53,956 | 49.5% | 50.5% |
| Basingstoke and Deane | 78.0% | 48,257 | 52,071 | 48.1% | 51.9% |
| Bracknell Forest | 76.1% | 29,888 | 35,002 | 46.1% | 53.9% |
| Brighton & Hove | 74.0% | 100,648 | 46,027 | 68.6% | 31.4% |
| Canterbury | 75.0% | 40,169 | 41,879 | 49.0% | 51.0% |
| Cherwell | 75.5% | 40,668 | 41,168 | 49.7% | 50.3% |
| Chichester | 77.8% | 35,011 | 36,326 | 49.1% | 50.9% |
| Chiltern | 83.5% | 32,241 | 26,363 | 55.0% | 45.0% |
| Crawley | 73.2% | 22,388 | 31,447 | 41.6% | 58.4% |
| Dartford | 75.5% | 19,985 | 35,870 | 35.8% | 64.2% |
| Dover | 76.5% | 24,606 | 40,410 | 37.8% | 62.2% |
| Eastbourne | 74.7% | 22,845 | 30,700 | 42.7% | 57.3% |
| Eastleigh | 78.2% | 36,172 | 39,902 | 47.5% | 52.5% |
| East Hampshire | 81.6% | 37,346 | 36,576 | 50.5% | 49.5% |
| Elmbridge | 78.1% | 45,841 | 31,162 | 59.5% | 40.5% |
| Epsom and Ewell | 80.4% | 23,596 | 21,707 | 52.1% | 47.9% |
| Fareham | 79.6% | 32,210 | 39,525 | 44.9% | 55.1% |
| Gosport | 73.5% | 16,671 | 29,456 | 36.1% | 63.9% |
| Gravesham | 74.9% | 18,876 | 35,643 | 34.6% | 65.4% |
| Guildford | 76.9% | 44,155 | 34,458 | 56.2% | 43.8% |
| Hart | 82.6% | 30,282 | 27,513 | 52.4% | 47.6% |
| Hastings | 71.6% | 20,011 | 24,339 | 45.1% | 54.9% |
| Havant | 74.1% | 26,582 | 44,047 | 37.6% | 62.4% |
| Horsham | 81.6% | 43,785 | 41,303 | 51.5% | 48.5% |
| Isle of Wight | 72.3% | 30,207 | 49,173 | 38.1% | 61.9% |
| Lewes | 77.8% | 30,974 | 28,508 | 52.1% | 47.9% |
| Maidstone | 76.0% | 36,762 | 52,365 | 41.2% | 58.8% |
| Medway | 72.1% | 49,889 | 88,997 | 35.9% | 64.1% |
| Mid Sussex | 80.7% | 46,471 | 41,057 | 53.1% | 46.9% |
| Milton Keynes | 73.6% | 63,393 | 67,063 | 48.6% | 51.4% |
| Mole Valley | 82.1% | 29,088 | 25,708 | 53.1% | 46.9% |
| New Forest | 79.2% | 47,199 | 64,541 | 42.2% | 57.8% |
| Oxford | 72.3% | 49,424 | 20,913 | 70.3% | 29.7% |
| Portsmouth | 70.3% | 41,384 | 57,336 | 41.9% | 58.1% |
| Reading | 72.5% | 43,385 | 31,382 | 58.0% | 42.0% |
| Reigate and Banstead | 78.2% | 40,181 | 40,980 | 49.5% | 50.5% |
| Rother | 79.3% | 23,916 | 33,753 | 41.5% | 58.5% |
| Runnymede | 76.0% | 20,259 | 24,035 | 45.7% | 54.3% |
| Rushmoor | 74.1% | 20,384 | 28,396 | 41.8% | 58.2% |
| Sevenoaks | 80.6% | 32,091 | 38,258 | 45.6% | 54.4% |
| Shepway | 74.9% | 22,884 | 37,729 | 37.8% | 62.2% |
| Slough | 62.1% | 24,911 | 29,631 | 45.7% | 54.3% |
| Southampton | 68.1% | 49,738 | 57,927 | 46.2% | 53.8% |
| South Bucks | 78.0% | 20,077 | 20,647 | 49.3% | 50.7% |
| South Oxfordshire | 80.7% | 46,245 | 37,865 | 55.0% | 45.0% |
| Spelthorne | 77.9% | 22,474 | 34,135 | 39.7% | 60.3% |
| Surrey Heath | 79.8% | 25,638 | 26,667 | 49.0% | 51.0% |
| Swale | 74.2% | 28,481 | 47,388 | 37.5% | 62.5% |
| Tandridge | 80.3% | 24,251 | 27,169 | 47.2% | 52.8% |
| Test Valley | 79.6% | 36,170 | 39,091 | 48.1% | 51.9% |
| Thanet | 72.7% | 26,065 | 46,037 | 36.2% | 63.8% |
| Tonbridge and Malling | 79.6% | 32,792 | 41,229 | 44.3% | 55.7% |
| Tunbridge Wells | 79.1% | 35,676 | 29,320 | 54.9% | 45.1% |
| Vale of White Horse | 81.1% | 43,462 | 33,192 | 56.7% | 43.3% |
| Waverley | 82.3% | 44,341 | 31,601 | 58.4% | 41.6% |
| Wealden | 80.0% | 44,084 | 52,808 | 45.5% | 54.5% |
| West Berkshire | 79.9% | 48,300 | 44,977 | 51.8% | 48.2% |
| West Oxfordshire | 79.7% | 35,236 | 30,435 | 53.7% | 46.3% |
| Winchester | 81.2% | 42,878 | 29,886 | 58.9% | 41.1% |
| Windsor and Maidenhead | 79.7% | 44,086 | 37,706 | 53.9% | 46.1% |
| Woking | 77.4% | 31,007 | 24,214 | 56.2% | 43.8% |
| Wokingham | 79.2% | 55,272 | 42,229 | 56.7% | 43.3% |
| Worthing | 75.4% | 28,851 | 32,515 | 47.0% | 53.0% |
| Wycombe | 75.7% | 49,261 | 45,529 | 52.0% | 48.0% |
South West England (including Gibraltar)
.svg.png)
| United Kingdom European Union membership referendum, 2016 South West England (including Gibraltar) | |||
| Choice | Votes | % | |
|---|---|---|---|
| Leave the European Union | 1,669,711 | 52.62% | |
| Remain a member of the European Union | 1,503,019 | 47.37% | |
| Valid votes | 3,172,730 | 99.93% | |
| Invalid or blank votes | 2,179 | 0.07% | |
| Total votes | 3,174,909 | 100.00% | |
| Registered voters and turnout | 4,138,134 | 73.01% | |
| Source: Electoral Commission | |||
| Leave: 1,669,711 (52.6%) |
Remain: 1,503,019 (47.4%) | ||
| ▲ | |||
The South West England region was broken down into 38 voting areas.
| District | Voter turnout, of eligible |
Votes | Proportion of votes | ||
|---|---|---|---|---|---|
| Remain | Leave | Remain | Leave | ||
| Bath and North East Somerset | 77.1% | 60,878 | 44,352 | 57.9% | 42.1% |
| Bournemouth | 69.2% | 41,473 | 50,453 | 45.1% | 54.9% |
| Bristol | 73.1% | 141,027 | 87,418 | 61.7% | 38.3% |
| Cheltenham | 75.8% | 37,081 | 28,932 | 56.2% | 43.8% |
| Christchurch | 79.3% | 12,782 | 18,268 | 41.2% | 58.8% |
| Cornwall | 77.0% | 140,540 | 182,665 | 43.5% | 56.5% |
| Cotswold | 79.8% | 28,015 | 26,806 | 51.1% | 48.9% |
| East Devon | 78.9% | 40,743 | 48,040 | 45.9% | 54.1% |
| East Dorset | 81.3% | 24,786 | 33,702 | 42.4% | 57.6% |
| Exeter | 73.8% | 35,270 | 28,533 | 55.3% | 44.7% |
| Forest of Dean | 77.4% | 21,392 | 30,251 | 41.4% | 58.6% |
| Gloucester | 72.0% | 26,801 | 37,776 | 41.5% | 58.5% |
| Isles of Scilly | 79.2% | 803 | 621 | 56.4% | 43.6% |
| Mendip | 76.9% | 33,427 | 32,028 | 51.1% | 48.9% |
| Mid Devon | 79.3% | 22,400 | 25,606 | 46.7% | 53.3% |
| North Dorset | 79.7% | 18,399 | 23,802 | 43.6% | 56.4% |
| North Devon | 76.8% | 24,931 | 33,100 | 43.0% | 57.0% |
| North Somerset | 77.4% | 59,572 | 64,976 | 47.8% | 52.2% |
| Plymouth | 71.4% | 53,458 | 79,997 | 40.1% | 59.9% |
| Poole | 75.3% | 35,741 | 49,707 | 41.8% | 58.2% |
| Purbeck | 78.9% | 11,754 | 16,966 | 40.9% | 59.1% |
| Sedgemoor | 76.3% | 26,545 | 41,869 | 38.8% | 61.2% |
| South Gloucestershire | 76.2% | 74,928 | 83,405 | 47.3% | 52.7% |
| South Hams | 80.2% | 29,308 | 26,142 | 52.9% | 47.1% |
| South Somerset | 78.6% | 42,527 | 56,940 | 42.8% | 57.2% |
| Stroud | 80.0% | 40,446 | 33,618 | 54.6% | 45.4% |
| Swindon | 75.8% | 51,220 | 61,745 | 45.3% | 54.7% |
| Taunton Deane | 78.1% | 30,944 | 34,789 | 47.1% | 52.9% |
| Teignbridge | 79.3% | 37,949 | 44,363 | 46.1% | 53.9% |
| Tewkesbury | 79.1% | 25,084 | 28,568 | 46.8% | 53.2% |
| Torbay | 73.6% | 27,935 | 47,889 | 36.8% | 63.2% |
| Torridge | 78.3% | 16,229 | 25,200 | 39.2% | 60.8% |
| West Dorset | 79.4% | 31,924 | 33,267 | 49.0% | 51.0% |
| West Devon | 81.2% | 16,658 | 18,937 | 46.8% | 53.2% |
| West Somerset | 79.1% | 8,566 | 13,168 | 39.4% | 60.6% |
| Wiltshire | 78.8% | 137,258 | 151,637 | 47.5% | 52.5% |
| Weymouth and Portland | 75.8% | 14,903 | 23,352 | 39.0% | 61.0% |
Gibraltar
For the purposes of this referendum and as had been the case with previous European Parliamentary elections, the overseas territory of Gibraltar was a single voting area placed in the South West England constituency. It is the first time the territory has taken part in any UK-wide referendum as it did not participate in either the original 1975 EC Referendum or the 2011 AV Referendum as Gibraltar does not send any Members of Parliament to the House of Commons in Westminster.
| Overseas Territory | Voter turnout, of eligible |
Votes | Proportion of votes | ||
|---|---|---|---|---|---|
| Remain | Leave | Remain | Leave | ||
| Gibraltar | 83.6% | 19,322 | 823 | 95.9% | 4.1% |
West Midlands
.svg.png)
| United Kingdom European Union membership referendum, 2016 West Midlands | |||
| Choice | Votes | % | |
|---|---|---|---|
| Leave the European Union | 1,755,687 | 59.26% | |
| Remain a member of the European Union | 1,207,175 | 40.74% | |
| Valid votes | 2,962,862 | 99.92% | |
| Invalid or blank votes | 2,507 | 0.08% | |
| Total votes | 2,965,369 | 100.00% | |
| Registered voters and turnout | 4,116,572 | 72.03% | |
| Source: Electoral Commission | |||
| Leave: 1,755,687 (59.3%) |
Remain: 1,207,175 (40.7%) | ||
| ▲ | |||
The West Midlands region was broken down into 30 voting areas.
| District | Voter turnout, of eligible |
Votes | Proportion of votes | ||
|---|---|---|---|---|---|
| Remain | Leave | Remain | Leave | ||
| Birmingham | 63.7% | 223,451 | 227,251 | 49.6% | 50.4% |
| Bromsgrove | 79.3% | 26,252 | 32,563 | 44.6% | 55.4% |
| Cannock Chase | 71.4% | 16,684 | 36,894 | 31.1% | 68.9% |
| Coventry | 69.2% | 67,967 | 85,097 | 44.4% | 55.6% |
| Dudley | 71.7% | 56,780 | 118,446 | 32.4% | 67.6% |
| East Staffordshire | 74.3% | 22,850 | 39,266 | 36.8% | 63.2% |
| Herefordshire | 78.3% | 44,148 | 64,122 | 40.8% | 59.2% |
| Lichfield | 78.7% | 26,064 | 37,214 | 41.2% | 58.8% |
| Malvern Hills | 80.5% | 23,203 | 25,294 | 47.8% | 52.2% |
| Newcastle-under-Lyme | 74.3% | 25,477 | 43,457 | 37.0% | 63.0% |
| North Warwickshire | 76.2% | 12,569 | 25,385 | 33.1% | 66.9% |
| Nuneaton and Bedworth | 74.3% | 23,736 | 46,095 | 34.0% | 66.0% |
| Redditch | 75.2% | 17,303 | 28,579 | 37.7% | 62.3% |
| Rugby | 79.0% | 25,350 | 33,199 | 43.3% | 56.7% |
| Sandwell | 66.5% | 49,004 | 98,250 | 33.3% | 66.7% |
| Shropshire | 77.3% | 78,987 | 104,166 | 43.1% | 56.9% |
| Solihull | 76.0% | 53,466 | 68,484 | 43.8% | 56.2% |
| South Staffordshire | 77.8% | 23,444 | 43,248 | 35.2% | 64.8% |
| Stafford | 77.8% | 34,098 | 43,386 | 44.0% | 56.0% |
| Staffordshire Moorlands | 75.3% | 21,076 | 38,684 | 35.3% | 64.7% |
| Stoke-on-Trent | 65.7% | 36,027 | 81,563 | 30.6% | 69.4% |
| Stratford-on-Avon | 80.8% | 38,341 | 40,817 | 48.4% | 51.6% |
| Tamworth | 74.1% | 13,705 | 28,424 | 32.5% | 67.5% |
| Telford and Wrekin | 72.1% | 32,954 | 56,649 | 36.8% | 63.2% |
| Walsall | 69.6% | 43,572 | 92,007 | 32.1% | 67.9% |
| Warwick | 79.2% | 47,976 | 33,642 | 58.8% | 41.2% |
| Wolverhampton | 67.5% | 44,138 | 73,798 | 37.4% | 62.6% |
| Worcester | 73.8% | 25,125 | 29,114 | 46.3% | 53.7% |
| Wychavon | 80.8% | 32,188 | 44,201 | 42.1% | 57.9% |
| Wyre Forest | 74.0% | 21,240 | 36,392 | 36.9% | 63.1% |
Yorkshire and the Humber
.svg.png)
| United Kingdom European Union membership referendum, 2016 Yorkshire and the Humber | |||
| Choice | Votes | % | |
|---|---|---|---|
| Leave the European Union | 1,580,937 | 57.71% | |
| Remain a member of the European Union | 1,158,298 | 42.29% | |
| Valid votes | 2,739,235 | 99.93% | |
| Invalid or blank votes | 1,937 | 0.07% | |
| Total votes | 2,741,172 | 100.00% | |
| Registered voters and turnout | 3,877,780 | 70.69% | |
| Source: Electoral Commission | |||
| Leave: 1,580,937 (57.7%) |
Remain: 1,158,298 (42.3%) | ||
| ▲ | |||
The Yorkshire and the Humber region was broken down into 21 voting areas.
| District | Voter turnout, of eligible |
Votes | Proportion of votes | ||
|---|---|---|---|---|---|
| Remain | Leave | Remain | Leave | ||
| Barnsley | 69.9% | 38,951 | 83,958 | 31.7% | 68.3% |
| Bradford | 66.7% | 104,575 | 123,913 | 45.8% | 54.2% |
| Calderdale | 71.0% | 46,950 | 58,975 | 44.3% | 55.7% |
| Craven | 81.0% | 16,930 | 18,961 | 47.2% | 52.8% |
| Doncaster | 69.5% | 46,922 | 104,260 | 31.0% | 69.0% |
| East Riding of Yorkshire | 74.9% | 78,779 | 120,136 | 39.6% | 60.4% |
| Hambleton | 78.4% | 25,480 | 29,502 | 46.3% | 53.7% |
| Harrogate | 78.8% | 48,211 | 46,374 | 51.0% | 49.0% |
| Kingston upon Hull | 62.9% | 36,709 | 76,646 | 32.4% | 67.6% |
| Kirklees | 70.8% | 98,485 | 118,755 | 45.3% | 54.7% |
| Leeds | 71.3% | 194,863 | 192,474 | 50.3% | 49.7% |
| North East Lincolnshire | 67.9% | 23,797 | 55,185 | 30.1% | 69.9% |
| North Lincolnshire | 71.9% | 29,947 | 58,915 | 33.7% | 66.3% |
| Richmondshire | 75.1% | 11,945 | 15,691 | 43.2% | 56.8% |
| Rotherham | 69.5% | 44,115 | 93,272 | 32.1% | 67.9% |
| Ryedale | 77.2% | 14,340 | 17,710 | 44.7% | 55.3% |
| Scarborough | 73.0% | 22,999 | 37,512 | 38.0% | 62.0% |
| Selby | 79.1% | 21,071 | 30,532 | 40.8% | 59.2% |
| Sheffield | 67.3% | 130,735 | 136,018 | 49.0% | 51.0% |
| Wakefield | 71.1% | 58,877 | 116,165 | 33.6% | 66.4% |
| York | 70.6% | 63,617 | 45,983 | 58.0% | 42.0% |
Northern Ireland
Northern Ireland was a single voting area, as well as being a regional count although local totals were announced in each of the Westminister parliamentary constituency areas within Northern Ireland.[3]
.svg.png)
| United Kingdom European Union membership referendum, 2016 Northern Ireland | |||
| Choice | Votes | % | |
|---|---|---|---|
| Remain a member of the European Union | 440,707 | 55.78% | |
| Leave the European Union | 349,442 | 44.22% | |
| Valid votes | 790,149 | 99.95% | |
| Invalid or blank votes | 374 | 0.05% | |
| Total votes | 790,523 | 100.00% | |
| Registered voters and turnout | 1,260,955 | 62.69% | |
| Source: Electoral Commission | |||
| Leave: 349,442 (44.2%) |
Remain: 470,707 (55.8%) | ||
| ▲ | |||
Northern Ireland local totals by Parliamentary constituencies.
| Constituency | Voter turnout, of eligible |
Votes | Proportion of votes | ||
|---|---|---|---|---|---|
| Remain | Leave | Remain | Leave | ||
| Belfast East | 65.8% | 20,728 | 21,918 | 48.6% | 51.4% |
| Belfast North | 57.5% | 20,128 | 19,844 | 50.4% | 49.6% |
| Belfast South | 67.6% | 30,960 | 13,596 | 69.5% | 30.5% |
| Belfast West | 48.9% | 23,099 | 8,092 | 74.1% | 25.9% |
| East Antrim | 65.2% | 18,616 | 22,929 | 44.8% | 55.2% |
| East Londonderry | 59.7% | 21,098 | 19,455 | 52.0% | 48.0% |
| Fermanagh and South Tyrone | 67.8% | 28,200 | 19,958 | 58.6% | 41.4% |
| Foyle | 57.4% | 32,064 | 8,905 | 78.3% | 21.7% |
| Lagan Valley | 66.6% | 22,710 | 25,704 | 46.9% | 53.1% |
| Mid Ulster | 61.6% | 25,612 | 16,799 | 60.4% | 39.6% |
| Newry and Armagh | 63.9% | 31,963 | 18,659 | 62.9% | 36.9% |
| North Antrim | 64.9% | 18,782 | 30,938 | 37.8% | 62.2% |
| North Down | 67.7% | 23,131 | 21,046 | 52.4% | 47.6% |
| South Antrim | 63.1% | 21,498 | 22,055 | 49.4% | 50.6% |
| South Down | 62.2% | 32,076 | 15,625 | 67.2% | 32.8% |
| Strangford | 64.5% | 18,727 | 23,383 | 44.5% | 55.5% |
| Upper Bann | 63.6% | 24,550 | 27,262 | 47.4% | 52.6% |
| West Tyrone | 61.8% | 26,765 | 13,274 | 66.8% | 33.2% |
Scotland
.svg.png)
The Scottish council areas were used as the voting areas for the referendum throughout Scotland.
| United Kingdom European Union membership referendum, 2016 Scotland | |||
| Choice | Votes | % | |
|---|---|---|---|
| Remain a member of the European Union | 1,661,191 | 62.00% | |
| Leave the European Union | 1,018,322 | 38.00% | |
| Valid votes | 2,679,513 | 99.94% | |
| Invalid or blank votes | 1,666 | 0.06% | |
| Total votes | 2,681,179 | 100.00% | |
| Registered voters and turnout | 3,987,112 | 67.25% | |
| Source: Electoral Commission | |||
| Leave: 1,018,322 (38%) |
Remain: 1,661,191 (62%) | ||
| ▲ | |||
Scotland was broken down into 32 voting areas.
| Council area | Voter turnout, of eligible |
Votes | Proportion of votes | ||
|---|---|---|---|---|---|
| Remain | Leave | Remain | Leave | ||
| Aberdeen City | 67.9% | 63,985 | 40,729 | 61.1% | 38.9% |
| Aberdeenshire | 70.6% | 76,445 | 62,516 | 55.0% | 45.0% |
| Angus | 68.0% | 32,747 | 26,511 | 55.3% | 44.7% |
| Argyll and Bute | 73.1% | 29,494 | 19,202 | 60.6% | 39.4% |
| Clackmannanshire | 67.2% | 14,691 | 10,736 | 57.8% | 42.2% |
| Dumfries and Galloway | 71.4% | 43,864 | 38,803 | 53.1% | 46.9% |
| Dundee City | 62.9% | 39,688 | 26,697 | 59.8% | 40.2% |
| East Ayrshire | 62.9% | 33,891 | 23,942 | 58.6% | 41.4% |
| East Dunbartonshire | 75.1% | 44,534 | 17,840 | 71.4% | 28.6% |
| East Lothian | 71.7% | 36,026 | 19,738 | 64.6% | 35.4% |
| East Renfrewshire | 76.1% | 39,345 | 13,596 | 74.3% | 25.7% |
| City of Edinburgh | 72.9% | 187,796 | 64,498 | 74.4% | 25.6% |
| Falkirk | 67.5% | 44,987 | 34,271 | 56.8% | 43.2% |
| Fife | 66.7% | 106,754 | 75,466 | 58.6% | 41.4% |
| Glasgow City | 56.2% | 168,335 | 84,474 | 66.6% | 33.4% |
| Highland | 71.6% | 70,308 | 55,349 | 56.0% | 44.0% |
| Inverclyde | 66.0% | 24,688 | 14,010 | 63.8% | 36.2% |
| Midlothian | 68.1% | 28,217 | 17,251 | 62.1% | 37.9% |
| Moray | 67.4% | 24,114 | 23,992 | 50.1% | 49.9% |
| North Ayrshire | 64.6% | 38,394 | 29,110 | 56.9% | 43.1% |
| North Lanarkshire | 60.9% | 95,549 | 59,400 | 61.7% | 38.3% |
| Perth and Kinross | 73.7% | 49,641 | 31,614 | 61.1% | 38.9% |
| Renfrewshire | 69.2% | 57,119 | 31,010 | 64.8% | 35.2% |
| Scottish Borders | 73.4% | 37,952 | 26,962 | 58.5% | 41.5% |
| Stirling | 74.0% | 33,112 | 15,787 | 67.7% | 32.3% |
| South Lanarkshire | 65.3% | 102,568 | 60,024 | 63.1% | 36.9% |
| South Ayrshire | 69.8% | 36,265 | 25,241 | 59.0% | 41.0% |
| West Dunbartonshire | 63.9% | 26,794 | 16,426 | 62.0% | 38.0% |
| West Lothian | 67.6% | 51,560 | 36,948 | 58.3% | 41.7% |
| Na h-Eileanan Siar (Western Isles) | 70.1% | 8,232 | 6,671 | 55.2% | 44.8% |
| Orkney | 68.3% | 7,189 | 4,193 | 63.2% | 36.8% |
| Shetland | 70.3% | 6,907 | 5,315 | 56.5% | 43.5% |
While all council counting areas show a majority to remain, one constituency, Banff and Buchan, voted to leave by an estimated ratio of 54% to 46%.[7][8] Voting to leave the EU was most concentrated around the north coast of Aberdeenshire between the fishing towns of Banff and Peterhead, where there were 23,707 Leave votes to 14,918 Remain votes (61% Leave 39% Remain).[9]
The areas of Whalsay and South Unst in the Shetland Islands and An Taobh Siar and Nis in Na h-Eileanan an Iar (The Western Isles) also voted by a majority for Leave,[10] as did the town of Lossiemouth in Moray.[11][12]
Wales
.svg.png)
The Welsh council areas were used as the voting areas for the referendum throughout Wales.
650,000 inhabitants born in England live in Wales (21%).[13] The majority to leave the EU was 82,000.[13] The map shows council areas comprising ex-heavy industrial places and English-speaking as a common preference parts of rural Wales saw a leave-vote majority (but also Anglesey where Welsh is just as commonly if not more usually spoken); Cardiff, the Plaid Cymru heartland of the two council areas in West Wales, and by wafer-thin margins affluent Monmouthshire and the Vale of Glamorgan were the areas where remain held sway.
| United Kingdom European Union membership referendum, 2016 Wales | |||
| Choice | Votes | % | |
|---|---|---|---|
| Leave the European Union Gadael yr Undeb Ewropeaidd |
854,572 | 52.53% | |
| Remain a member of the European Union Aros yn aelod o'r Undeb Ewropeaidd |
772,347 | 47.47% | |
| Valid votes | 1,626,919 | 99.93% | |
| Invalid or blank votes | 1,135 | 0.07% | |
| Total votes | 1,628,054 | 100.00% | |
| Registered voters and turnout | 2,270,272 | 71.71% | |
| Source: Electoral Commission | |||
| Leave: 854,572 (52.5%) |
Remain: 772,347 (47.5%) | ||
| ▲ | |||
Wales was broken down into 22 voting areas.
| Council area | Voter turnout, of eligible |
Votes | Proportion of votes | ||
|---|---|---|---|---|---|
| Remain | Leave | Remain | Leave | ||
| Anglesey | 73.8% | 18,618 | 19,333 | 49.1% | 50.9% |
| Blaenau Gwent | 68.1% | 13,215 | 21,587 | 38.0% | 62.0% |
| Bridgend | 71.1% | 33,723 | 40,622 | 45.4% | 54.6% |
| Caerphilly | 70.7% | 39,178 | 53,295 | 42.4% | 57.6% |
| Cardiff | 69.6% | 101,788 | 67,816 | 60.0% | 40.0% |
| Carmarthenshire | 74.0% | 47,654 | 55,381 | 46.3% | 53.7% |
| Ceredigion | 74.4% | 21,711 | 18,031 | 54.6% | 45.4% |
| Conwy | 71.7% | 30,147 | 35,357 | 46.0% | 54.0% |
| Denbighshire | 69.1% | 23,955 | 28,117 | 46.0% | 54.0% |
| Flintshire | 74.8% | 37,867 | 48,930 | 43.6% | 56.4% |
| Gwynedd | 72.3% | 35,517 | 25,665 | 58.1% | 41.9% |
| Merthyr Tydfil | 67.4% | 12,574 | 16,291 | 43.6% | 56.4% |
| Monmouthshire | 77.7% | 28,061 | 27,569 | 50.4% | 49.6% |
| Neath Port Talbot | 71.5% | 32,651 | 43,001 | 43.2% | 56.8% |
| Newport | 70.2% | 32,413 | 41,236 | 44.0% | 56.0% |
| Pembrokeshire | 74.4% | 29,367 | 39,155 | 42.9% | 57.1% |
| Powys | 77.0% | 36,762 | 42,707 | 46.3% | 53.7% |
| Rhondda Cynon Taf | 67.4% | 53,973 | 62,590 | 46.3% | 53.7% |
| Swansea | 69.5% | 58,307 | 61,936 | 48.5% | 51.5% |
| Torfaen | 69.8% | 19,363 | 28,781 | 40.2% | 59.8% |
| Vale of Glamorgan | 76.1% | 36,681 | 35,628 | 50.7% | 49.3% |
| Wrexham | 71.5% | 28,822 | 41,544 | 41.0% | 59.0% |
Results by constituency
The vote was not counted by Commons seat except in Northern Ireland. Some local councils (districts) republished local results by electoral ward or constituency. Some constituencies are coterminous with (overlap) their local government district. For the others Dr Chris Hanretty, a Reader in Politics at the University of East Anglia, estimated through a demographic model the 'Leave' and 'Remain' vote.[14] Hanretty urges caution in the interpretation of the data as the estimates have a margin of error.
Estimated net preference of constituencies by party of the incumbent
| Party | Remain | Leave | Remain % | Leave % | |
|---|---|---|---|---|---|
| Conservative Party | 80 | 247 | 26% | 74% | |
| Labour Party | 84 | 148 | 36% | 64% | |
| SNP | 55 | 1 | 98.21% | 1.76% | |
| Liberal Democrats | 6 | 2 | 75% | 25% | |
| DUP | 2 | 6 | 25% | 75% | |
| Sinn Féin | 4 | 0 | 100% | 0% | |
| Plaid Cymru | 2 | 1 | 67% | 33% | |
| Social Democratic and Labour Party | 3 | 0 | 100% | 0% | |
| Independent | 1 | 1 | 50% | 50% | |
| Ulster Unionist Party | 1 | 1 | 50% | 50% | |
| Green Party | 1 | 0 | 100% | 0% | |
| Speaker | 1 | 0 | 100% | 0% | |
| Total | 242 | 406 | 37% | 63% | |
Please note that this table does not show how each party's traditional voters voted in the referendum. It shows the estimated (or actual) net decision in 648 of the 650 seats and the incumbents reflect those returned at the 2015 general election.
List of constituency results
While votes were tallied by district, there were two sources of by constituency result available within a short time of the referendum. Firstly a model by Chris Hanretty, based on the published results by district, and secondly 82 results calculated by the BBC based on ward results obtained from the local authorities.[15]
In the following table, Hanretty's results are marked with "(est.)".
| Constituency | Leave | Remain |
|---|---|---|
| Boston and Skegness | 75.65% | 24.35%(est.) |
| Walsall North | 74.19% | 25.81% |
| Clacton | 73.04% | 26.96%(est.) |
| South Basildon and East Thurrock | 73% | 27%(est.) |
| Kingston upon Hull East | 72.83% | 27.17%(est.) |
| Castle Point | 72.7% | 27.3% |
| Stoke-on-Trent North | 72.12% | 27.88%(est.) |
| Doncaster North | 71.65% | 28.35%(est.) |
| Great Yarmouth | 71.5% | 28.5% |
| Great Grimsby | 71.45% | 28.55% |
| Dudley North | 71.43% | 28.57% |
| Stoke-on-Trent South | 71.11% | 28.89%(est.) |
| South Holland and The Deepings | 71.07% | 28.93%(est.) |
| Barnsley East | 70.98% | 29.02%(est.) |
| Mansfield | 70.86% | 29.14% |
| Ashfield | 70.47% | 29.53%(est.) |
| Dudley South | 70.42% | 29.58% |
| Bolsover | 70.39% | 29.61%(est.) |
| Dagenham and Rainham | 70.35% | 29.65%(est.) |
| Wentworth and Dearne | 70.28% | 29.72%(est.) |
| Thurrock | 70.26% | 29.74%(est.) |
| Hartlepool | 69.57% | 30.43% |
| Cleethorpes | 69.5% | 30.5%(est.) |
| Hornchurch and Upminster | 69.49% | 30.51% |
| North East Cambridgeshire | 69.35% | 30.65%(est.) |
| Romford | 69.29% | 30.71% |
| Normanton, Pontefract and Castleford | 69.26% | 30.74% |
| Louth and Horncastle | 68.9% | 31.1%(est.) |
| Cannock Chase | 68.86% | 31.14% |
| Scunthorpe | 68.68% | 31.32%(est.) |
| West Bromwich West | 68.67% | 31.33%(est.) |
| Don Valley | 68.49% | 31.51%(est.) |
| Rotherham | 68.35% | 31.65% |
| Bassetlaw | 68.32% | 31.68%(est.) |
| Barnsley Central | 68.19% | 31.81%(est.) |
| West Bromwich East | 68.18% | 31.82%(est.) |
| Wolverhampton South East | 68.14% | 31.86% |
| Hemsworth | 68.13% | 31.87% |
| Kingston upon Hull West and Hessle | 67.99% | 32.01%(est.) |
| Blackpool South | 67.81% | 32.19%(est.) |
| Aldridge-Brownhills | 67.8% | 32.2% |
| North Warwickshire | 67.76% | 32.24%(est.) |
| Harlow | 67.73% | 32.27%(est.) |
| Wolverhampton North East | 67.71% | 32.29% |
| Redcar | 67.67% | 32.33%(est.) |
| Rayleigh and Wickford | 67.65% | 32.35%(est.) |
| Basildon and Billericay | 67.14% | 32.86%(est.) |
| Blackpool North and Cleveleys | 66.91% | 33.09%(est.) |
| Rother Valley | 66.72% | 33.28% |
| Doncaster Central | 66.7% | 33.3%(est.) |
| South West Norfolk | 66.67% | 33.33%(est.) |
| Burnley | 66.61% | 33.39% |
| Halesowen and Rowley Regis | 66.59% | 33.41%(est.) |
| Plymouth, Moor View | 66.44% | 33.56% |
| Stockton North | 66.32% | 33.68%(est.) |
| Sheffield South East | 66.32% | 33.68%(est.) |
| Brigg and Goole | 66.23% | 33.77%(est.) |
| Telford | 66.19% | 33.81%(est.) |
| Middlesbrough | 66.08% | 33.92% |
| Tamworth | 65.99% | 34.01%(est.) |
| Easington | 65.96% | 34.04%(est.) |
| Hyndburn | 65.82% | 34.18%(est.) |
| North West Norfolk | 65.78% | 34.22%(est.) |
| Broxbourne | 65.53% | 34.47%(est.) |
| Gravesham | 65.38% | 34.62% |
| Sittingbourne and Sheppey | 65.36% | 34.64%(est.) |
| Amber Valley | 65.3% | 34.7%(est.) |
| Middlesbrough South and East Cleveland | 65.27% | 34.73%(est.) |
| Bexleyheath and Crayford | 65.26% | 34.74%(est.) |
| South Staffordshire | 65.24% | 34.76% |
| North Thanet | 65.18% | 34.82%(est.) |
| Makerfield | 64.91% | 35.09%(est.) |
| Stoke-on-Trent Central | 64.85% | 35.15%(est.) |
| Burton | 64.79% | 35.21%(est.) |
| Bognor Regis and Littlehampton | 64.79% | 35.21%(est.) |
| Staffordshire Moorlands | 64.69% | 35.31%(est.) |
| Nuneaton | 64.51% | 35.49%(est.) |
| St Austell and Newquay | 64.06% | 35.94%(est.) |
| Dartford | 63.98% | 36.02%(est.) |
| Chatham and Aylesford | 63.91% | 36.09%(est.) |
| Nottingham North | 63.81% | 36.19% |
| Portsmouth North | 63.69% | 36.31% |
| Rochester and Strood | 63.69% | 36.31% |
| Stourbridge | 63.66% | 36.34% |
| East Yorkshire | 63.66% | 36.34%(est.) |
| Sherwood | 63.66% | 36.34%(est.) |
| Gillingham and Rainham | 63.58% | 36.42% |
| Bradford South | 63.56% | 36.44% |
| Waveney | 63.41% | 36.59%(est.) |
| Leigh | 63.29% | 36.71%(est.) |
| West Suffolk | 63.25% | 36.75%(est.) |
| Erewash | 63.22% | 36.78%(est.) |
| Pendle | 63.15% | 36.85% |
| Wyre Forest | 63.15% | 36.85% |
| Bolton South East | 63.03% | 36.97%(est.) |
| Wellingborough | 63.02% | 36.98%(est.) |
| Dover | 63.01% | 36.99%(est.) |
| Birmingham, Erdington | 63% | 37% |
| Wigan | 62.96% | 37.04%(est.) |
| Wakefield | 62.77% | 37.23% |
| Peterborough | 62.68% | 37.32%(est.) |
| Havant | 62.62% | 37.38%(est.) |
| Torbay | 62.45% | 37.55%(est.) |
| Houghton and Sunderland South | 62.43% | 37.57% |
| Old Bexley and Sidcup | 62.43% | 37.57%(est.) |
| Heywood and Middleton | 62.43% | 37.57% |
| North Antrim | 62.22% | 37.78% |
| Bridgwater and West Somerset | 62.06% | 37.94%(est.) |
| South Shields | 62.05% | 37.95% |
| North East Derbyshire | 62.05% | 37.95%(est.) |
| Blaenau Gwent | 62.03% | 37.97% |
| Gainsborough | 61.96% | 38.04%(est.) |
| Isle of Wight | 61.95% | 38.05% |
| Washington and Sunderland West | 61.85% | 38.15% |
| Gosport | 61.82% | 38.18%(est.) |
| Ashton-under-Lyne | 61.81% | 38.19% |
| Birmingham, Northfield | 61.8% | 38.2% |
| Swansea East | 61.79% | 38.21%(est.) |
| Jarrow | 61.78% | 38.22%(est.) |
| South Thanet | 61.69% | 38.31%(est.) |
| Newcastle-under-Lyme | 61.64% | 38.36%(est.) |
| Folkestone and Hythe | 61.64% | 38.36%(est.) |
| Walsall South | 61.64% | 38.36% |
| Warley | 61.63% | 38.37%(est.) |
| Sleaford and North Hykeham | 61.58% | 38.42%(est.) |
| Braintree | 61.52% | 38.48%(est.) |
| Leeds East | 61.44% | 38.56%(est.) |
| Derby South | 61.35% | 38.65%(est.) |
| Scarborough and Whitby | 61.32% | 38.68%(est.) |
| Oldham West and Royton | 61.31% | 38.69% |
| Brentwood and Ongar | 61.19% | 38.81%(est.) |
| Epping Forest | 61.01% | 38.99%(est.) |
| Workington | 61.01% | 38.99%(est.) |
| Grantham and Stamford | 61% | 39%(est.) |
| Redditch | 60.99% | 39.01%(est.) |
| Kettering | 60.99% | 39.01% |
| Denton and Reddish | 60.98% | 39.02% |
| Maldon | 60.96% | 39.04%(est.) |
| Rochford and Southend East | 60.92% | 39.08%(est.) |
| Bishop Auckland | 60.89% | 39.11%(est.) |
| Bosworth | 60.83% | 39.17%(est.) |
| Torfaen | 60.78% | 39.22%(est.) |
| North West Leicestershire | 60.7% | 39.3% |
| Penistone and Stocksbridge | 60.65% | 39.35%(est.) |
| Carlisle | 60.64% | 39.36%(est.) |
| Mid Norfolk | 60.6% | 39.4%(est.) |
| Blyth Valley | 60.49% | 39.51%(est.) |
| Witham | 60.47% | 39.53%(est.) |
| Rhondda | 60.45% | 39.55%(est.) |
| Hereford and South Herefordshire | 60.42% | 39.58%(est.) |
| South Derbyshire | 60.35% | 39.65% |
| North Durham | 60.3% | 39.7%(est.) |
| Spelthorne | 60.3% | 39.7% |
| Southampton, Itchen | 60.29% | 39.71%(est.) |
| Crewe and Nantwich | 60.29% | 39.71%(est.) |
| Northampton North | 60.27% | 39.73%(est.) |
| North Cornwall | 60.19% | 39.81%(est.) |
| New Forest East | 60.18% | 39.82%(est.) |
| Corby | 60.15% | 39.85%(est.) |
| Aberavon | 60.12% | 39.88%(est.) |
| Birmingham, Yardley | 60.1% | 39.9% |
| Barking | 59.97% | 40.03%(est.) |
| Sheffield, Brightside and Hillsborough | 59.97% | 40.03%(est.) |
| Christchurch | 59.96% | 40.04%(est.) |
| Sunderland Central | 59.94% | 40.06% |
| Oldham East and Saddleworth | 59.92% | 40.08% |
| Clwyd South | 59.88% | 40.12%(est.) |
| Yeovil | 59.87% | 40.13%(est.) |
| Ashford | 59.86% | 40.14%(est.) |
| North Shropshire | 59.85% | 40.15%(est.) |
| Morley and Outwood | 59.82% | 40.18%(est.) |
| Worsley and Eccles South | 59.79% | 40.21% |
| Kingston upon Hull North | 59.79% | 40.21%(est.) |
| Batley and Spen | 59.63% | 40.37%(est.) |
| North Tyneside | 59.52% | 40.48%(est.) |
| South Dorset | 59.45% | 40.55%(est.) |
| Sedgefield | 59.44% | 40.56%(est.) |
| Mid Worcestershire | 59.39% | 40.61%(est.) |
| Newport East | 59.33% | 40.67%(est.) |
| The Wrekin | 59.32% | 40.68%(est.) |
| Chesterfield | 59.29% | 40.71%(est.) |
| Stalybridge and Hyde | 59.29% | 40.71% |
| Copeland | 59.2% | 40.8%(est.) |
| Luton North | 59.15% | 40.85%(est.) |
| Harwich and North Essex | 59% | 41%(est.) |
| Northampton South | 59% | 41%(est.) |
| Islwyn | 58.94% | 41.06%(est.) |
| Rossendale and Darwen | 58.94% | 41.06%(est.) |
| Ogmore | 58.9% | 41.1%(est.) |
| Halifax | 58.82% | 41.18% |
| Gloucester | 58.81% | 41.19%(est.) |
| Meriden | 58.81% | 41.19% |
| Beverley and Holderness | 58.74% | 41.26%(est.) |
| Ribble Valley | 58.73% | 41.27%(est.) |
| Faversham and Mid Kent | 58.67% | 41.33%(est.) |
| Rugby | 58.62% | 41.38%(est.) |
| Daventry | 58.59% | 41.41%(est.) |
| Crawley | 58.41% | 41.59% |
| Camborne and Redruth | 58.41% | 41.59%(est.) |
| North Norfolk | 58.4% | 41.6%(est.) |
| St Helens North | 58.39% | 41.61%(est.) |
| Coventry North West | 58.37% | 41.63%(est.) |
| Merthyr Tydfil and Rhymney | 58.35% | 41.65%(est.) |
| Ellesmere Port and Neston | 58.34% | 41.66%(est.) |
| Hayes and Harlington | 58.25% | 41.75%(est.) |
| Morecambe and Lunesdale | 58.19% | 41.81%(est.) |
| South Leicestershire | 58.14% | 41.86%(est.) |
| Bolton North East | 58.11% | 41.89%(est.) |
| Darlington | 58.1% | 41.9%(est.) |
| South West Bedfordshire | 58.08% | 41.92%(est.) |
| Warrington North | 58.07% | 41.93%(est.) |
| Alyn and Deeside | 58.05% | 41.95%(est.) |
| North Herefordshire | 58.02% | 41.98%(est.) |
| Aldershot | 57.9% | 42.1% |
| Forest of Dean | 57.89% | 42.11%(est.) |
| Ludlow | 57.88% | 42.12%(est.) |
| Charnwood | 57.87% | 42.13%(est.) |
| Tiverton and Honiton | 57.82% | 42.18%(est.) |
| Coventry North East | 57.77% | 42.23%(est.) |
| Stockton South | 57.76% | 42.24%(est.) |
| Bournemouth West | 57.73% | 42.27%(est.) |
| Bexhill and Battle | 57.72% | 42.28%(est.) |
| Halton | 57.67% | 42.33%(est.) |
| Selby and Ainsty | 57.65% | 42.35%(est.) |
| Wrexham | 57.57% | 42.43%(est.) |
| Eastbourne | 57.54% | 42.46%(est.) |
| Orpington | 57.54% | 42.46% |
| Stone | 57.54% | 42.46%(est.) |
| Lichfield | 57.51% | 42.49%(est.) |
| Stafford | 57.46% | 42.54%(est.) |
| Rochdale | 57.45% | 42.55% |
| Lincoln | 57.43% | 42.57%(est.) |
| Poole | 57.42% | 42.58%(est.) |
| North Swindon | 57.29% | 42.71%(est.) |
| Barrow and Furness | 57.28% | 42.72%(est.) |
| Weston-Super-Mare | 57.2% | 42.8%(est.) |
| Torridge and West Devon | 57.19% | 42.81%(est.) |
| Uxbridge and South Ruislip | 57.19% | 42.81%(est.) |
| Sheffield, Heeley | 57.16% | 42.84%(est.) |
| Dewsbury | 57.15% | 42.85%(est.) |
| Kingswood | 57.12% | 42.88%(est.) |
| Mid Dorset and North Poole | 57.08% | 42.92%(est.) |
| North Devon | 57.04% | 42.96% |
| Stevenage | 57.04% | 42.96%(est.) |
| North West Cambridgeshire | 56.93% | 43.07%(est.) |
| South West Wiltshire | 56.88% | 43.12%(est.) |
| Newcastle upon Tyne North | 56.83% | 43.17%(est.) |
| Elmet and Rothwell | 56.79% | 43.21%(est.) |
| Chorley | 56.75% | 43.25%(est.) |
| Cynon Valley | 56.73% | 43.27%(est.) |
| Fylde | 56.73% | 43.27%(est.) |
| Norwich North | 56.73% | 43.27%(est.) |
| Llanelli | 56.67% | 43.33%(est.) |
| South Ribble | 56.64% | 43.36%(est.) |
| North Dorset | 56.61% | 43.39%(est.) |
| Vale of Clwyd | 56.56% | 43.44%(est.) |
| Ipswich | 56.52% | 43.48%(est.) |
| Thirsk and Malton | 56.43% | 43.57%(est.) |
| Gedling | 56.3% | 43.7%(est.) |
| Wansbeck | 56.29% | 43.71%(est.) |
| Carshalton and Wallington | 56.26% | 43.74%(est.) |
| Gateshead | 56.22% | 43.78%(est.) |
| Blaydon | 56.12% | 43.88%(est.) |
| St Helens South and Whiston | 56.05% | 43.95%(est.) |
| Worthing West | 56.02% | 43.98%(est.) |
| Newton Abbot | 56.01% | 43.99%(est.) |
| Hastings and Rye | 55.94% | 44.06%(est.) |
| Feltham and Heston | 55.93% | 44.07% |
| Maidstone and The Weald | 55.92% | 44.08%(est.) |
| Montgomeryshire | 55.84% | 44.16%(est.) |
| Newark | 55.7% | 44.3%(est.) |
| Preston | 55.67% | 44.33%(est.) |
| Bolton West | 55.55% | 44.45%(est.) |
| Strangford | 55.53% | 44.47% |
| Fareham | 55.52% | 44.48%(est.) |
| Hemel Hempstead | 55.49% | 44.51%(est.) |
| Bromsgrove | 55.37% | 44.63% |
| Preseli Pembrokeshire | 55.32% | 44.68%(est.) |
| Berwick-upon-Tweed | 55.3% | 44.7%(est.) |
| New Forest West | 55.26% | 44.74%(est.) |
| Haltemprice and Howden | 55.23% | 44.77%(est.) |
| Suffolk Coastal | 55.21% | 44.79%(est.) |
| Penrith and The Border | 55.2% | 44.8%(est.) |
| East Antrim | 55.19% | 44.81% |
| Carmarthen West and South Pembrokeshire | 55.16% | 44.84%(est.) |
| Bradford East | 55.16% | 44.84% |
| Caerphilly | 55.14% | 44.86%(est.) |
| South East Cornwall | 55.1% | 44.9%(est.) |
| South West Devon | 55.08% | 44.92%(est.) |
| Southend West | 55.07% | 44.93% |
| North West Durham | 55.05% | 44.95%(est.) |
| West Lancashire | 54.95% | 45.05%(est.) |
| Central Suffolk and North Ipswich | 54.89% | 45.11%(est.) |
| Bootle | 54.8% | 45.2%(est.) |
| St Ives | 54.77% | 45.23%(est.) |
| North West Hampshire | 54.75% | 45.25%(est.) |
| Richmond (Yorks) | 54.71% | 45.29%(est.) |
| Erith and Thamesmead | 54.63% | 45.37%(est.) |
| Luton South | 54.6% | 45.4%(est.) |
| Bury South | 54.51% | 45.49%(est.) |
| Delyn | 54.41% | 45.59%(est.) |
| Plymouth, Sutton and Devonport | 54.41% | 45.59% |
| Wolverhampton South West | 54.37% | 45.63% |
| Eastleigh | 54.35% | 45.65%(est.) |
| Derby North | 54.25% | 45.75%(est.) |
| East Surrey | 54.2% | 45.8%(est.) |
| Wyre and Preston North | 54.2% | 45.8%(est.) |
| Broadland | 54.1% | 45.9%(est.) |
| Leicester East | 54.06% | 45.94%(est.) |
| Slough | 54.06% | 45.94%(est.) |
| Sevenoaks | 54.04% | 45.96%(est.) |
| South Suffolk | 54.03% | 45.97%(est.) |
| Neath | 54.02% | 45.98%(est.) |
| Bury St Edmunds | 53.99% | 46.01%(est.) |
| Totnes | 53.89% | 46.11%(est.) |
| Rutland and Melton | 53.88% | 46.12%(est.) |
| Blackburn | 53.73% | 46.27% |
| Bournemouth East | 53.69% | 46.31%(est.) |
| East Worthing and Shoreham | 53.68% | 46.32%(est.) |
| Worcester | 53.68% | 46.32% |
| Bury North | 53.67% | 46.33%(est.) |
| Newport West | 53.66% | 46.34%(est.) |
| Tewkesbury | 53.65% | 46.35%(est.) |
| Wells | 53.63% | 46.37%(est.) |
| Basingstoke | 53.6% | 46.4%(est.) |
| Banff and Buchan | 53.59% | 46.41%(est.) |
| Salford and Eccles | 53.59% | 46.41% |
| Devizes | 53.53% | 46.47%(est.) |
| Huntingdon | 53.49% | 46.51%(est.) |
| North East Bedfordshire | 53.44% | 46.56%(est.) |
| Solihull | 53.35% | 46.65% |
| South Northamptonshire | 53.34% | 46.66%(est.) |
| Keighley | 53.33% | 46.67% |
| Ilford North | 53.31% | 46.69%(est.) |
| Leeds West | 53.27% | 46.73%(est.) |
| Bracknell | 53.24% | 46.76%(est.) |
| Carmarthen East and Dinefwr | 53.21% | 46.79%(est.) |
| Skipton and Ripon | 53.19% | 46.81%(est.) |
| Calder Valley | 53.16% | 46.84% |
| Lagan Valley | 53.09% | 46.91% |
| Milton Keynes South | 53.08% | 46.92%(est.) |
| Clwyd West | 53.01% | 46.99%(est.) |
| Taunton Deane | 52.92% | 47.08% |
| Shrewsbury and Atcham | 52.92% | 47.08%(est.) |
| Mid Bedfordshire | 52.88% | 47.12%(est.) |
| Tonbridge and Malling | 52.86% | 47.14%(est.) |
| Welwyn Hatfield | 52.82% | 47.18%(est.) |
| Wealden | 52.77% | 47.23%(est.) |
| Upper Bann | 52.62% | 47.38% |
| Congleton | 52.61% | 47.39%(est.) |
| Vale of Glamorgan | 52.55% | 47.45%(est.) |
| West Worcestershire | 52.52% | 47.48%(est.) |
| Broxtowe | 52.51% | 47.49%(est.) |
| Mid Derbyshire | 52.47% | 47.53%(est.) |
| Harborough | 52.37% | 47.63%(est.) |
| Knowsley | 52.34% | 47.66%(est.) |
| Shipley | 52.21% | 47.79% |
| Hazel Grove | 52.21% | 47.79% |
| Aberconwy | 52.2% | 47.8%(est.) |
| Thornbury and Yate | 52.19% | 47.81%(est.) |
| Liverpool, Walton | 52.17% | 47.83%(est.) |
| Eddisbury | 52.17% | 47.83%(est.) |
| Lancaster and Fleetwood | 51.99% | 48.01%(est.) |
| Bedford | 51.95% | 48.05% |
| Belfast East | 51.94% | 48.06% |
| Meon Valley | 51.93% | 48.07%(est.) |
| Brecon and Radnorshire | 51.86% | 48.14%(est.) |
| Surrey Heath | 51.85% | 48.15%(est.) |
| Huddersfield | 51.85% | 48.15%(est.) |
| Eltham | 51.82% | 48.18% |
| Aylesbury | 51.79% | 48.21%(est.) |
| Portsmouth South | 51.76% | 48.24% |
| Birkenhead | 51.71% | 48.29% |
| Sutton Coldfield | 51.7% | 48.3% |
| South Swindon | 51.65% | 48.35%(est.) |
| North East Somerset | 51.63% | 48.37%(est.) |
| Chippenham | 51.59% | 48.41%(est.) |
| Colchester | 51.51% | 48.49%(est.) |
| Reading West | 51.51% | 48.49%(est.) |
| Birmingham, Hodge Hill | 51.5% | 48.5% |
| North East Hertfordshire | 51.43% | 48.57%(est.) |
| Caithness, Sutherland and Easter Ross | 51.34% | 48.66%(est.) |
| Sutton and Cheam | 51.28% | 48.72%(est.) |
| Saffron Walden | 51.24% | 48.76%(est.) |
| Derbyshire Dales | 51.24% | 48.76%(est.) |
| Birmingham, Perry Barr | 51.2% | 48.8% |
| Watford | 51.15% | 48.85%(est.) |
| Warrington South | 51.11% | 48.89%(est.) |
| West Dorset | 51.04% | 48.96%(est.) |
| Stratford-on-Avon | 51% | 49%(est.) |
| Ynys Mon | 50.94% | 49.06% |
| Central Devon | 50.89% | 49.11%(est.) |
| South Norfolk | 50.88% | 49.12%(est.) |
| Hertsmere | 50.84% | 49.16% |
| Leicester West | 50.84% | 49.16%(est.) |
| Chichester | 50.73% | 49.27%(est.) |
| Chelmsford | 50.68% | 49.32%(est.) |
| Weaver Vale | 50.55% | 49.45%(est.) |
| High Peak | 50.55% | 49.45% |
| East Devon | 50.41% | 49.59%(est.) |
| Coventry South | 50.38% | 49.62%(est.) |
| Banbury | 50.35% | 49.65%(est.) |
| Somerton and Frome | 50.33% | 49.67%(est.) |
| Croydon Central | 50.31% | 49.69% |
| North Wiltshire | 50.3% | 49.7%(est.) |
| Bridgend | 50.28% | 49.72%(est.) |
| Loughborough | 50.09% | 49.91%(est.) |
| Colne Valley | 50.06% | 49.94%(est.) |
| Blackley and Broughton | 50.04% | 49.96%(est.) |
| Wallasey | 49.92% | 50.08% |
| Salisbury | 49.91% | 50.09%(est.) |
| Chingford and Woodford Green | 49.88% | 50.12%(est.) |
| Moray | 49.87% | 50.13% |
| Runnymede and Weybridge | 49.85% | 50.15%(est.) |
| Bromley and Chislehurst | 49.83% | 50.17% |
| Liverpool, West Derby | 49.82% | 50.18%(est.) |
| Arundel and South Downs | 49.7% | 50.3%(est.) |
| Milton Keynes North | 49.67% | 50.33%(est.) |
| Wythenshawe and Sale East | 49.65% | 50.35%(est.) |
| Belfast North | 49.64% | 50.36% |
| Ruislip, Northwood and Pinner | 49.54% | 50.46%(est.) |
| Horsham | 49.49% | 50.51%(est.) |
| Southampton, Test | 49.41% | 50.59%(est.) |
| Gower | 49.31% | 50.69%(est.) |
| East Hampshire | 49.27% | 50.73%(est.) |
| Hertford and Stortford | 49.24% | 50.76%(est.) |
| Enfield North | 49.22% | 50.78% |
| Beaconsfield | 49.01% | 50.99%(est.) |
| Stretford and Urmston | 48.91% | 51.09%(est.) |
| Buckingham | 48.87% | 51.13%(est.) |
| Filton and Bradley Stoke | 48.77% | 51.23%(est.) |
| Pudsey | 48.58% | 51.42%(est.) |
| Wycombe | 48.46% | 51.54%(est.) |
| Angus | 48.24% | 51.76%(est.) |
| Monmouth | 48.06% | 51.94%(est.) |
| Newcastle upon Tyne Central | 48% | 52%(est.) |
| Reigate | 47.98% | 52.02%(est.) |
| East Londonderry | 47.97% | 52.03% |
| West Ham | 47.97% | 52.03%(est.) |
| Garston and Halewood | 47.96% | 52.04%(est.) |
| The Cotswolds | 47.92% | 52.08%(est.) |
| Newbury | 47.81% | 52.19%(est.) |
| Epsom and Ewell | 47.78% | 52.22%(est.) |
| North Down | 47.64% | 52.36% |
| Tynemouth | 47.64% | 52.36%(est.) |
| Glenrothes | 47.61% | 52.39%(est.) |
| North Somerset | 47.58% | 52.42%(est.) |
| Harrow East | 47.48% | 52.52% |
| Dwyfor Meirionnydd | 47.43% | 52.57%(est.) |
| Mole Valley | 47.31% | 52.69%(est.) |
| Birmingham, Edgbaston | 47.3% | 52.7% |
| Macclesfield | 47.18% | 52.82%(est.) |
| Harrogate and Knaresborough | 47.18% | 52.82%(est.) |
| Lewes | 47.14% | 52.86%(est.) |
| Bristol South | 47.14% | 52.86% |
| Westmorland and Lonsdale | 47.06% | 52.94%(est.) |
| Birmingham, Selly Oak | 46.9% | 53.1% |
| Bristol East | 46.8% | 53.2% |
| Stockport | 46.79% | 53.21% |
| Bradford West | 46.74% | 53.26% |
| Windsor | 46.66% | 53.34%(est.) |
| Beckenham | 46.58% | 53.42%(est.) |
| Wirral South | 46.55% | 53.45% |
| Pontypridd | 46.51% | 53.49%(est.) |
| Nottingham South | 46.47% | 53.53% |
| Wantage | 46.46% | 53.54%(est.) |
| Mid Sussex | 46.44% | 53.56%(est.) |
| Witney | 46.34% | 53.66% |
| Southport | 46.29% | 53.71%(est.) |
| East Ham | 46.27% | 53.73%(est.) |
| Ealing North | 46.26% | 53.74% |
| Kenilworth and Southam | 46.21% | 53.79%(est.) |
| South West Hertfordshire | 46.2% | 53.8%(est.) |
| North East Hampshire | 46.18% | 53.82%(est.) |
| Romsey and Southampton North | 46.08% | 53.92%(est.) |
| Leeds Central | 45.96% | 54.04%(est.) |
| Stroud | 45.86% | 54.14%(est.) |
| Truro and Falmouth | 45.85% | 54.15%(est.) |
| Croydon South | 45.81% | 54.19% |
| Tatton | 45.63% | 54.37%(est.) |
| Edmonton | 45.51% | 54.49% |
| Ceredigion | 45.37% | 54.63% |
| Hexham | 45.34% | 54.66%(est.) |
| Canterbury | 45.33% | 54.67%(est.) |
| South East Cambridgeshire | 45.3% | 54.7%(est.) |
| Dumfries and Galloway | 45.11% | 54.89%(est.) |
| Harrow West | 45.06% | 54.94% |
| Maidenhead | 45.03% | 54.97%(est.) |
| Chesham and Amersham | 44.98% | 55.02% |
| Exeter | 44.83% | 55.17%(est.) |
| Na h-Eileanan an Iar | 44.76% | 55.24% |
| Wirral West | 44.69% | 55.31% |
| Mitcham and Morden | 44.69% | 55.31% |
| York Outer | 44.67% | 55.33%(est.) |
| Tunbridge Wells | 44.65% | 55.35%(est.) |
| Dumfriesshire, Clydesdale and Tweeddale | 44.65% | 55.35%(est.) |
| Gordon | 44.29% | 55.71%(est.) |
| Woking | 44.25% | 55.75%(est.) |
| Ayr, Carrick and Cumnock | 44.11% | 55.89%(est.) |
| Sefton Central | 44.09% | 55.91%(est.) |
| Glasgow East | 43.84% | 56.16% |
| Cardiff West | 43.82% | 56.18%(est.) |
| Brighton, Kemptown | 43.59% | 56.41%(est.) |
| Ross, Skye and Lochaber | 43.49% | 56.51%(est.) |
| Swansea West | 43.4% | 56.6%(est.) |
| City of Durham | 43.34% | 56.66%(est.) |
| Ilford South | 43.31% | 56.69%(est.) |
| Brentford and Isleworth | 43.31% | 56.69% |
| Kirkcaldy and Cowdenbeath | 43.26% | 56.74%(est.) |
| Livingston | 43.26% | 56.74%(est.) |
| Berwickshire, Roxburgh and Selkirk | 43.26% | 56.74%(est.) |
| Aberdeen North | 43.09% | 56.91%(est.) |
| Henley | 43.09% | 56.91%(est.) |
| Cheltenham | 42.9% | 57.1%(est.) |
| Brent Central | 42.89% | 57.11%(est.) |
| Nottingham East | 42.88% | 57.12% |
| Cardiff South and Penarth | 42.82% | 57.18%(est.) |
| Wokingham | 42.69% | 57.31%(est.) |
| Cheadle | 42.65% | 57.35% |
| Brent North | 42.61% | 57.39%(est.) |
| Leicester South | 42.44% | 57.56%(est.) |
| North Ayrshire and Arran | 42.4% | 57.6%(est.) |
| City of Chester | 42.28% | 57.72%(est.) |
| Falkirk | 42.11% | 57.89%(est.) |
| Linlithgow and East Falkirk | 42.02% | 57.98%(est.) |
| Ealing, Southall | 41.83% | 58.17% |
| Warwick and Leamington | 41.64% | 58.36%(est.) |
| Central Ayrshire | 41.62% | 58.38%(est.) |
| Bristol North West | 41.6% | 58.4% |
| Hendon | 41.57% | 58.43%(est.) |
| Esher and Walton | 41.57% | 58.43%(est.) |
| Rushcliffe | 41.47% | 58.53%(est.) |
| Fermanagh and South Tyrone | 41.44% | 58.56% |
| Guildford | 41.2% | 58.8%(est.) |
| South Antrim | 41.18% | 58.82% |
| Croydon North | 41.17% | 58.83% |
| Chipping Barnet | 41.07% | 58.93%(est.) |
| Newcastle upon Tyne East | 41.07% | 58.93%(est.) |
| Glasgow South West | 40.86% | 59.14% |
| Kingston and Surbiton | 40.84% | 59.16%(est.) |
| South West Surrey | 40.75% | 59.25%(est.) |
| Dundee West | 40.75% | 59.25%(est.) |
| Glasgow North East | 40.66% | 59.34% |
| Norwich South | 40.53% | 59.47%(est.) |
| Orkney and Shetland | 40.28% | 59.72%(est.) |
| Inverness, Nairn, Badenoch and Strathspey | 40.13% | 59.87%(est.) |
| Perth and North Perthshire | 39.9% | 60.1%(est.) |
| Airdrie and Shotts | 39.84% | 60.16%(est.) |
| Hitchin and Harpenden | 39.79% | 60.21% |
| Winchester | 39.64% | 60.36%(est.) |
| Mid Ulster | 39.61% | 60.39% |
| Ochil and South Perthshire | 39.5% | 60.5%(est.) |
| Kilmarnock and Loudoun | 39.45% | 60.55%(est.) |
| Argyll and Bute | 39.43% | 60.57% |
| Dunfermline and West Fife | 39.39% | 60.61%(est.) |
| West Aberdeenshire and Kincardine | 39.17% | 60.83%(est.) |
| Cardiff North | 39.15% | 60.85%(est.) |
| York Central | 38.82% | 61.18%(est.) |
| Coatbridge, Chryston and Bellshill | 38.78% | 61.22%(est.) |
| Altrincham and Sale West | 38.59% | 61.41%(est.) |
| South Cambridgeshire | 38.49% | 61.51%(est.) |
| Dundee East | 38.41% | 61.59%(est.) |
| Reading East | 38.25% | 61.75%(est.) |
| Manchester, Gorton | 38.21% | 61.79%(est.) |
| Oxford West and Abingdon | 38.03% | 61.97%(est.) |
| West Dunbartonshire | 38.01% | 61.99% |
| Midlothian | 37.94% | 62.06% |
| Enfield, Southgate | 37.88% | 62.12% |
| St Albans | 37.83% | 62.17%(est.) |
| Motherwell and Wishaw | 37.71% | 62.29%(est.) |
| Rutherglen and Hamilton West | 37.57% | 62.43%(est.) |
| Leeds North East | 37.42% | 62.58%(est.) |
| Newry and Armagh | 37.06% | 62.94% |
| Cumbernauld, Kilsyth and Kirkintilloch East | 36.99% | 63.01%(est.) |
| East Kilbride, Strathaven and Lesmahagow | 36.93% | 63.07%(est.) |
| Manchester Central | 36.36% | 63.64%(est.) |
| North East Fife | 36.31% | 63.69%(est.) |
| Inverclyde | 36.2% | 63.8% |
| Lanark and Hamilton East | 35.96% | 64.04%(est.) |
| Arfon | 35.85% | 64.15%(est.) |
| Greenwich and Woolwich | 35.67% | 64.33% |
| Birmingham, Ladywood | 35.6% | 64.4% |
| Paisley and Renfrewshire North | 35.55% | 64.45%(est.) |
| Leeds North West | 35.41% | 64.59%(est.) |
| East Lothian | 35.4% | 64.6% |
| Lewisham East | 35.37% | 64.63%(est.) |
| Liverpool, Wavertree | 35.26% | 64.74%(est.) |
| Paisley and Renfrewshire South | 34.8% | 65.2%(est.) |
| Leyton and Wanstead | 34.76% | 65.24%(est.) |
| Lewisham West and Penge | 34.59% | 65.41%(est.) |
| Poplar and Limehouse | 34.21% | 65.79%(est.) |
| Sheffield, Hallam | 34.01% | 65.99%(est.) |
| Westminster North | 33.65% | 66.35%(est.) |
| Birmingham, Hall Green | 33.6% | 66.4% |
| Walthamstow | 33.49% | 66.51% |
| Twickenham | 33.32% | 66.68%(est.) |
| West Tyrone | 33.15% | 66.85% |
| Hove | 32.95% | 67.05%(est.) |
| South Down | 32.76% | 67.24% |
| Oxford East | 32.53% | 67.47%(est.) |
| Stirling | 32.28% | 67.72% |
| Aberdeen South | 32.14% | 67.86%(est.) |
| Cardiff Central | 32.01% | 67.99%(est.) |
| Sheffield Central | 31.91% | 68.09%(est.) |
| Bath | 31.72% | 68.28%(est.) |
| Glasgow North West | 31.49% | 68.51% |
| Camberwell and Peckham | 31.48% | 68.52%(est.) |
| Hammersmith | 31.31% | 68.69%(est.) |
| Kensington | 31.2% | 68.8%(est.) |
| Finchley and Golders Green | 31.1% | 68.9%(est.) |
| Bethnal Green and Bow | 30.86% | 69.14%(est.) |
| Belfast South | 30.51% | 69.49% |
| Wimbledon | 29.37% | 70.63% |
| Ealing Central and Acton | 29.15% | 70.85% |
| Chelsea and Fulham | 29.1% | 70.9%(est.) |
| Edinburgh West | 28.77% | 71.23% |
| Glasgow Central | 28.75% | 71.25% |
| Richmond Park | 28.69% | 71.31%(est.) |
| Islington South and Finsbury | 28.28% | 71.72% |
| Glasgow South | 28.19% | 71.81% |
| Cities of London and Westminster | 28.05% | 71.95%(est.) |
| Edinburgh South West | 27.86% | 72.14% |
| Putney | 27.76% | 72.24%(est.) |
| Edinburgh East | 27.64% | 72.36% |
| Liverpool, Riverside | 27.3% | 72.7%(est.) |
| East Dunbartonshire | 26.87% | 73.13%(est.) |
| Holborn and St Pancras | 26.66% | 73.34% |
| Cambridge | 26.23% | 73.77% |
| Bermondsey and Old Southwark | 26.05% | 73.95%(est.) |
| Belfast West | 25.94% | 74.06% |
| Brighton, Pavilion | 25.93% | 74.07%(est.) |
| East Renfrewshire | 25.68% | 74.32% |
| Tooting | 25.59% | 74.41%(est.) |
| Hornsey and Wood Green | 24.98% | 75.02% |
| Manchester, Withington | 24.94% | 75.06%(est.) |
| Lewisham, Deptford | 24.43% | 75.57%(est.) |
| Tottenham | 23.78% | 76.22% |
| Hampstead and Kilburn | 23.73% | 76.27%(est.) |
| Dulwich and West Norwood | 22.94% | 77.06%(est.) |
| Hackney South and Shoreditch | 22.78% | 77.22%(est.) |
| Vauxhall | 22.43% | 77.57% |
| Edinburgh South | 22.15% | 77.85% |
| Battersea | 22.05% | 77.95%(est.) |
| Edinburgh North and Leith | 21.8% | 78.2% |
| Foyle | 21.74% | 78.26% |
| Glasgow North | 21.62% | 78.38% |
| Islington North | 21.61% | 78.39% |
| Bristol West | 20.71% | 79.29% |
| Streatham | 20.54% | 79.46% |
| Hackney North and Stoke Newington | 20.48% | 79.52%(est.) |
Most heavily tilted areas
Most heavily Leave areas
The following were the ten voting areas that voted most heavily in favour of leave. All but one of them were in the East Midlands and East of England regions, with four of the ten, including the top two, located in Lincolnshire.
| Ranking | Voting area | Voter turnout, of eligible |
Votes | Proportion of votes | Region | ||
|---|---|---|---|---|---|---|---|
| Remain | Leave | Remain | Leave | ||||
| 1 | Boston | 77.2% | 7,430 | 22,974 | 24.4% | 75.6% | East Midlands |
| 2 | South Holland | 75.3% | 13,074 | 36,423 | 26.4% | 73.6% | East Midlands |
| 3 | Castle Point | 75.3% | 14,154 | 37,691 | 27.3% | 72.7% | East of England |
| 4 | Thurrock | 72.7% | 22,151 | 57,765 | 27.7% | 72.3% | East of England |
| 5 | Great Yarmouth | 69.0% | 14,284 | 35,844 | 28.5% | 71.5% | East of England |
| 6 | Fenland | 73.7% | 15,055 | 37,571 | 28.6% | 71.4% | East of England |
| 7 | Mansfield | 72.6% | 16,417 | 39,927 | 29.1% | 70.9% | East Midlands |
| 8 | Bolsover | 72.3% | 12,242 | 29,730 | 29.2% | 70.8% | East Midlands |
| 9 | East Lindsey | 74.9% | 23,515 | 56,613 | 29.3% | 70.7% | East Midlands |
| 10 | North East Lincolnshire | 67.9% | 23,797 | 55,185 | 30.1% | 69.9% | Yorkshire and the Humber |
Most heavily Remain areas
The following were the ten voting areas that voted most heavily in favour of remain. Of the ten, seven were in the Greater London region.
| Ranking | Voting area | Voter turnout, of eligible |
Votes | Proportion of votes | Region | ||
|---|---|---|---|---|---|---|---|
| Remain | Leave | Remain | Leave | ||||
| 1 | Gibraltar | 83.5% | 19,322 | 823 | 95.9% | 4.1% | British Overseas Territory |
| 2 | Lambeth | 67.3% | 111,584 | 30,340 | 78.6% | 21.4% | Greater London |
| 3 | Hackney | 65.1% | 83,398 | 22,868 | 78.5% | 21.5% | Greater London |
| 4 | Foyle | 57.4% | 32,064 | 8,905 | 78.3% | 21.7% | Northern Ireland |
| 5 | Haringey | 70.5% | 79,991 | 25,855 | 75.6% | 24.4% | Greater London |
| 6 | City of London | 73.5% | 3,312 | 1,087 | 75.3% | 24.7% | Greater London |
| 7 | Islington | 70.3% | 76,420 | 25,180 | 75.2% | 24.8% | Greater London |
| 8 | Wandsworth | 71.9% | 118,463 | 39,421 | 75.0% | 25.0% | Greater London |
| 9 | Camden | 65.4% | 71,295 | 23,838 | 74.9% | 25.1% | Greater London |
| 10 | City of Edinburgh | 72.9% | 187,796 | 64,498 | 74.4% | 25.6% | Scotland |
Most evenly divided areas
The narrowest margin of victory for any of the 382 voting areas in the United Kingdom was in the Scottish council area of Moray, which voted by just 122 votes or 0.25% margin in favour of Remain.
In England the narrowest margins of victory for Leave were in Watford which voted by just 252 votes or 0.54% margin in favour of Leave, and in Cherwell which voted by just 500 votes or 0.61% margin in favour of Leave. The narrowest margin of victory for Remain was in the London Borough of Bromley, which voted by just 2,364 votes or a 1.30% margin in favour of Remain.
Narrowest Leave vote
| Voting Area | Voter turnout, of eligible |
Votes | Proportion of votes | Region | Majority | ||
|---|---|---|---|---|---|---|---|
| Remain | Leave | Remain | Leave | ||||
| Watford | 71.6% | 23,167 | 23,419 | 49.7% | 50.3% | East of England | 252 |
Turnout by age group
After the referendum, the annual British Social Attitudes survey questioned the public on their participation. Interviewing was mainly carried out between July and October 2016 and respondents were subdivided into three age groups (18-34, 35-64 and >65).[16] The survey revealed that turnout was higher in the older age groups, and was 64%, 80% and 89% respectively. The age disparity had also been a feature of previous elections and referendums. However, compared to the previous referendum in 2011, the young voters' turnout in 2016 had increased sharply by 31%, while turnout by the two older age categories had also increased, but only by 26% and 21%.
Irregularities
In July 2018, Vote Leave was found to have broken electoral law, spending over its limit, by the UK Electoral Commission.[17] Connected to this, the Information Commissioner's Office found that data had been unlawfully harvested from UK voters, and issued a notice of intent to fine Facebook £500,000.[18] Also, the House of Commons Culture, Media and Sport Select Committee, released an interim report on 'Disinformation and 'fake news, stating that Russia had engaged in "unconventional warfare" through Twitter and other social media against the United Kingdom, designed to amplify support for a "leave" vote in Brexit. It also found that it could not be satisfied that the largest donor in the Brexit campaign, Arron Banks, used money from UK sources, and may have been financed by the Russian government.[19] In July 2018 the Electoral Commission,[17] Information Commissioner's Office,[18] and the House of Commons Digital, Culture, Media and Sport Committee issued reports, finding variously criminal offences of overspending by Vote Leave, data offences, and foreign interference by Russia.[20] In August 2018, this led to legal challenges to declare the referendum void for violating common law and United Kingdom constitutional law.[21]
See also
- Results of the 2016 United Kingdom European Union membership referendum by constituency
- European Union Referendum Act 2015
- European Communities Act 1972 (UK)
- 1975 United Kingdom European Communities membership referendum
- Results of the 1975 United Kingdom European Communities membership referendum
- Referendum Act 1975
- European Union (Amendment) Act 2008
- European Union Act 2011
- 2015–16 United Kingdom renegotiation of European Union membership
- European Union (Notification of Withdrawal) Act 2017
- European Union (Withdrawal) Act 2018
Notes
- Vote totals for Belfast are based on the returns from the four parliamentary constituencies in Belfast. These include areas in districts outside the City of Belfast
References
- "European Union Referendum Bill (HC Bill 2)". Publications.parliament.uk. 28 May 2015. Retrieved 12 June 2015.
- Rowena Mason; Nicholas Watt; Ian Traynor; Jennifer Rankin (20 February 2016). "EU referendum to take place on 23 June, David Cameron confirms | Politics". The Guardian. Retrieved 2 February 2016.
- European Referendum Act 2015 Section 11.
- "Political Parties, Elections and Referendums Act 2000, s. 128(2)". Legislation.gov.uk. Retrieved 6 July 2016.
- EU referendum results Electoral Commission
- "EU referendum results". Electoral Commission. Archived from the original on 30 June 2019.
- "PressReader.com - Connecting People Through News".
- "Revised estimates of Leave vote share in Westminster constituencies". 18 August 2016.
- Rosenbaum, Martin (6 February 2017). "Local voting figures shed new light on EU referendum" – via www.bbc.co.uk.
- "Curtice: New EU voting data suggests economic argument crucial to indyref 2".
- Ley, Shaun (18 August 2016). "The dilemma facing Scotland's Eurosceptic nationalists" – via www.bbc.co.uk.
- Brooks, Libby (7 July 2016). "Scottish Brexit voters pose quandary for independence campaign" – via The Guardian.
- Perraudin, Frances (22 September 2019). "English people living in Wales tilted it towards Brexit, research finds" – via www.theguardian.com.
- "Revised estimates of leave vote in Westminster constituencies". Retrieved 26 October 2016.
- Library, House of Commons (6 February 2017). "Brexit: votes by constituency".
- "British Social Attitudes 34. Chapter: The Vote to Leave the EU" (PDF). NatCen Social Research. 2017. Retrieved 24 July 2017.
- Electoral Commission, 'Report of an investigation' (July 2018)
- Information Commissioner’s Office, 'Investigation into the use of data analytics in political campaigns: Investigation Update' (10 July 2018)
- House of Commons Culture, Media and Sport Select Committee, 'Disinformation and 'fake news': Interim Report' (July 2018) (July 2018) ch 5, Russian influence in political campaigns.
- House of Commons Culture, Media and Sport Select Committee, 'Disinformation and 'fake news': Interim Report' (July 2018) ch 5, Russian influence in political campaigns.
- 'Grounds for Judicial Review' in Wilson v Prime Minister (2018). See further, E McGaughey, 'Could Brexit be void? (2018) SSRN, also summarised on 'Verfassungsblog
| Referendum question | |||||||||||||
|---|---|---|---|---|---|---|---|---|---|---|---|---|---|
| Referendum legislation | |||||||||||||
| Background |
| ||||||||||||
| Campaign | |||||||||||||
| Campaign organisations |
| ||||||||||||
| Aftermath of referendum |
| ||||||||||||
| Brexit process |
| ||||||||||||
| Impact of Brexit and Potential effects | |||||||||||||
| Brexit legislation | |||||||||||||
| Related | |||||||||||||
| Media depictions |
| ||||||||||||
| |||||||||||||
| General elections |
|
|---|---|
| Local elections |
|
| European elections | |
| Referendums | |