1885 United Kingdom general election
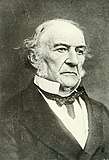
The 1885 United Kingdom general election was held from 24 November to 18 December 1885. This was the first general election after an extension of the franchise and redistribution of seats. For the first time a majority of adult males could vote and most constituencies by law returned a single member to Parliament fulfilling one of the ideals of Chartism to provide direct single-member, single-electorate accountability. It saw the Liberals, led by William Ewart Gladstone, win the most seats, but not an overall majority. As the Irish Nationalists held the balance of power between them and the Conservatives who sat with an increasing number of allied Unionist MPs (referring to the Union of Great Britain and Ireland), this exacerbated divisions within the Liberals over Irish Home Rule and led to a Liberal split and another general election the following year.
| ||||||||||||||||||||||||||||||||||||||||||||||||||||||||||||||||||||||||||||||||||
All 670 seats in the House of Commons 336 seats needed for a majority | ||||||||||||||||||||||||||||||||||||||||||||||||||||||||||||||||||||||||||||||||||
|---|---|---|---|---|---|---|---|---|---|---|---|---|---|---|---|---|---|---|---|---|---|---|---|---|---|---|---|---|---|---|---|---|---|---|---|---|---|---|---|---|---|---|---|---|---|---|---|---|---|---|---|---|---|---|---|---|---|---|---|---|---|---|---|---|---|---|---|---|---|---|---|---|---|---|---|---|---|---|---|---|---|---|
| ||||||||||||||||||||||||||||||||||||||||||||||||||||||||||||||||||||||||||||||||||
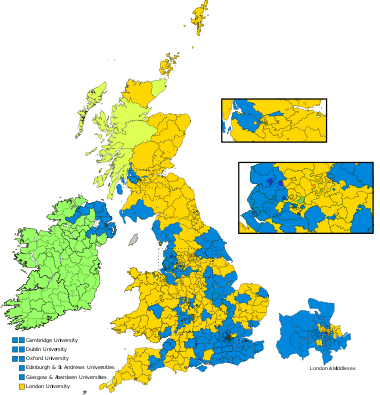 Colours denote the winning party | ||||||||||||||||||||||||||||||||||||||||||||||||||||||||||||||||||||||||||||||||||
| ||||||||||||||||||||||||||||||||||||||||||||||||||||||||||||||||||||||||||||||||||
.jpg)
The 1885 election saw the first socialist party participate, with the Social Democratic Federation led by H. M. Hyndman standing three candidates.
Results
| 319 | 86 | 247 | 11 | 7 |
| Liberal | IPP | Conservative | IL |
| UK General Election 1885 | |||||||||||||||
|---|---|---|---|---|---|---|---|---|---|---|---|---|---|---|---|
| Party | Candidates | Votes | |||||||||||||
| Stood | Elected | Gained | Unseated | Net | % of total | % | No. | Net % | |||||||
| Liberal | 575 | 319 | −33 | 47.61 | 47.65 | 2,071,868 | −7.3 | ||||||||
| Conservative | 597 | 247 | +10 | 36.87 | 43.00 | 1,869,560 | +0.9 | ||||||||
| Irish Parliamentary | 91 | 86 | +23 | 12.84 | 6.88 | 299,178 | +4.0 | ||||||||
| Independent Liberal | 35 | 11 | +11 | 1.64 | 1.28 | 55,652 | N/A | ||||||||
| Crofters | 6 | 4 | +4 | 0.60 | 0.38 | 16,551 | N/A | ||||||||
| Ind. Conservative | 8 | 2 | +2 | 0.30 | 0.29 | 12,599 | N/A | ||||||||
| Lib-Lab | 4 | 1 | +1 | 0.15 | 0.19 | 8,232 | N/A | ||||||||
| Independent | 6 | 0 | 0 | 0 | 0.15 | 6,570 | N/A | ||||||||
| Independent Nationalist | 2 | 0 | 0 | 0 | 0.07 | 2,889 | N/A | ||||||||
| Scottish Land Restoration | 5 | 0 | 0 | 0 | 0.05 | 2,359 | N/A | ||||||||
| Irish Loyalist | 6 | 0 | 0 | 0 | 0.04 | 1,869 | N/A | ||||||||
| Social Democratic Federation | 3 | 0 | 0 | 0 | 0.02 | 657 | N/A | ||||||||
Voting summary
Seats summary
See also
- List of MPs elected in the 1885 United Kingdom general election
- Parliamentary franchise in the United Kingdom 1885–1918
- Representation of the People Act 1884
- Redistribution of Seats Act 1885
- 1885 United Kingdom general election in Ireland
- 1885 United Kingdom general election in Scotland
- Hawarden Kite, Gladstone announces for Home Rule and wins over the Irish
Notes
- All parties shown.
References
- Craig, F. W. S. (1989), British Electoral Facts: 1832–1987, Dartmouth: Gower, ISBN 0900178302
- Rallings, Colin; Thrasher, Michael, eds. (2000), British Electoral Facts 1832–1999, Ashgate Publishing Ltd
Further reading
- Walker, Brian (2005), "The 1885 and 1886 General Elections in Ireland", History Ireland, 13 (6): 36–40, JSTOR 27725365
External links
- Spartacus: Political Parties and Election Results
- United Kingdom election results—summary results 1885–1979
| General elections |
|
|---|---|
| Local elections |
|
| European elections | |
| Referendums | |