1999 European Parliament election in the United Kingdom
The European Parliament Election, 1999 was the United Kingdom's part of the European Parliament election 1999. It was held on 10 June 1999. Following the European Parliamentary Elections Act 1999, it was the first European election to be held in the United Kingdom where the whole country used a system of proportional representation. In total, 87 Members of the European Parliament were elected from the United Kingdom across twelve new regional constituencies.
| |||||||||||||||||||||||||||||||||||||||||||||||||
All 87 seats of the United Kingdom's seats in the European Parliament | |||||||||||||||||||||||||||||||||||||||||||||||||
|---|---|---|---|---|---|---|---|---|---|---|---|---|---|---|---|---|---|---|---|---|---|---|---|---|---|---|---|---|---|---|---|---|---|---|---|---|---|---|---|---|---|---|---|---|---|---|---|---|---|
| Turnout | 24.0% ( | ||||||||||||||||||||||||||||||||||||||||||||||||
| |||||||||||||||||||||||||||||||||||||||||||||||||
 Colours denote the winning party, as shown in the main table of results | |||||||||||||||||||||||||||||||||||||||||||||||||
| |||||||||||||||||||||||||||||||||||||||||||||||||
.jpg)
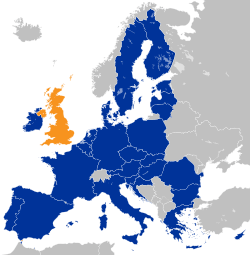
| Part of a series of articles on | ||||||||||
| British membership of the European Union | ||||||||||
|---|---|---|---|---|---|---|---|---|---|---|
 | ||||||||||
|
Treaty amendments
|
||||||||||
|
|
||||||||||
|
Officials and bodies |
||||||||||
|
Issues and events |
||||||||||
|
|
||||||||||
|
| ||||||||||
The change in voting system resulted in significant changes in seats. The Conservatives won double the number of seats they had won in the previous European election, in 1994, while the Labour Party saw its seats reduced from 62 to 29. The Liberal Democrats saw their number of seats increase to 10 from just 2 in the previous election. The UK Independence Party (UKIP), Green Party and Plaid Cymru gained their first ever seats in the European Parliament.
The House of Commons Library calculated notional seat changes based on what the result would have been if the 1994 European elections had been held under proportional representation.[2] The notional results and seat changes are shown in the results box for this article.
It was the first European Parliament election to be held since the 1997 general election which resulted in a change of government from Conservative to Labour.
Turnout was 24%, the lowest of any member state in the 1999 election where the EU average was 49.51%. It was also the lowest of any European election in the United Kingdom, and the lowest of any member state until the 2009 election and to date is the lowest turnout for any national election in the United Kingdom in electoral history.[1]
Background
Electoral system
The European Parliamentary Elections Act 1999 introduced a closed-list party list system method of proportional representation, calculated using the D'Hondt method into Great Britain. In Northern Ireland, the Single Transferable Vote, which is also a form of proportional representation, which had been used since the first European election in 1979 was retained. The Act also created twelve new electoral regions, which were based on the British government's nine administrative Regions of England, Northern Ireland, Scotland and Wales. The effect of the introduction of proportional representation was that many small parties won seats to the European Parliament for the first time.
Results
United Kingdom
.svg.png)
The Conservatives doubled the number of seats from the last European election. Labour saw their 62 seats reduced to just 29. It was the first European Parliament election to be held since the change of United Kingdom government from Conservative to Labour two years earlier. The Liberal Democrats saw their number of seats increase to 10 from just 2 in the previous election. The UK Independence Party, Green Party and Plaid Cymru won their first ever seats in the European Parliament.
These changes were largely due to the move to proportional representation from first-past-the-post.[3] The House of Commons Library calculated that if the 1994 European elections had been held under proportional representation, Labour would have won 43 MEPs, the Conservatives 26, the Lib Dems 11, the SNP 3 and Plaid Cymru 1.[2]
| Party | Votes won | % of vote | Change | Seats | % of seats | Loss/Gain vs actual '94 result |
Loss/Gain vs notional '94 result | |
|---|---|---|---|---|---|---|---|---|
| Conservative | 3,578,218 | 33.5 | 36 | 41.4 | ||||
| Labour | 2,803,821 | 26.3 | 29 | 33.3 | ||||
| Liberal Democrats | 1,266,549 | 11.9 | 10 | 11.9 | ||||
| UKIP | 696,057 | 6.5 | 3 | 3.4 | ||||
| Green | 568,236 | 5.3 | 2 | 2.4 | ||||
| SNP | 268,528 | 2.5 | 2 | 2.3 | ||||
| DUP | 192,762 | 1.8 | 1 | 1.1 | ||||
| SDLP | 190,731 | 1.8 | 1 | 1.1 | ||||
| Plaid Cymru | 185,235 | 1.7 | 2 | 2.3 | ||||
| Pro-Euro Conservative | 138,097 | 1.3 | New | 0 | ||||
| UUP | 119,507 | 1.1 | 1 | 1.1 | ||||
| Sinn Féin | 117,643 | 1.1 | 0 | |||||
| BNP | 102,647 | 1.0 | New | 0 | ||||
| Liberal | 93,051 | 0.9 | 0 | |||||
| Socialist Labour | 86,749 | 0.8 | New | 0 | ||||
| Scottish Green | 57,142 | 0.5 | 0 | |||||
| Scottish Socialist | 39,720 | 0.4 | New | 0 | ||||
| PUP | 22,494 | 0.2 | New | 0 | ||||
| Natural Law | 21,327 | 0.2 | 0 | |||||
| UK Unionist | 20,283 | 0.2 | New | 0 | ||||
| Alliance | 14,391 | 0.1 | 0 | |||||
| Socialist Alliance | 7,203 | 0.1 | New | 0 | ||||
| Humanist | 2,586 | 0.0 | New | 0 | ||||
| Weekly Worker | 1,724 | 0.0 | New | 0 | ||||
| Socialist (GB) | 1,510 | 0.0 | New | 0 | ||||
| Others | 84,872 | 0.8 | 0 | |||||
| Total | 10,681,083 | 87 | 100 | |||||
| Source: BBC News,[4] UK Parliament Briefing[2] | ||||||||
Great Britain
Summary of the election results for Great Britain
| Party | Votes won | % of vote | Loss/Gain | Seats | % of seats | Loss/Gain vs actual '94 result |
Loss/Gain vs notional '94 result | |||||||
|---|---|---|---|---|---|---|---|---|---|---|---|---|---|---|
| Conservative | 3,578,218 | 35.8 | 36 | 42.9 | ||||||||||
| Labour | 2,803,821 | 28.0 | 29 | 34.5 | ||||||||||
| Liberal Democrats | 1,266,549 | 12.7 | 10 | 11.9 | ||||||||||
| UKIP | 696,057 | 7.0 | 3 | 3.6 | ||||||||||
| Green | 568,236 | 6.3 | 2 | 2.4 | ||||||||||
| SNP | 268,528 | 2.7 | 2 | 2.4 | ||||||||||
| Plaid Cymru | 185,235 | 1.9 | 2 | 2.4 | ||||||||||
| Pro-Euro Conservative | 138,097 | 1.4 | New | 0 | ||||||||||
| BNP | 102,647 | 1.0 | New | 0 | ||||||||||
| Liberal | 93,051 | 0.9 | 0 | |||||||||||
| Socialist Labour | 86,749 | 0.9 | New | 0 | ||||||||||
| Scottish Green | 57,142 | 0.6 | 0 | |||||||||||
| Scottish Socialist | 39,720 | 0.4 | New | 0 | ||||||||||
| Natural Law | 20,329 | 0.4 | 0 | |||||||||||
| Socialist Alliance | 7,203 | 0.1 | New | 0 | ||||||||||
| Humanist | 2,586 | 0.0 | New | 0 | ||||||||||
| Weekly Worker | 1,724 | 0.0 | New | 0 | ||||||||||
| Socialist (GB) | 1,510 | 0.1 | New | 0 | ||||||||||
| Others | 84,872 | 0.8 | 0 | |||||||||||
| Total | 10,002,273 | 84 | 100 | |||||||||||
| Source: BBC News,[4] UK Parliament Briefing[2] | ||||||||||||||
Northern Ireland
Summary of the election results for Northern Ireland[4]
| European Parliament election 1999: Northern Ireland[5] | ||||||
|---|---|---|---|---|---|---|
| Party | Candidate(s) | Seats | Loss/Gain | First Preference Votes | ||
| Number | % of vote | |||||
| DUP | Ian Paisley | 1 | 0 | 192,762 | 28.4 | |
| SDLP | John Hume | 1 | 0 | 190,731 | 28.1 | |
| UUP | Jim Nicholson | 1 | 0 | 119,507 | 17.6 | |
| Sinn Féin | Mitchel McLaughlin | 0 | 0 | 117,643 | 17.3 | |
| PUP | David Ervine | 0 | 0 | 22,494 | 3.3 | |
| UK Unionist | Robert McCartney | 0 | 0 | 20,283 | 3.0 | |
| Alliance | Seán Neeson | 0 | 0 | 14,391 | 2.1 | |
| Natural Law | James Anderson | 0 | 0 | 998 | 0.2 | |
| Turnout | 678,809 | |||||
MEPs defeated
Labour
- Angela Billingham (East Midlands)
- Susan Waddington (East Midlands)
- Veronica Hardstaff (East Midlands)
- Clive Needle (East of England)
- Peter Truscott (East of England)
- David Thomas (East of England)
- Carole Tongue (London)
- Shaun Spiers (London)
- Mary Honeyball (London)
- Michael Elliot (London)
- Dr Gordon Adam (North East)
- Tony Cunningham (North West)
- Mark Hendrick (North West)
- Hugh McMahon (Scotland)
- Anita Pollack (South East England)
- Ian White (South West England)
- Joe Wilson (Wales)
- David Morris (Wales)
- Michael Tappin (West Midlands)
- David Hallam (West Midlands)
- Roger Barton (Yorkshire and the Humber)
- Barry Seal (Yorkshire and the Humber)
Liberal Democrat
Conservative
Pro-Euro Conservative Party
- John Stevens, former Conservative MEP (South East England)
- Brendan Donnelly, former Conservative MEP (West Midlands)
Independent Labour
- Christine Oddy, former Labour MEP (West Midlands)
Scottish Socialist Party
- Hugh Kerr, former Labour MEP (Essex West and Hertfordshire East)
Leeds Left Alliance
- Ken Coates, former Labour MEP (East Midlands)
Aftermath
Labour's results brought about a debate within the party about the introduction of proportional representation. In September 1998, a poll of 150 MPs had found that 58% backed the introduction of proportional representation. A follow up poll ran on the Sunday after the election found that this had decreased to 43%, with the majority wanting a return to the first-past-the-post system.[6] It has also been argued, however, that the introduction of proportional representation actually reduced Labour's losses, as first-past-the-post is more sensitive to swings in public opinion.[7]
See also
- Elections in the United Kingdom: European elections
- Members of the European Parliament for the United Kingdom 1999–2004
- Members of the European Parliament for the United Kingdom 1999–2004 by region
References
- "Previous European Parliamentary Elections – About Parliament". European Parliament. Retrieved 26 May 2019.
- "European Parliament Elections June 1999 - Commons Library briefing". UK Parliament. 21 June 1999. Retrieved 5 March 2019.
- "Success for smaller parties". BBC News. 14 June 1999. Retrieved 26 May 2014.
- "Euro Elections, Results - Great Britain and Northern Ireland". BBC News. Retrieved 24 May 2014.
- The 1999 European Election, Northern Ireland Elections
- "Labour postmortem begins". BBC News. 14 June 1999. Retrieved 25 May 2014.
- "Robin Oakley's Westminister Week - The Euro fallout". BBC News. 14 June 1999. Retrieved 26 May 2014.
External links
- Breakdown of results by Region
- House of Commons Research Paper 99/64 "Elections to the European Parliament – June 1999"
| 1979 | |
|---|---|
| 1984 | |
| 1989 | |
| 1994 | |
| 1999 | |
| 2004 | |
| 2009 | |
| 2014 | |
| 2019 | |
| 2024 |
|
| Off-year | |
| Legislation | |||||
|---|---|---|---|---|---|
| Delegations | |||||
| Elections |
| ||||
| Members | |||||
| Constituencies | |||||
| Voting systems |
| ||||
| Other |
| ||||
| General elections |
|
|---|---|
| Local elections |
|
| European elections | |
| Referendums | |