2004 European Parliament election in the United Kingdom
The European Parliament election, 2004 was the United Kingdom's part of the wider 2004 European Parliament election which was held between 10 and 13 June 2004 in the 25 member states of the European Union. The United Kingdom's part of this election was held on Thursday 10 June 2004. The election also coincided with the 2004 local elections and the London Assembly and mayoral elections. In total, 78 Members of the European Parliament were elected from the United Kingdom using proportional representation.
| |||||||||||||||||||||||||||||||||||||||||||||||||||||||||||||||||||||||||||||
All 78 of the United Kingdom's seats in the European Parliament | |||||||||||||||||||||||||||||||||||||||||||||||||||||||||||||||||||||||||||||
|---|---|---|---|---|---|---|---|---|---|---|---|---|---|---|---|---|---|---|---|---|---|---|---|---|---|---|---|---|---|---|---|---|---|---|---|---|---|---|---|---|---|---|---|---|---|---|---|---|---|---|---|---|---|---|---|---|---|---|---|---|---|---|---|---|---|---|---|---|---|---|---|---|---|---|---|---|---|
| Turnout | 38.5%[1] | ||||||||||||||||||||||||||||||||||||||||||||||||||||||||||||||||||||||||||||
| |||||||||||||||||||||||||||||||||||||||||||||||||||||||||||||||||||||||||||||
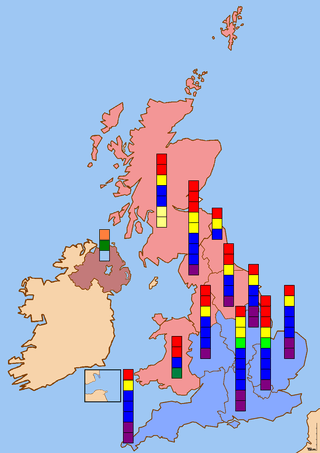 Colours denote the winning party, as shown in the results tables
*Seat change has been adjusted to allow for direct comparison with the results from the 1999 election.[2] ‡Notional 1999 results | |||||||||||||||||||||||||||||||||||||||||||||||||||||||||||||||||||||||||||||
| |||||||||||||||||||||||||||||||||||||||||||||||||||||||||||||||||||||||||||||
.jpg)
.jpg)
.jpg)
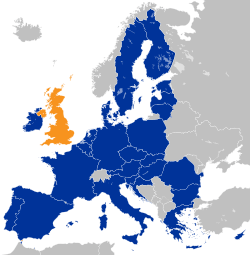
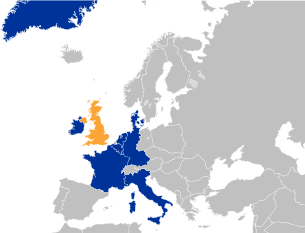
| Part of a series of articles on | ||||||||||
| British membership of the European Union | ||||||||||
|---|---|---|---|---|---|---|---|---|---|---|
 | ||||||||||
|
Treaty amendments
|
||||||||||
|
|
||||||||||
|
Officials and bodies |
||||||||||
|
Issues and events |
||||||||||
|
|
||||||||||
|
| ||||||||||
The Conservative Party and the Labour Party both polled poorly. The Conservatives experienced their second-lowest ever recorded vote share in a national election (even less than their 1832 nadir, although the party would do worse still in the 2014 and 2019 elections), and Labour their lowest since 1918. The UK Independence Party (UKIP) saw a large increase in support, increasing its number of MEPs from 3 to 12 and on popular vote pushed the Liberal Democrats, who themselves had increased their representation from 10 to 12 seats into fourth place. In Northern Ireland, Sinn Féin beat the SDLP in the polls and took its first Northern Ireland seat.
Background
Electoral system
The United Kingdom elected 78 Members of the European Parliament using proportional representation. The United Kingdom was divided into twelve multi-member constituencies. The eleven of these regions which form Great Britain used a closed-list party list system method of proportional representation, calculated using the D'Hondt method. Northern Ireland used the Single Transferable Vote (STV). As a consequence of the 2004 enlargement of the European Union, the number of seats allocated to the United Kingdom was fewer than in 1999.
It was the first European election to be held in the United Kingdom using postal-only voting in four areas: the North East, North West, Yorkshire and the Humber, and East Midlands regions.[3]
Regional seat allocations
A combination of the effects of the Treaty of Nice and the 2004 enlargement of the European Union meant that the number of seats allocated to the United Kingdom for the 2004 election was reduced from the 87 MEPs allocated for the 1999 election to 78 MEPs.[4][5]
As a result of the successful challenge of Matthews v United Kingdom before the European Court of Human Rights in 1999[6] residents of Gibraltar, voted in the European Parliament election for the first time, as part of the South West England region.[7]
Changes in regional seat allocations[8]
| Constituency | Representation in 1999 | Representation in 2004 | Net Gain/Loss |
|---|---|---|---|
| East Midlands | 6 | 6 | 0 |
| East of England | 8 | 7 | -1 |
| London | 10 | 9 | -1 |
| North East England | 4 | 3 | -1 |
| North West England | 10 | 9 | -1 |
| Northern Ireland | 3 | 3 | 0 |
| Scotland | 8 | 7 | -1 |
| South East England | 11 | 10 | -1 |
| South West England1 | 7 | 7 | 0 |
| Wales | 5 | 4 | -1 |
| West Midlands | 8 | 7 | -1 |
| Yorkshire and the Humber | 7 | 6 | -1 |
| Overall | 87 | 78 | -9 |
1 Includes Gibraltar, the only British overseas territory which is part of the EU.
Results
.svg.png)
Turnout for all the regions was 37.6% on an electorate of 45,309,760. The Conservatives and Labour both polled poorly. The Conservatives, although getting a vote share 4.1% greater than Labour, experienced their lowest vote share in a national election since 1832. Labour's vote share was its lowest since 1918. Labour's decline in votes was regarded as being largely due to widespread public dissatisfaction about the Iraq War and, as with the Conservatives, the increased popularity of UKIP. UKIP saw a large increase in support, increasing its number of MEPs from 3 to 12, drawing level with the Liberal Democrats, who themselves had increased their representation from 10 to 12 seats. UKIP polled higher than the Liberal Democrats and pushing them into fourth place.
Turnout was lowest in Scotland, which did not hold local elections on the same day. In Scotland, Labour topped the poll, followed by the Scottish National Party (SNP). The Conservative Party's share of the vote declined by 2 percent, making it the region with the smallest swing against them.[8]
Wales was the only region were Labour increased its share of the vote compared to 1999. The Conservatives managed to make gains pushing Plaid Cymru into third and whose share of the vote fell by 12 percentage points relative to 1999. Similarly UKIP narrowly beat the Liberal Democrats into fourth place. Wales was the region were the Green Party polled their lowest share of the vote.[8]
United Kingdom
| Party | Votes won | % of vote | Loss/Gain | Seats | Loss/Gain† | % of seats | |
|---|---|---|---|---|---|---|---|
| Conservative | 4,397,090 | 25.9 | -7.6 | 27 | -8 | 34.6 | |
| Labour | 3,718,683 | 21.9 | -4.4 | 19 | -6 | 24.4 | |
| UKIP | 2,650,768 | 15.6 | +9.1 | 12 | +10 | 15.4 | |
| Liberal Democrats | 2,452,327 | 14.4 | +2.6 | 12 | +2 | 15.4 | |
| Green | 948,588 | 5.6 | +0.3 | 2 | +2 | 2.6 | |
| BNP | 808,201 | 4.8 | +3.8 | 0 | 0 | 0 | |
| Respect | 252,216 | 1.5 | New | 0 | 0 | 0 | |
| SNP | 231,505 | 1.4 | -1.2 | 2 | 0 | 2.6 | |
| DUP | 175,761 | 1.0 | -0.8 | 1 | 0 | 1.3 | |
| Plaid Cymru | 159,888 | 0.9 | -0.8 | 1 | 0 | 1.3 | |
| Sinn Féin | 144,541 | 0.9 | -0.3 | 1 | +1 | 1.3 | |
| English Democrat | 130,056 | 0.8 | New | 0 | 0 | 0 | |
| Liberal | 96,325 | 0.6 | -0.3 | 0 | 0 | 0 | |
| Independent - Martin Bell | 93,028 | 0.6 | New | 0 | 0 | 0 | |
| UUP | 91,164 | 0.5 | -0.6 | 1 | 0 | 1.3 | |
| SDLP | 87,559 | 0.5 | -1.3 | 0 | -1 | 0 | |
| Scottish Green | 79,695 | 0.5 | -0.1 | 0 | 0 | 0 | |
| Scottish Socialist | 61,356 | 0.4 | New | 0 | 0 | 0 | |
| Christian Peoples Alliance | 56,771 | 0.3 | New | 0 | 0 | 0 | |
| Senior Citizens | 42,861 | 0.3 | New | 0 | 0 | 0 | |
| Countryside Party | 42,107 | 0.2 | New | 0 | 0 | 0 | |
| Independent - Herron | 39,658 | 0.2 | New | 0 | 0 | 0 | |
| Independent - Gilliland | 36,270 | 0.2 | New | 0 | 0 | 0 | |
| Pensioners | 33,501 | 0.2 | New | 0 | 0 | 0 | |
| Christian Vote | 21,056 | 0.1 | New | 0 | 0 | 0 | |
| ProLife Alliance | 20,393 | 0.1 | New | 0 | 0 | 0 | |
| Forward Wales | 17,280 | 0.1 | New | 0 | 0 | 0 | |
| Independent - Ellis | 14,762 | 0.1 | New | 0 | 0 | 0 | |
| People's Party for Better Government | 13,776 | 0.1 | New | 0 | 0 | 0 | |
| Peace | 12,572 | 0.1 | New | 0 | 0 | 0 | |
| Socialist Environmental | 9,172 | 0.1 | New | 0 | 0 | 0 | |
| Common Good | 8,650 | 0.1 | New | 0 | 0 | 0 | |
| Independent - Neal | 8,318 | 0.0 | New | 0 | 0 | 0 | |
| Scottish Wind Watch | 7,255 | 0.0 | New | 0 | 0 | 0 | |
| Christian Democratic Party | 6,821 | 0.0 | New | 0 | 0 | 0 | |
| Independent - Rhodes | 5,671 | 0.0 | New | 0 | 0 | 0 | |
| Independent - Naisbitt | 5,137 | 0.0 | New | 0 | 0 | 0 | |
| Green (NI) | 4,810 | 0.0 | New | 0 | 0 | 0 | |
| Independent - Tait | 3,624 | 0.0 | New | 0 | 0 | 0 | |
| Independent - Rogers | 2,615 | 0.0 | New | 0 | 0 | 0 | |
| Independent - Shadmyraine | 847 | 0.0 | New | 0 | 0 | 0 | |
| Total | 16,443,397 | — | — | 78 | — | — | |
- All parties listed.
†Loss/gain figures for seats are losses/gains versus the 1999 notional result, as the number of MEPs overall fell.
Great Britain
Summary of the election results for Great Britain[2]
| Party | Votes won | % of vote | Loss/Gain | Seats | Loss/Gain† | % of seats | |
|---|---|---|---|---|---|---|---|
| Conservative | 4,397,090 | 26.7 | -9.0 | 27 | -8 | 36.0 | |
| Labour | 3,718,683 | 22.6 | -5.4 | 19 | -6 | 25.3 | |
| UKIP | 2,650,768 | 16.1 | +9.2 | 12 | +10 | 16.0 | |
| Liberal Democrats | 2,452,327 | 14.9 | +2.3 | 12 | +2 | 16.0 | |
| Green | 948,588 | 5.8 | +0.1 | 2 | +2 | 2.7 | |
| BNP | 808,201 | 4.9 | +3.9 | 0 | 0 | 0 | |
| Respect | 252,216 | 1.5 | New | 0 | 0 | 0 | |
| SNP | 231,505 | 1.4 | -1.3 | 2 | 0 | 2.7 | |
| Plaid Cymru | 159,888 | 1.0 | -0.9 | 1 | 0 | 1.3 | |
| English Democrat | 130,056 | 0.8 | New | 0 | 0 | 0 | |
| Liberal | 96,325 | 0.6 | -0.3 | 0 | 0 | 0 | |
| Independent - Martin Bell | 93,028 | 0.6 | New | 0 | 0 | 0 | |
| Scottish Green | 79,695 | 0.5 | -0.1 | 0 | 0 | 0 | |
| Scottish Socialist | 61,356 | 0.4 | New | 0 | 0 | 0 | |
| Christian Peoples Alliance | 56,771 | 0.3 | New | 0 | 0 | 0 | |
| Senior Citizens | 42,861 | 0.3 | New | 0 | 0 | 0 | |
| Countryside Party | 42,107 | 0.3 | New | 0 | 0 | 0 | |
| Independent - Herron | 39,658 | 0.2 | New | 0 | 0 | 0 | |
| Pensioners | 33,501 | 0.2 | New | 0 | 0 | 0 | |
| Christian Vote | 21,056 | 0.1 | New | 0 | 0 | 0 | |
| ProLife Alliance | 20,393 | 0.1 | New | 0 | 0 | 0 | |
| Forward Wales | 17,280 | 0.1 | New | 0 | 0 | 0 | |
| Independent - Herron | 14,762 | 0.1 | New | 0 | 0 | 0 | |
| People's Party for Better Government | 13,776 | 0.1 | New | 0 | 0 | 0 | |
| Peace | 12,572 | 0.1 | New | 0 | 0 | 0 | |
| Common Good | 8,650 | 0.1 | New | 0 | 0 | 0 | |
| Independent - Neal | 8,318 | 0.1 | New | 0 | 0 | 0 | |
| Scottish Wind Watch | 7,255 | 0.0 | New | 0 | 0 | 0 | |
| Christian Democratic Party | 6,821 | 0.0 | New | 0 | 0 | 0 | |
| Independent - Rhodes | 5,671 | 0.0 | New | 0 | 0 | 0 | |
| Independent - Naisbitt | 5,137 | 0.0 | New | 0 | 0 | 0 | |
| Independent - Tait | 3,624 | 0.0 | New | 0 | 0 | 0 | |
| Independent - Rogers | 2,615 | 0.0 | New | 0 | 0 | 0 | |
| Independent - Shadmyraine | 847 | 0.0 | New | 0 | 0 | 0 | |
| Total | 16,443,397 | — | — | 75 | — | — | |
- All parties listed.
†Loss/gain figures for seats are losses/gains versus the 1999 notional result, as the number of MEPs overall fell.
Gibraltar
Gibraltar participated in the United Kingdom's election for the first time in 2004 as part of the South West England constituency. Gibraltar is a British overseas territory (BOT) and therefore is under the jurisdiction and sovereignty of the United Kingdom but does not form part of it.[9] Gibraltar is however part of the EU, the only BOT to be so. Following however, the result of the successful challenge of Matthews v United Kingdom before the European Court of Human Rights in 1999[6] residents of Gibraltar were given the right to vote in the European Parliament elections. The British government decided not to give Gibraltar its own seat due to its small electorate of just over 20,000 which would have meant with just one seat Gibraltar would have been over-represented by about 30 times the average.[7]
None of the main Gibraltar political parties contested the election, so voters chose from United Kingdom party lists. However, Lyana Armstrong-Emery of Gibraltar's Reform Party had a place on a joint list with the Green Party. In addition both the leader of the Conservative Party, Michael Howard, and his deputy, Michael Ancram, campaigned in Gibraltar.[10]
Turnout in Gibraltar was 57.5%, higher than the 37.6% for the South West England electoral region as a whole.[11] The Conservative Party polled over two-thirds of the Gibraltar vote, with no other party exceeding 10% support.
Northern Ireland
Turnout in Northern Ireland was 51.2%.[12] Sinn Féin beat the SDLP in the polls and took its first Northern Ireland seat. Sinn Féin also won a seat in the corresponding elections in the Republic of Ireland.[13] Sinn Féin and the DUP increased their shares of the vote relative to the 1999 European Parliament elections, while the shares for both the SDLP and the UUP fell.[8] This was also the final election in which a Unionist candidate topped the poll in Northern Ireland.[14] Jim Allister of the DUP and Bairbre de Brún of Sinn Féin were elected in the first round while Jim Nicholson of the UUP was elected in the third stage, after the votes of the other candidates were reallocated.[8]
Summary of the election results for Northern Ireland[15]
| Party | Candidate(s) | Seats | Loss/Gain | First Preference Votes | ||
|---|---|---|---|---|---|---|
| Number | % of vote | |||||
| DUP | Jim Allister | 1 | 175,761 | 31.9 | ||
| Sinn Féin | Bairbre de Brún | 1 | 144,541 | 26.3 | ||
| UUP | Jim Nicholson | 1 | 91,164 | 16.6 | ||
| SDLP | Martin Morgan | 0 | 87,559 | 15.9 | ||
| Independent | John Gilliland | 0 | 36,270 | 6.6 | ||
| Socialist Environmental | Eamonn McCann | 0 | 9,172 | 1.6 | ||
| Green (NI) | Lindsay Whitcroft | 0 | 4,810 | 0.9 | ||
| Total | 549,277 | |||||
| Turnout | 51.2%[12] | |||||
MEPs defeated
Labour
- David Bowe (Yorkshire and the Humber)
- Bill Miller (Scotland)
- Brian Simpson (North West England) - returned to the European Parliament in September 2006 and subsequently defended his seat in 2009.[16]
- Mo O'Toole (North East England)
- Mark F. Watts (South East England)
Conservative
- Jacqueline Foster (North West England) - was subsequently reelected in the 2009 election.[17]
- Alexander Macmillan (South West England)
- Roy Perry (South East England)
- Ian Twinn (London) - only took seat on 21 October 2003 after the ill-health resignation of Lord Bethell.[18]
Plaid Cymru
Aftermath
Both Tony Blair and Michael Howard faced criticism for their results with then Secretary of State for Health John Reid calling the results "disappointing" for Labour and "disastrous" for the Conservatives.[19]
Shortly after the election UKIP's Robert Kilroy-Silk, who was credited with raising the profile of the party during the election, was interviewed by Channel 4 television about leadership ambitions, Kilroy-Silk did not deny having ambitions to lead the party, but stressed that Roger Knapman would lead it into the next general election. However, the next day, on Breakfast with Frost, he criticised Knapman's leadership.[20] After further disagreement with the leadership, Kilroy-Silk resigned the UKIP whip in the European Parliament on 27 October 2004.[21] Initially, he remained a member, while seeking a bid for the party leadership.[22] However, this was not successful and he resigned completely from UKIP on 20 January 2005, calling it a "joke".[23] Two weeks later, he founded his own party, Veritas, taking a number of UKIP members, including both of the London Assembly members, with him.[24]
UKIP formed a new European Parliament Group, Independence/Democracy which was co-chaired by Nigel Farage and Hanne Dahl.
References
- "Previous European Parliamentary Elections – About Parliament". European Parliament. Retrieved 26 May 2019.
- "European Election: United Kingdom Result". BBC News. Retrieved 22 May 2014.
- Research Paper 04/50 European Parliament elections 2004, House of Commons Library, 23 June 2004
- "Treaty of Nice: The other institutions and bodies of the Union". Europa. Retrieved 25 May 2014.
- "Changes in the distribution of seats in the European Parliament". Centre Virtuel de la Connaissance sur l'Europe. Retrieved 25 May 2014.
- Judgment of the European Court of Human Rights: Matthews v the United Kingdom
- "Court upholds Rock voting rights". BBC News. Retrieved 22 May 2014.
- Research Paper 04/50 European Parliament elections 2004, House of Commons Library, 23 June 2004, p. 8
- The 14 Territories
- Wilkinson, Isambard (18 May 2004). "The Tories won't let you down, Howard tells Gibraltar". The Daily Telegraph. Retrieved 19 September 2008.
- Reyes, Brian (8 June 2009). "Landslide for Tories Disappointment for Labour". Gibraltar Chronicle. Archived from the original on 10 June 2009. Retrieved 2009-06-08. ()
- "European Election: Northern Ireland Result". BBC News. 14 June 2004. Retrieved 24 May 2014.
- "Vote further polarises Ulster politics". the Guardian. 15 June 2004. Retrieved 25 May 2014.
- "DUP's worst ever Euro poll result". BBC News. 8 June 2009. Retrieved 25 May 2014.
- The 2004 European Election
- "Democracy Live Brian Simpson MEP". BBC. Retrieved 22 May 2014.
- "MEP profiles - Jacqueline Foster". European Parliament. Retrieved 25 May 2014.
- "Conservative MEPs salute Lord Bethell on his retirement as an MEP & welcome his successor, Ian Twinn". Archived from the original on 19 July 2008. Retrieved 4 July 2010.
- "Leaders meet MPs over EU results". BBC News. Retrieved 22 May 2014.
- "Kilroy-Silk wants UKIP leadership", Daily Telegraph, 3 October 2004
- "Kilroy quits UKIP group of MEPs". BBC News. 27 October 2004.
- "Kilroy resigns Ukip whip". Guardian online. 7 October 2004.
- "Kilroy-Silk quits shameful UKIP". BBC News. 21 January 2005.
- "UKIP on the London Assembly? What Farage and the Politics Show didn't say…". MayorWatch. 23 March 2011.
External links
- European Election News by European Election Law Association (Eurela)
- Guide and results at the UK Office of the European Parliament
- Guide and links Richard Kimber's at Political Science Resources
Manifestos and documents
- Guardian (newspaper): incomplete collection of manifestos
- Conservative manifesto
- European Greens manifesto; Successes of the Greens in the European Parliament; A Green Contract for Europe; European Election Manifesto: Green Party of England and Wales Manifesto: Northern Ireland
- Labour document
- Liberal Democrat manifesto
- Democratic Unionist Party manifesto
- Social Democratic and Labour Party manifesto
- Socialist Environmental Alliance manifesto
- Ulster Unionist Party manifesto European manifesto (ED)
- Scottish National Party manifesto
- Plaid Cymru / The Party of Wales Manifesto
| 1979 | |
|---|---|
| 1984 | |
| 1989 | |
| 1994 | |
| 1999 | |
| 2004 | |
| 2009 | |
| 2014 | |
| 2019 | |
| 2024 |
|
| Off-year | |
| Legislation | |||||
|---|---|---|---|---|---|
| Delegations | |||||
| Elections |
| ||||
| Members | |||||
| Constituencies | |||||
| Voting systems |
| ||||
| Other |
| ||||
| General elections |
|
|---|---|
| Local elections |
|
| European elections | |
| Referendums | |