1837 United Kingdom general election
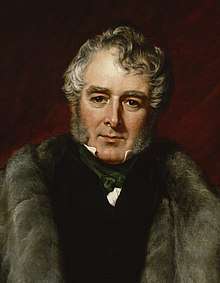
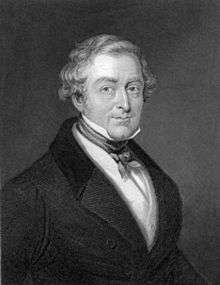
The 1837 United Kingdom general election was triggered by the death of King William IV and produced the first Parliament of the reign of his successor, Queen Victoria. It saw Robert Peel's Conservatives close further on the position of the Whigs, who won their fourth election of the decade.
| ||||||||||||||||||||||||||||||||||
All 658 seats in the House of Commons 330 seats needed for a majority | ||||||||||||||||||||||||||||||||||
|---|---|---|---|---|---|---|---|---|---|---|---|---|---|---|---|---|---|---|---|---|---|---|---|---|---|---|---|---|---|---|---|---|---|---|
| ||||||||||||||||||||||||||||||||||
 Colours denote the winning party | ||||||||||||||||||||||||||||||||||
| ||||||||||||||||||||||||||||||||||
The election marked the last time that a Parliament was dissolved as a result of the demise of the Crown. The dissolution of Parliament six months after a demise of the Crown, as provided for by the Succession to the Crown Act 1707, was abolished by the Reform Act 1867.
|
|
|
|
Results
| UK General Election 1837 | |||||||||||||||
|---|---|---|---|---|---|---|---|---|---|---|---|---|---|---|---|
| Party | Candidates | Votes | |||||||||||||
| Stood | Elected | Gained | Unseated | Net | % of total | % | No. | Net % | |||||||
| Whig | 510 | 344 | −41 | 52.28 | 52.42 | 418,331 | −4.8 | ||||||||
| Conservative | 484 | 314 | +41 | 47.72 | 47.58 | 379,694 | +4.8 | ||||||||
Voting summary
Seats summary
Regional results
Great Britain
| Party | Candidates | Unopposed | Seats | Seats change | Votes | % | % change | |
|---|---|---|---|---|---|---|---|---|
| Conservative | 414 | 102 | 284 | +46 | 353,000 | 48.2 | +5.4 | |
| Whig | 422 | 81 | 271 | −46 | 379,961 | 51.8 | −5.4 | |
| Total | 836 | 183 | 555 | 732,961 | 100 | |||
England
| Party | Candidates | Unopposed | Seats | Seats change | Votes | % | % change | |
|---|---|---|---|---|---|---|---|---|
| Conservative | 348 | 80 | 239 | +39 | 321,124 | 48.9 | +6.3 | |
| Whig | 352 | 60 | 225 | −39 | 347,549 | 51.1 | −6.3 | |
| Total | 658 | 177 | 464 | 491,540 | 100 | |||
Scotland
| Party | Candidates | Unopposed | Seats | Seats change | Votes | % | % change | |
|---|---|---|---|---|---|---|---|---|
| Whig | 49 | 15 | 33 | −5 | 22,082 | 54.0 | −8.8 | |
| Conservative | 35 | 7 | 20 | +5 | 18,569 | 46.0 | +8.8 | |
| Total | 84 | 22 | 53 | 40,651 | 100 | |||
Wales
| Party | Candidates | Unopposed | Seats | Seats change | Votes | % | % change | |
|---|---|---|---|---|---|---|---|---|
| Conservative | 25 | 11 | 19 | +2 | 11,616 | 52.8 | −11.1 | |
| Whig | 20 | 6 | 13 | −2 | 10,144 | 47.2 | +11.1 | |
| Total | 45 | 17 | 32 | 21,760 | 100 | |||
Ireland
| Party | Candidates | Unopposed | Seats | Seats change | Votes | % | % change | |
|---|---|---|---|---|---|---|---|---|
| Whig/Repeal Coalition | 88 | 34 | 73 | +5 | 38,370 | 58.5 | +9.9 | |
| Irish Conservative | 70 | 19 | 30 | −5 | 26,694 | 41.5 | −9.9 | |
| Total | 158 | 53 | 103 | 65,064 | 100 | |||
Universities
| Party | Candidates | Unopposed | Seats | Seats change | Votes | % | % change | |
|---|---|---|---|---|---|---|---|---|
| Conservative | 6 | 4 | 6 | 1,691 | 90.1 | |||
| Whig | 1 | 0 | 0 | 186 | 9.9 | |||
| Total | 6 | 6 | 6 | 1,877 | 100 | |||
References
- Craig, F. W. S. (1989), British Electoral Facts: 1832–1987, Dartmouth: Gower, ISBN 0900178302
- Rallings, Colin; Thrasher, Michael, eds. (2000), British Electoral Facts 1832–1999, Ashgate Publishing Ltd
External links
| General elections |
|
|---|---|
| Local elections |
|
| European elections | |
| Referendums | |
This article is issued from Wikipedia. The text is licensed under Creative Commons - Attribution - Sharealike. Additional terms may apply for the media files.