October 1974 United Kingdom general election
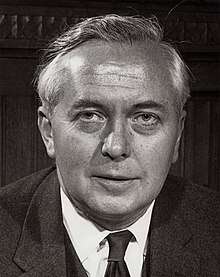
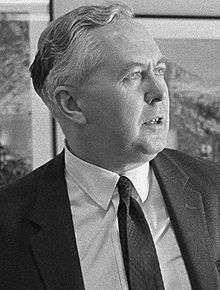
The October 1974 United Kingdom general election took place on Thursday 10 October 1974 to elect 635 members of the British House of Commons. It was the second general election held that year, the first year that two general elections were held in the same year since 1910, and the first time that two general elections were held less than a year apart from each other since the 1923 and 1924 elections, which took place 10 months apart. The election resulted in the Labour Party led by Harold Wilson winning the narrowest majority recorded, 3 seats. This enabled the remainder of the Labour government, 1974–1979 to take place, which saw a gradual loss of its majority.
| |||||||||||||||||||||||||||||||||||||||||||||||||||||||||||||||||||||||
All 635 seats in the House of Commons 318 seats needed for a majority | |||||||||||||||||||||||||||||||||||||||||||||||||||||||||||||||||||||||
|---|---|---|---|---|---|---|---|---|---|---|---|---|---|---|---|---|---|---|---|---|---|---|---|---|---|---|---|---|---|---|---|---|---|---|---|---|---|---|---|---|---|---|---|---|---|---|---|---|---|---|---|---|---|---|---|---|---|---|---|---|---|---|---|---|---|---|---|---|---|---|---|
| Turnout | 72.8%, | ||||||||||||||||||||||||||||||||||||||||||||||||||||||||||||||||||||||
| |||||||||||||||||||||||||||||||||||||||||||||||||||||||||||||||||||||||
 Colours denote the winning party—as shown in § Results | |||||||||||||||||||||||||||||||||||||||||||||||||||||||||||||||||||||||
| |||||||||||||||||||||||||||||||||||||||||||||||||||||||||||||||||||||||
.gif)
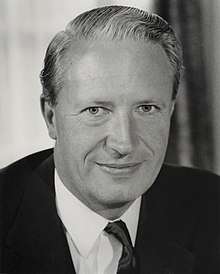
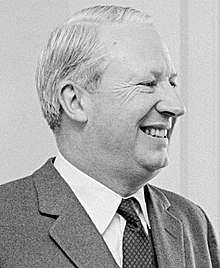
The election of February that year had produced an unexpected hung parliament. Coalition talks between the Conservatives and other parties such as the Liberals and the Ulster Unionists failed, allowing Labour leader Harold Wilson to form a minority government. The October campaign was not as vigorous or exciting as the one in February. Despite continuing high inflation, Labour was able to boast that it had ended the miners' strike, which had dogged Heath's premiership, and had returned some stability. The Conservative Party, still led by Edward Heath, released a manifesto promoting national unity; however, its chances of forming a government were hindered by the Ulster Unionist Party refusing to take the Conservative whip at Westminster, in response to the Sunningdale Agreement of 1973.
The Conservatives and the Liberals each saw their vote share decline, and Conservative Party leader Edward Heath, who had lost three of the four elections he contested, was ousted as party leader in February 1975 and replaced with future Prime Minister Margaret Thatcher. The Scottish National Party won 30% of the Scottish popular vote and 11 of Scotland's 71 seats; it was their most successful general election result until 2015.
Subsequently, Labour's narrow parliamentary majority had disappeared by 1977 through a series of by-election losses and defections. It then required deals with the Liberals, the Ulster Unionists, the Scottish Nationalists and the Welsh Nationalists.
This was the last general election victory for the Labour Party until 1997; each of the next four consecutive general elections produced a Conservative parliamentary majority.
The election was broadcast live on the BBC, and was presented by David Butler, Alastair Burnet, Robert McKenzie, Robin Day and Sue Lawley.[1]
Campaign
The brief period between the elections gave Wilson the opportunity to demonstrate reasonable progress. Despite high inflation and high balance-of-trade deficits, the miners' strike that had dogged Heath was over and some stability had been restored. Following the February election Heath had remained largely out of the public eye.
As was expected, the campaign was not as exciting as the one in February and overall coverage by broadcasters was significantly scaled back. The Conservatives campaigned on a manifesto of national unity, in response to the mood of the public. Labour campaigned on its recent successes in government, and although the party was divided over Europe, their strengths outweighed that of Heath, who knew his future relied on an election victory. Devolution was a key issue for the Liberals and the Scottish National Party, and was now one that the two main parties also felt the need to address. The Liberals did not issue a new manifesto, simply reissuing the one they had created for the last election.[2][3]
Timeline
Prime Minister Harold Wilson made a ministerial broadcast on television on 18 September to announce that the election would be held on 10 October, less than eight months since the previous election. The key dates were as follows:
| Friday 20 September | Dissolution of the 46th Parliament and campaigning officially begins |
| Monday 30 September | Last day to file nomination papers |
| Wednesday 9 October | Campaigning officially ends |
| Thursday 10 October | Polling day |
| Friday 11 October | The Labour Party wins control with a majority of 3 |
| Tuesday 22 October | 47th Parliament assembles |
| Tuesday 29 October | State Opening of Parliament |
Results
Labour achieved a swing of 2% against the Conservatives. This was the first time since 1922 that a government had won an overall majority with less than 40% of the vote, albeit a majority of only 3. The Conservatives won just 36% of the vote, their worst share since 1945; and a slight drop in the Liberal vote saw them suffer a net loss of 1 seat. In Scotland, the SNP added another 4 seats to their successes in the previous election to become the 4th largest party. Turnout was 72.8%, which was a significant decline on the February election's 78.8% turnout.
| 319 | 277 | 13 | 11 | 15 |
| Labour | Conservative | Lib | SNP | O |
| Candidates | Votes | ||||||||||
|---|---|---|---|---|---|---|---|---|---|---|---|
| Party | Leader | Stood | Elected | Gained | Unseated | Net | % of total | % | No. | Net % | |
| Labour | Harold Wilson | 623 | 319 | 19 | 1 | +18 | 50.2 | 39.2 | 11,457,079 | +2.0 | |
| Conservative | Edward Heath | 622 | 277 | 2 | 22 | −20 | 43.6 | 35.8 | 10,462,565 | −2.1 | |
| Liberal | Jeremy Thorpe | 619 | 13 | 1 | 2 | −1 | 2.1 | 18.3 | 5,346,704 | −1.0 | |
| SNP | William Wolfe | 71 | 11 | 4 | 0 | +4 | 1.7 | 2.9 | 839,617 | +0.9 | |
| UUP | Harry West | 7 | 6 | 0 | 1 | −1 | 0.9 | 0.9 | 256,065 | +0.1 | |
| Plaid Cymru | Gwynfor Evans | 36 | 3 | 1 | 0 | +1 | 0.5 | 0.6 | 166,321 | +0.1 | |
| SDLP | Gerry Fitt | 9 | 1 | 0 | 0 | 0 | 0.2 | 0.6 | 154,193 | +0.1 | |
| National Front | John Kingsley Read | 90 | 0 | 0 | 0 | 0 | 0.4 | 113,843 | +0.2 | ||
| Vanguard | William Craig | 3 | 3 | 0 | 0 | 0 | 0.5 | 0.3 | 92,262 | +0.1 | |
| DUP | Ian Paisley | 2 | 1 | 0 | 0 | 0 | 0.2 | 0.3 | 59,451 | +0.1 | |
| Alliance | Oliver Napier | 5 | 0 | 0 | 0 | 0 | 0.2 | 44,644 | +0.1 | ||
| Independent Labour | N/A | 7 | 0 | 0 | 1 | −1 | 0.2 | 33,317 | +0.1 | ||
| Independent Republican | N/A | 1 | 1 | 1 | 0 | +1 | 0.2 | 0.2 | 32,795 | +0.2 | |
| Republican Clubs | Tomás Mac Giolla | 5 | 0 | 0 | 0 | 0 | 0.1 | 21,633 | +0.1 | ||
| Unionist Party NI | Brian Faulkner | 2 | 0 | 0 | 0 | 0 | 0.1 | 20,454 | N/A | ||
| Communist | John Gollan | 29 | 0 | 0 | 0 | 0 | 0.1 | 17,426 | 0.0 | ||
| Democratic Labour | Dick Taverne | 1 | 0 | 0 | 1 | −1 | 0.1 | 13,714 | +0.1 | ||
| NI Labour | Alan Carr | 3 | 0 | 0 | 0 | 0 | 0.0 | 11,539 | 0.0 | ||
| Independent | N/A | 32 | 0 | 0 | 0 | 0 | 0.0 | 8,812 | −0.1 | ||
| Independent Ulster Unionist | N/A | 1 | 0 | 0 | 0 | 0 | 0.0 | 4,982 | N/A | ||
| United Democratic | James Tippett | 13 | 0 | 0 | 0 | 0 | 0.0 | 4,810 | N/A | ||
| Ind. Conservative | N/A | 4 | 0 | 0 | 0 | 0 | 0.0 | 4,559 | 0.0 | ||
| More Prosperous Britain | Tom Keen and Harold Smith | 25 | 0 | 0 | 0 | 0 | 0.0 | 4,301 | 0.0 | ||
| Workers Revolutionary | Gerry Healey | 10 | 0 | 0 | 0 | 0 | 0.0 | 3,404 | 0.0 | ||
| Independent Liberal | N/A | 3 | 0 | 0 | 0 | 0 | 0.0 | 3,277 | −0.2 | ||
| Volunteer Political | Ken Gibson | 1 | 0 | 0 | 0 | 0 | 0.0 | 2,690 | N/A | ||
| Irish Civil Rights | N/A | 7 | 0 | 0 | 0 | 0 | 0.0 | 2,381 | N/A | ||
| PEOPLE | Tony Whittaker | 5 | 0 | 0 | 0 | 0 | 0.0 | 1,996 | 0.0 | ||
| Marxist-Leninist (England) | John Buckle | 8 | 0 | 0 | 0 | 0 | 0.0 | 1,320 | 0.0 | ||
| English National | Frank Hansford-Miller | 2 | 0 | 0 | 0 | 0 | 0.0 | 1,115 | N/A | ||
| United English National | John Kynaston | 1 | 0 | 0 | 0 | 0 | 0.0 | 793 | N/A | ||
| Marxist–Leninist (Ireland) | Carole Reakes | 3 | 0 | 0 | 0 | 0 | 0.0 | 540 | N/A | ||
| Mebyon Kernow | Richard Jenkin | 1 | 0 | 0 | 0 | 0 | 0.0 | 384 | N/A | ||
| Socialist (GB) | N/A | 1 | 0 | 0 | 0 | 0 | 0.0 | 118 | N/A | ||
| Government's new majority | 3 |
| Total votes cast | 29,189,104 |
| Turnout | 72.8% |
Votes summary
Seats summary
Incumbents defeated
Conservative
- Jock Bruce-Gardyne (Angus South)
- Michael Ancram, Earl of Ancram (Berwick and East Lothian)
- Harold Gurden (Birmingham Selly Oak)
- Robert Redmond (Bolton West)
- Martin McLaren (Bristol North West)
- Michael Fidler (Bury and Radcliffe)
- Barry Henderson (East Dunbartonshire)
- James Allason (Hemel Hempstead)
- Tom Iremonger (Ilford North)
- Ernle Money (Ipswich)
- Tom Boardman (Leicester South)
- James d'Avigdor-Goldsmid (Lichfield and Tamworth)
- David Waddington (Nelson and Colne)
- Montague Woodhouse (Oxford)
- Ian MacArthur (Perth and East Perthshire)
- Sir Harmar Nicholls, 1st Baronet (Peterborough)
- Peggy Fenner (Rochester and Chatham)
- Ronald Bray (Rossendale)
- Jock Bruce-Gardyne (South Angus)
- James Hill (Southampton Test)
- Piers Dixon (Truro)
- Robert Lindsay, Lord Balniel (Welwyn and Hatfield), Minister of State for Foreign and Commonwealth Affairs
Liberal
- Paul Tyler (Bodmin)
- Michael Winstanley (Hazel Grove)
- Christopher Mayhew (Woolwich East), former Labour MP contested (Bath) and lost
Ulster Unionist Party
Democratic Labour
- Dick Taverne (Lincoln), former Labour MP
Independent Labour
- Eddie Milne (Blyth), former Labour MP
- Edward Griffiths (Sheffield Brightside), former Labour MP
Labour
- Gwynoro Jones (Carmarthen), previous majority was just three votes
See also
References
- Election 1974 (October) – Part 1 on YouTube, UK General Election 1974 – Results Round-up on YouTube
- 1974 Oct: Wilson makes it four, BBC News, 5 April 2005, retrieved 8 June 2018
- "10 October 1974", BBC Politics 97, retrieved 8 June 2018
Further reading
- Butler, David E.; et al. (1975), The British General Election of October 1974, the standard scholarly study
- Craig, F. W. S. (1989), British Electoral Facts: 1832–1987, Dartmouth: Gower, ISBN 0900178302
External links
Manifestos
- Putting Britain First, October 1974 Conservative Party manifesto
- Britain Will Win With Labour, October 1974 Labour Party manifesto
- Why Britain Needs Liberal Government, October 1974 Liberal Party manifesto
| General elections |
|
|---|---|
| Local elections |
|
| European elections | |
| Referendums | |
| Premierships |
|  |
|---|---|---|
| General elections | ||
| Party elections | ||
| Referendum | ||
| Constituencies | ||
| Resignation Honours | ||
| Family |
| |
| Related articles | ||
| ||
| Premiership |
|  |
|---|---|---|
| General elections | ||
| Party elections | ||
| Constituencies | ||
| Cultural depictions |
| |
| Related articles |
| |