Results of the 1975 United Kingdom European Communities membership referendum
The United Kingdom European Communities membership referendum was a public vote that took place on 5 June 1975, on whether the United Kingdom should remain a member of the European Communities which was principally the European Economic Community (the Common Market) as it was known at the time. At the time the UK had already been a member of the EC for two and a half years since joining back on 1 January 1973 and was the first ever national referendum of its kind to be held in the country.
| United Kingdom European Communities membership referendum | ||||||||||||||||||||||
|---|---|---|---|---|---|---|---|---|---|---|---|---|---|---|---|---|---|---|---|---|---|---|
| The Government has announced the results of the renegotiation of the United Kingdom's terms of membership of the European Community. Do you think the United Kingdom should stay in the European Community (the Common Market)? | ||||||||||||||||||||||
| Location | United Kingdom | |||||||||||||||||||||
| Date | June 5, 1975 | |||||||||||||||||||||
| ||||||||||||||||||||||
| ||||||||||||||||||||||
| Referendum held: 5 June 1975 | ||||||||||||||||||||||
This article lists, by voting area, all the results of the referendum, each ordered into national sections.
Under the provisions of the Referendum Act 1975 there was a total of 68 counting areas across the United Kingdom in which counting took place locally. Once the counting areas had officially declared, their results were then relayed by the returning officers to the Chief counting officer Sir Philip Allen who later declared the final result, In England there was a total of 47 counting areas which were made up of the then county council areas of England along with Greater London and the Isles of Scilly. In Wales there was just 8 counting areas which were also made up by the then county council areas. In Scotland the then 12 administrative regions were used as the counting areas with Northern Ireland acting as a single counting area. This meant that of the counting areas the Isles of Scilly with 1,447 eligible voters had the smallest electorate and was also the smallest geographically and Greater London with 5,250,343 eligible voters had the largest electorate and Highland in northern Scotland was the largest geographically with 127,925 eligible voters.
This made for a highly centralised national count with local authorities (district councils) in England and Wales verifying votes locally after polls closed but counting of all totals were only permitted to be held and declared at county council or Scottish regional council level apart from the Isles of Scilly and was not overseen by any independent public body.
Counting took place on Friday 6 June from 09:00 BST, the day after the poll took place and presented unique challenges as large venues were required as there had been no previous experience of counting on such a large and centralised scale and took almost fourteen hours to complete.
United Kingdom
The national result for the United Kingdom was declared just before 2300 BST on Friday 6 June 1975 by the Chief Counting Officer Sir Phillip Allen at Earls Court Exhibition Centre in London. With a national turnout of 64% the target to secure the majority win for the winning side was 12,951,598 votes. The decision by the electorate was a decisive 'Yes' to continued EC membership which won by a huge majority of 8,908,508 votes (34.5%) over those who had voted 'No' to reject continued membership. The result saw decisive 'Yes' votes from all four countries of the United Kingdom and also saw 'Yes' majority votes from all but two counting areas to continued membership of the European Communities (Common Market) which would later become the European Union.[1] [2]
Voting in the referendum took place across the United Kingdom on Thursday 5 June between 07:00 and 22:00 BST. All counting areas started their counts the following day on Friday 6 June at 09:00 BST, and the final result was announced just before 23:00 BST by the Chief Counting Officer (CCO) Sir Phillip Allen at Earls Court Exhibition Centre in London, after all 68 counting areas had declared their totals. With a national turnout of 64% across the United Kingdom, the target to secure a majority for the winning side was 12,951,598 votes. The result was a decisive "Yes" to continued EC membership, which won by a huge majority of 8,908,508 votes (34.5%) over those who had voted "No" to reject continued membership.
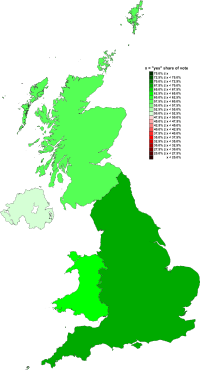
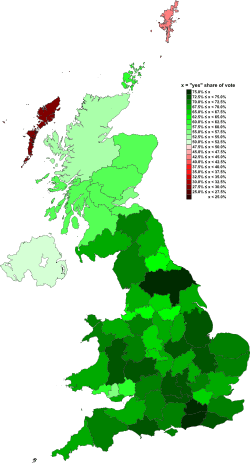
In total, over two-thirds of voters supported continued EC membership. 67.2 percent voted Yes and 32.8 percent voted No. At council level, support for EC membership was positively correlated with support for the Conservative Party and with average income. In contrast, poorer areas that supported Labour gave less support to the question. Approval was well above 60% in almost every council area in England and also in Wales, with the strongly Labour-supporting Mid Glamorgan being the exception. Scotland and Northern Ireland gave less support to the question than the British average. Once the voting areas had declared, their results were then relayed to Sir Philip Allen, the Chief Counting Officer, who later declared the final result.
All the counting areas within the United Kingdom returned large majority votes in favour of "Yes" except for two Scottish regions, the Shetland Islands and the Western Isles, which returned majority votes in favour of a "No" vote.
| Choice | Votes | % |
|---|---|---|
| Yes | 17,378,581 | 67.23 |
| No | 8,470,073 | 32.77 |
| Valid votes | 25,848,654 | 99.78 |
| Invalid or blank votes | 54,540 | 0.22 |
| Total votes | 25,903,194 | 100.00 |
| Registered voters and turnout | 40,086,677 | 64.03 |
| Source: House of Commons Libary[3] | ||
NOTE: Unusually for a referendum Yes was actually the no change (status quo) option.
| Yes: 17,378,581 (67.2%) |
No: 8,470,073 (32.8%) | ||
| ▲ | |||
Results by United Kingdom constituent countries
| Constituent country | Electorate | Turnout (%) | Yes | No | ||
|---|---|---|---|---|---|---|
| Votes | % | Votes | % | |||
| England | 33,356,208 | 64.6% | 14,918,009 | 68.7% | 6,812,052 | 31.3% |
| Wales | 2,011,136 | 66.7% | 869,135 | 64.8% | 472,071 | 35.2% |
| Scotland | 3,688,799 | 61.7% | 1,332,186 | 58.4% | 948,039 | 41.6% |
| Northern Ireland | 1,030,534 | 47.4% | 259,251 | 52.1% | 237,911 | 47.9% |
England
United Kingdom European Communities membership referendum, 1975 England | |||
| Choice | Votes | % | |
|---|---|---|---|
| Yes | 14,918,009 | 68.65% | |
| No | 6,812,052 | 31.35% | |
| Valid votes | 21,730,061 | 99.81% | |
| Invalid or blank votes | 42,161 | 0.19% | |
| Total votes | 21,772,222 | 100.00% | |
| Registered voters and turnout | 33,356,208 | 64.60% | |
| Yes: 14,918,009 (68.6%) |
No: 6,812,052 (31.4%) | ||
| ▲ | |||
England was broken down into 47 counting areas.
| County | Votes | Proportion of votes | Turnout | ||
|---|---|---|---|---|---|
| Yes | No | Yes | No | ||
| Avon | 310,145 | 147,024 | 67.8% | 32.2% | 68.7% |
| Bedfordshire | 154,338 | 67,969 | 69.4% | 30.6% | 67.9% |
| Berkshire | 215,184 | 81,221 | 72.6% | 27.4% | 66.4% |
| Buckinghamshire | 180,512 | 62,578 | 74.3% | 25.7% | 69.5% |
| Cambridgeshire | 177,789 | 62,143 | 74.1% | 25.9% | 62.9% |
| Cheshire | 290,714 | 123,839 | 70.1% | 29.9% | 65.5% |
| Cleveland | 158,982 | 77,079 | 67.3% | 32.7% | 60.2% |
| Cornwall | 137,828 | 63,478 | 68.5% | 31.5% | 66.8% |
| Cumbria | 162,545 | 63,564 | 71.9% | 28.1% | 64.8% |
| Derbyshire | 286,614 | 131,457 | 68.6% | 31.4% | 64.1% |
| Devon | 334,244 | 129,179 | 72.1% | 27.9% | 68.0% |
| Dorset | 217,432 | 78,239 | 73.5% | 26.4% | 68.3% |
| Durham | 175,284 | 97,724 | 64.2% | 35.8% | 61.5% |
| Essex | 463,505 | 222,085 | 67.7% | 32.4% | 67.7% |
| Gloucestershire | 170,931 | 67,465 | 71.7% | 28.3% | 68.4% |
| Greater London | 2,201,031 | 1,100,185 | 66.7% | 33.3% | 60.8% |
| Greater Manchester | 797,316 | 439,191 | 64.5% | 35.5% | 64.1% |
| Hampshire | 484,302 | 197,761 | 71.0% | 29.0% | 68.0% |
| Hereford and Worcester | 203,128 | 75,779 | 72.8% | 27.2% | 66.4% |
| Hertfordshire | 326,943 | 137,226 | 70.4% | 29.6% | 70.2% |
| Humberside | 257,826 | 122,199 | 67.8% | 32.2% | 62.4% |
| Isle of Wight | 40,837 | 17,375 | 71.2% | 29.8% | 67.5% |
| Isles of Scilly | 802 | 275 | 74.5% | 25.5% | 75.0% |
| Kent | 493,407 | 207,358 | 70.4% | 29.6% | 67.4% |
| Lancashire | 455,170 | 208,821 | 68.6% | 31.4% | 67.2% |
| Leicestershire | 291,500 | 106,004 | 73.3% | 26.7% | 66.4% |
| Lincolnshire | 180,603 | 61,011 | 74.7% | 25.3% | 63.7% |
| Merseyside | 465,625 | 252,712 | 64.8% | 35.2% | 62.7% |
| Norfolk | 218,883 | 93,198 | 70.1% | 29.9% | 63.8% |
| Northamptonshire | 162,803 | 71,322 | 69.5% | 30.5% | 65.0% |
| Northumberland | 95,980 | 42,645 | 69.2% | 30.8% | 65.0% |
| Nottinghamshire | 297,191 | 147,461 | 66.8% | 33.2% | 67.7% |
| Oxfordshire | 179,938 | 64,643 | 73.6% | 26.4% | 67.7% |
| Shropshire | 113,044 | 43,329 | 72.3% | 27.7% | 62.0% |
| Somerset | 138,830 | 60,631 | 69.6% | 30.4% | 67.7% |
| Staffordshire | 306,518 | 148,252 | 67.4% | 32.6% | 64.3% |
| Suffolk | 187,484 | 72,251 | 72.2% | 27.8% | 64.9% |
| Surrey | 386,369 | 120,576 | 76.2% | 23.8% | 70.1% |
| East Sussex | 249,780 | 86,198 | 74.3% | 25.7% | 68.6% |
| West Sussex | 242,890 | 73,928 | 76.2% | 23.8% | 68.6% |
| Tyne and Wear | 344,069 | 202,511 | 62.9% | 37.1% | 62.7% |
| Warwickshire | 156,303 | 67,221 | 69.9% | 30.1% | 68.0% |
| West Midlands | 801,913 | 429,207 | 65.1% | 34.9% | 62.5% |
| Wiltshire | 172,791 | 68,113 | 71.7% | 28.3% | 67.8% |
| North Yorkshire | 234,040 | 72,805 | 76.3% | 23.7% | 64.3% |
| South Yorkshire | 377,916 | 217,792 | 63.4% | 36.6% | 62.4% |
| West Yorkshire | 616,730 | 326,993 | 65.4% | 34.6% | 63.6% |
Northern Ireland
Northern Ireland was a single counting area.
| United Kingdom European Communities membership referendum, 1975 Northern Ireland | |||
| Choice | Votes | % | |
|---|---|---|---|
| Yes | 259,251 | 52.19% | |
| No | 237,911 | 47.81% | |
| Valid votes | 497,162 | 99.68% | |
| Invalid or blank votes | 1,589 | 0.32% | |
| Total votes | 498,751 | 100.00% | |
| Registered voters and turnout | 1,030,534 | 47.40% | |
| Yes: 259,251 (52.2%) |
No: 237,911 (47.8%) | ||
| ▲ | |||
Scotland
United Kingdom European Communities membership referendum, 1975 Scotland | |||
| Choice | Votes | % | |
|---|---|---|---|
| Yes | 1,332,208 | 58.42% | |
| No | 948,039 | 41.58% | |
| Valid votes | 2,280,225 | 99.72% | |
| Invalid or blank votes | 6,451 | 0.28% | |
| Total votes | 2,286,676 | 100.00% | |
| Registered voters and turnout | 3,688,799 | 61.70% | |
| Yes: 1,332,186 (58.4%) |
No: 948,039 (42.6%) | ||
| ▲ | |||
Scotland was broken down into 12 counting areas.
| Region | Votes | Proportion of votes | Turnout | ||
|---|---|---|---|---|---|
| Yes | No | Yes | No | ||
| Borders | 34,092 | 13,053 | 72.3% | 27.7% | 63.2% |
| Central | 71,986 | 48,568 | 59.7% | 40.3% | 64.1% |
| Dumfries and Galloway | 42,608 | 19,856 | 68.2% | 31.8% | 61.5% |
| Fife | 84,239 | 65,260 | 56.3% | 43.7% | 63.3% |
| Grampian | 108,520 | 78,071 | 58.2% | 41.8% | 57.4% |
| Highland | 40,802 | 33,979 | 54.6% | 45.4% | 58.7% |
| Lothian | 208,133 | 141,456 | 59.5% | 40.5% | 63.6% |
| Orkney | 3,911 | 2,419 | 61.8% | 38.2% | 48.2% |
| Shetland | 2,815 | 3,631 | 43.7% | 56.3% | 47.1% |
| Strathclyde | 625,939 | 459,073 | 57.7% | 42.3% | 61.7% |
| Tayside | 105,728 | 74,567 | 58.6% | 41.4% | 63.8% |
| Western Isles | 3,393 | 8,106 | 29.5% | 70.5% | 50.1% |
Wales
United Kingdom European Communities membership referendum, 1975 Wales | |||
| Choice | Votes | % | |
|---|---|---|---|
| Yes Ydw |
869,135 | 64.80% | |
| No Nac Ydw |
472,071 | 35.20% | |
| Valid votes | 1,345,545 | 99.68% | |
| Invalid or blank votes | 4,339 | 0.32% | |
| Total votes | 815,628 | 100.00% | |
| Registered voters and turnout | 2,011,136 | 66.90% | |
| Yes: 869,135 (64.8%) |
No: 472,071 (35.2%) | ||
| ▲ | |||
Wales was broken down into 8 counting areas.
| County | Votes | Proportion of votes | Turnout | ||
|---|---|---|---|---|---|
| Yes | No | Yes | No | ||
| Clwyd | 123,980 | 55,424 | 69.1% | 30.9% | 65.8% |
| Dyfed | 109,184 | 52,264 | 67.6% | 32.4% | 67.5% |
| Mid Glamorgan | 147,348 | 111,672 | 56.9% | 43.1% | 66.6% |
| South Glamorgan | 127,932 | 56,224 | 69.5% | 30.5% | 66.7% |
| West Glamorgan | 112,989 | 70,316 | 61.6% | 38.4% | 67.4% |
| Gwent | 132,557 | 80,992 | 62.1% | 37.9% | 68.2% |
| Gwynedd | 76,421 | 31,807 | 70.6% | 29.4% | 64.3% |
| Powys | 38,724 | 13,372 | 74.3% | 25.7% | 67.9% |
See also
References
- Miller, Vaughne (2015-07-13). "Research Briefings - The 1974-75 UK Renegotiation of EEC Membership and Referendum". House of Commons Library. Cite journal requires
|journal=(help) - "Archived copy" (PDF). Archived from the original (PDF) on 2016-08-15. Retrieved 2016-05-19.CS1 maint: archived copy as title (link)
- Miller, Vaughne (2015-07-13). "Research Briefings - The 1974-75 UK Renegotiation of EEC Membership and Referendum". House of Commons Library. Cite journal requires
|journal=(help)
| Metropolitan boroughs |
|
|---|---|
| District councils (England) |
|
| Ad-hoc election | |
| Referendum | |
| General elections |
|
|---|---|
| Local elections |
|
| European elections | |
| Referendums | |