1874 United Kingdom general election
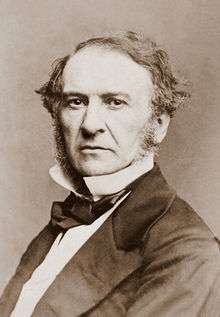
The 1874 United Kingdom general election saw the incumbent Liberals, led by William Ewart Gladstone, lose decisively, even though it won a majority of the votes cast. Benjamin Disraeli's Conservatives won the majority of seats in the House of Commons, largely because they won a number of uncontested seats. It was the first Conservative victory in a general election since 1841. Gladstone's decision to call an election surprised his colleagues, for they were aware of large sectors of discontent in their coalition. For example, the nonconformists were upset with education policies; many working-class people disliked the new trade union laws and the restrictions on drinking. The Conservatives were making gains in the middle-class, Gladstone wanted to abolish the income tax, but failed to carry his own cabinet. The result was a disaster for the Liberals, who went from 387 MPs to only 242. Conservatives jumped from 271 to 350. For the first time the Irish nationalists would be elected. Gladstone himself noted: "We have been swept away in a torrent of gin and beer" (Roberts 2001, p. 332).
| |||||||||||||||||||||||||||||||||||||||||||||
All 652 seats in the House of Commons 327 seats needed for a majority | |||||||||||||||||||||||||||||||||||||||||||||
|---|---|---|---|---|---|---|---|---|---|---|---|---|---|---|---|---|---|---|---|---|---|---|---|---|---|---|---|---|---|---|---|---|---|---|---|---|---|---|---|---|---|---|---|---|---|
| |||||||||||||||||||||||||||||||||||||||||||||
 Colours denote the winning party | |||||||||||||||||||||||||||||||||||||||||||||
| |||||||||||||||||||||||||||||||||||||||||||||
_(14781283621)_(cropped).jpg)
_p4.549_ISAAC_BUTT_M.P..jpg)
The election saw the Irish of the Home Rule League become the first significant third party in Parliament, with 60 of 101 of the seats for Ireland. This had been the first general election that used a secret ballot following the 1872 Secret Ballot Act. The Irish Nationalist gains could well be attributed to the effects of the Secret Ballot Act as tenants faced less of a threat of eviction if they voted against the wishes of their landlords. In this election also, the first two working-class MPs were elected: Alexander MacDonald and Thomas Burt, both members of the Miners' Union, were elected as Liberal-Labour (Lib–Lab) MPs in Stafford and Morpeth, respectively.[1]
This is the only time since the introduction of the secret ballot that a party has been defeated despite receiving an absolute majority of the popular vote. This was primarily because over 100 Conservative candidates were elected unopposed. This meant no votes were cast in those 100 places where the Conservative candidates were anticipated to be popular; in the seats where Liberal candidates did stand, they polled a high proportion of the vote on average.
The election saw 652 MPs elected, 6 fewer than at the previous election. Following allegations of corruption the Conservative-held constituencies of Beverley and Sligo Borough, and the Liberal-held constituencies of Bridgwater and Cashel, had been abolished.
|
Results
| UK General Election 1874 | |||||||||||||||
|---|---|---|---|---|---|---|---|---|---|---|---|---|---|---|---|
| Party | Candidates | Votes | |||||||||||||
| Stood | Elected | Gained | Unseated | Net | % of total | % | No. | Net % | |||||||
| Liberal | 489 | 242 | −139 | 37.12 | 51.95 | 1,281,159 | −9.5 | ||||||||
| Conservative | 507 | 350 | +79 | 53.68 | 44.27 | 1,091,708 | +5.9 | ||||||||
| Home Rule | 80 | 60 | 0 | 0 | +60 | 9.20 | 3.66 | 90,234 | N/A | ||||||
| Others | 4 | 0 | 0 | 0 | 0 | 0 | 0.12 | 2,936 | 0.0 | ||||||
Voting summary
Seats summary
Regional results
Great Britain
| Party | Seats | Seats change | Votes | % | % change | |
|---|---|---|---|---|---|---|
| Conservative | 319 | 1,000,006 | 44.6 | |||
| Liberal | 230 | 1,241,381 | 55.4 | |||
| Lib-Lab | 2 | |||||
| Other | 0 | 2 | 0.0 | |||
| Total | 551 | 2,241,389 | 100 | |||
England
| Party | Seats | Seats change | Votes | % | % change | |
|---|---|---|---|---|---|---|
| Conservative | 280 | 905,239 | 46.2 | |||
| Liberal | 171 | 1,035,268 | 53.8 | |||
| Lib-Lab | 2 | |||||
| Other | 0 | 2 | 0.0 | |||
| Total | 451 | 1,940,509 | 100 | |||
Scotland
| Party | Seats | Seats change | Votes | % | % change | |
|---|---|---|---|---|---|---|
| Liberal | 40 | 148,345 | 68.4 | |||
| Conservative | 18 | 63,193 | 31.6 | |||
| Total | 58 | 211,538 | 100 | |||
Wales
| Party | Seats | Seats change | Votes | % | % change | |
|---|---|---|---|---|---|---|
| Liberal | 19 | 57,768 | 60.9 | |||
| Conservative | 14 | 31,574 | 39.1 | |||
| Total | 33 | 89,342 | 100 | |||
Ireland
| Party | Seats | Seats change | Votes | % | % change | |
|---|---|---|---|---|---|---|
| Home Rule | 60 | 90,234 | 39.6 | |||
| Irish Conservative | 31 | 91,702 | 40.8 | −1.1% | ||
| Liberal | 10 | 39,778 | 18.4 | −39.5% | ||
| Other | 0 | 2,934 | 1.2 | |||
| Total | 101 | 224,648 | 100 | |||
Universities
| Party | Seats | Seats change | Votes | % | % change | |
|---|---|---|---|---|---|---|
| Conservative | 7 | |||||
| Liberal | 2 | |||||
| Total | 9 | 100 | ||||
Notes
- Whitfield, Bob (2001). The Extension of the Franchise, 1832-1931. Heinemann. p. 240. ISBN 9780435327170. Retrieved 12 June 2020.
- "Others" include the Catholic Union.
References
- Craig, F. W. S. (1989), British Electoral Facts: 1832–1987, Dartmouth: Gower, ISBN 0900178302
- Hurst, Michael (1972), "Liberal versus Liberal: The General Election of 1874 in Bradford and Sheffield", Historical Journal, 15 (4): 669–713, doi:10.1017/s0018246x00003502
- Maehl, William Henry (1963), "Gladstone, the Liberals, and the Election of 1874", Historical Research, 36 (93): 53–69, doi:10.1111/j.1468-2281.1963.tb00622.x
- Rallings, Colin; Thrasher, Michael, eds. (2000), British Electoral Facts 1832–1999, Ashgate Publishing Ltd
- Roberts, Martin (2001), Britain: 1846–1964: The Challenge of Change, Oxford University Press
| General elections |
|
|---|---|
| Local elections |
|
| European elections | |
| Referendums | |