1984 European Parliament election in the United Kingdom
The 1984 European Parliament election was the second European election to be held in the United Kingdom. It was held on 14 June. The electoral system was First Past the Post in England, Scotland and Wales and Single Transferable Vote in Northern Ireland. The turnout was again the lowest in Europe. In England, Scotland and Wales, the Liberal Party and Social Democratic Party were in alliance, collecting 2,591,635 votes but not a single seat.
| ||||||||||||||||||||||||||||||||||
81 seats to the European Parliament | ||||||||||||||||||||||||||||||||||
|---|---|---|---|---|---|---|---|---|---|---|---|---|---|---|---|---|---|---|---|---|---|---|---|---|---|---|---|---|---|---|---|---|---|---|
| Turnout | 32.6% ( | |||||||||||||||||||||||||||||||||
| ||||||||||||||||||||||||||||||||||
.svg.png) Colours denote the winning party, as shown in the main table of results. | ||||||||||||||||||||||||||||||||||
| ||||||||||||||||||||||||||||||||||
.jpg)
_Neal_Kinnoch_%2C_k%2C_Bestanddeelnr_932-9811.jpg)
| Part of a series of articles on | ||||||||||
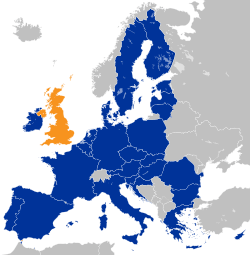
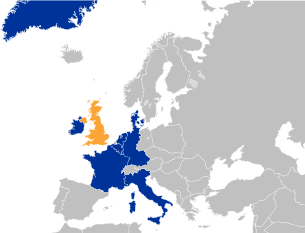
| British membership of the European Union | ||||||||||
|---|---|---|---|---|---|---|---|---|---|---|
 | ||||||||||
|
Treaty amendments
|
||||||||||
|
|
||||||||||
|
Officials and bodies |
||||||||||
|
Issues and events |
||||||||||
|
|
||||||||||
|
| ||||||||||
The election represented a small recovery for Labour, under Michael Foot's replacement Neil Kinnock, taking 15 seats from the Conservatives. In the general election of 1983, they had only had a vote share of 2% more than the SDP–Liberal Alliance (although they had nearly 10 times more MP's elected) and 15% less than the Conservatives.
Results
United Kingdom
Source: UK Parliament briefing
| Party | Votes won | % of vote | Loss/Gain | Seats | % of seats | Loss/Gain | |
|---|---|---|---|---|---|---|---|
| Conservative | 5,426,866 | 38.8 | 45 | 55.6 | |||
| Labour | 4,865,224 | 34.8 | 32 | 39.5 | |||
| Alliance | 2,591,659 | 18.5 | 0 | ||||
| SNP | 230,594 | 1.6 | 1 | 1.2 | |||
| DUP | 230,251 | 1.6 | 1 | 1.2 | |||
| SDLP | 151,399 | 1.1 | 1 | 1.2 | |||
| UUP | 147,169 | 1.1 | 1 | 1.2 | |||
| Plaid Cymru | 103,031 | 0.8 | 0 | ||||
| Sinn Féin | 91,476 | 0.7 | New | 0 | |||
| Ecology | 73,025 | 0.5 | 0 | ||||
| Alliance | 34,046 | 0.2 | 0 | ||||
| UPUP | 20,092 | 0.1 | New | 0 | |||
| Independent | 11,073 | 0.1 | 0 | ||||
| Workers' Party | 8,712 | 0.1 | 0 | ||||
| Independent Ecology | 3,330 | 0.0 | New | 0 | |||
| Ind. Conservative | 3,249 | 0.0 | 0 | ||||
| Ind. Liberal | 2,981 | 0.0 | New | 0 | |||
| Wessex Regionalist | 2,365 | 0.0 | New | 0 | |||
| Cornish Nationalist | 1,892 | 0.0 | New | 0 | |||
| Federal Republican Party | 1,494 | 0.0 | New | 0 | |||
- Overall (England, Scotland, Wales and Northern Ireland) turnout: 32.6% (EC average: 61%)
- Overall votes cast: 13,998,190
Great Britain
Source: UK Parliament briefing
| Party | Votes won | % of vote | Loss/Gain | Seats | % of seats | Loss/Gain | |
|---|---|---|---|---|---|---|---|
| Conservative | 5,426,866 | 40.8 | 45 | 57.7 | |||
| Labour | 4,865,224 | 36.5 | 32 | 41.0 | |||
| Alliance | 2,591,659 | 19.5 | 0 | ||||
| SNP | 230,594 | 1.7 | 1 | 1.3 | |||
| Plaid Cymru | 103,031 | 0.8 | 0 | ||||
| Ecology | 70,853 | 0.5 | 0 | ||||
| Independent | 11,073 | 0.1 | 0 | ||||
| Independent Ecology | 3,330 | 0.0 | New | 0 | |||
| Ind. Conservative | 3,249 | 0.0 | 0 | ||||
| Ind. Liberal | 2,981 | 0.0 | New | 0 | |||
| Wessex Regionalist | 2,365 | 0.0 | New | 0 | |||
| Cornish Nationalist | 1,892 | 0.0 | New | 0 | |||
| Federal Republican Party | 1,494 | 0.0 | New | 0 | |||
Total votes cast - 13,312,898. All parties listed.
Northern Ireland
Source: Northern Ireland Social and Political Archive
| 1984 European Parliament election: Northern Ireland[1] | ||||||||
|---|---|---|---|---|---|---|---|---|
| Party | Candidate | FPv% | Count 1 | Count 2 | Count 3 | Count 4 | ||
| DUP | Ian Paisley | 33.6 | 230,251 | |||||
| UUP | John Taylor | 21.5 | 147,169 | 185,714 | ||||
| SDLP | John Hume | 22.1 | 151,399 | 151,664 | 156,310 | 183,256 | ||
| Sinn Féin | Danny Morrison | 13.3 | 91,476 | 91,525 | 92,644 | 93,079 | ||
| Alliance | David Cook | 5.0 | 34,046 | 34,892 | 37,401 | |||
| UPUP | James Kilfedder | 2.9 | 20,092 | 38,293 | 38,854 | |||
| Workers' Party | Seamus Lynch | 1.3 | 8,712 | 8,813 | ||||
| Ecology | Colin McGuigan | 0.3 | 2,172 | 2,236 | ||||
| Electorate: 1,065,363 Valid: 685,317 Spoilt: 11,654 Quota: 171,330 Turnout: 696,994 | ||||||||
Constituency results
Party leaders in 1984
- Conservative - Margaret Thatcher
- Labour - Neil Kinnock
- Liberal - David Steel
- SDP - David Owen
- SNP - Gordon Wilson
- Plaid Cymru - Dafydd Elis Thomas
- DUP - Ian Paisley
- SDLP - John Hume
- UUP - James Molyneaux
References
- The 1984 European Election, Northern Ireland Elections
See also
- Elections in the United Kingdom: European elections
- Members of the European Parliament for the United Kingdom 1984–1989
| 1979 | |
|---|---|
| 1984 | |
| 1989 | |
| 1994 | |
| 1999 | |
| 2004 | |
| 2009 | |
| 2014 | |
| 2019 | |
| 2024 |
|
| Off-year | |
| Legislation | |||||
|---|---|---|---|---|---|
| Delegations | |||||
| Elections |
| ||||
| Members | |||||
| Constituencies | |||||
| Voting systems |
| ||||
| Other |
| ||||
| General elections |
|
|---|---|
| Local elections |
|
| European elections | |
| Referendums | |