1868 United Kingdom general election
The 1868 United Kingdom general election was the first after passage of the Reform Act 1867, which enfranchised many male householders, thus greatly increasing the number of men who could vote in elections in the United Kingdom. It was the first election held in the United Kingdom in which more than a million votes were cast; nearly triple the number of votes were cast compared to the previous election of 1865.
| ||||||||||||||||||||||||||||||||||
All 658 seats in the House of Commons 327 seats needed for a majority | ||||||||||||||||||||||||||||||||||
|---|---|---|---|---|---|---|---|---|---|---|---|---|---|---|---|---|---|---|---|---|---|---|---|---|---|---|---|---|---|---|---|---|---|---|
| ||||||||||||||||||||||||||||||||||
 Colours denote the winning party | ||||||||||||||||||||||||||||||||||
| ||||||||||||||||||||||||||||||||||
_(14781283621)_(cropped).jpg)
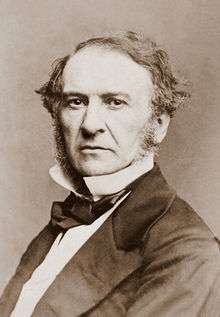
The result saw the Liberals, led by William Ewart Gladstone, again increase their large majority over Benjamin Disraeli's Conservatives to more than 100 seats.
This was the last general election at which all the seats were taken by only the two leading parties, although the parties at the time were loose coalitions and party affiliation was not listed on registration papers.
|
|
Results
.svg.png)
| 387 | 271 |
| Liberal | Conservative |
| UK General Election 1868 | |||||||||||||||
|---|---|---|---|---|---|---|---|---|---|---|---|---|---|---|---|
| Party | Candidates | Votes | |||||||||||||
| Stood | Elected | Gained | Unseated | Net | % of total | % | No. | Net % | |||||||
| Liberal | 600 | 387 | +18 | 58.81 | 61.24 | 1,428,776 | +2.0 | ||||||||
| Conservative | 436 | 271 | −18 | 41.19 | 38.71 | 903,318 | −2.1 | ||||||||
| Others | 3 | 0 | 0 | 0 | 0 | 0 | 0.05 | 1,157 | N/A | ||||||
Voting summary
Seats summary
Regional results
Great Britain
| Party | Candidates | Unopposed | Seats | Seats change | Votes | % | % change | |
|---|---|---|---|---|---|---|---|---|
| Liberal | 515 | 80 | 321 | 1,374,315 | 61.4 | |||
| Conservative | 383 | 65 | 234 | 864,551 | 38.6 | |||
| Other | 1 | 0 | 0 | 969 | 0.0 | |||
| Total | 899 | 145 | 555 | 2,239,835 | 100 | |||
England
| Party | Candidates | Unopposed | Seats | Seats change | Votes | % | % change | |
|---|---|---|---|---|---|---|---|---|
| Liberal | 412 | 46 | 244 | 1,192,098 | 59.7 | |||
| Conservative | 334 | 54 | 211 | 803,637 | 40.2 | |||
| Other | 1 | 0 | 0 | 969 | 0.1 | |||
| Total | 747 | 100 | 455 | 1,996,704 | 100 | |||
Scotland
| Party | Candidates | Unopposed | Seats | Seats change | Votes | % | % change | |
|---|---|---|---|---|---|---|---|---|
| Liberal | 70 | 23 | 51 | 125,356 | 82.5 | |||
| Conservative | 20 | 3 | 7 | 23,985 | 17.5 | |||
| Total | 90 | 26 | 58 | 149,341 | 100 | |||
Wales
| Party | Candidates | Unopposed | Seats | Seats change | Votes | % | % change | |
|---|---|---|---|---|---|---|---|---|
| Liberal | 29 | 10 | 23 | 52,256 | 62.1 | |||
| Conservative | 20 | 4 | 10 | 29,866 | 37.9 | |||
| Total | 49 | 14 | 33 | 82,122 | 100 | |||
Ireland
| Party | Candidates | Unopposed | Seats | Seats change | Votes | % | % change | |
|---|---|---|---|---|---|---|---|---|
| Liberal | 85 | 41 | 66 | 54,461 | 57.9 | +2.3 | ||
| Irish Conservative | 53 | 26 | 37 | 38,765 | 41.9 | −2.5 | ||
| Other | 2 | 0 | 0 | 188 | 0.2 | +0.2 | ||
| Total | 140 | 67 | 103 | 149,341 | 100 | |||
Universities
| Party | Candidates | Unopposed | Seats | Seats change | Votes | % | % change | |
|---|---|---|---|---|---|---|---|---|
| Conservative | 9 | 4 | 6 | 7,063 | 55.4 | |||
| Liberal | 4 | 1 | 3 | 4,605 | 44.6 | |||
| Total | 13 | 5 | 9 | 11,668 | 100 | |||
References
- Craig, F. W. S. (1989), British Electoral Facts: 1832–1987, Dartmouth: Gower, ISBN 0900178302
- Rallings, Colin; Thrasher, Michael, eds. (2000), British Electoral Facts 1832–1999, Ashgate Publishing Ltd
External links
| General elections |
|
|---|---|
| Local elections |
|
| European elections | |
| Referendums | |