1841 United Kingdom general election
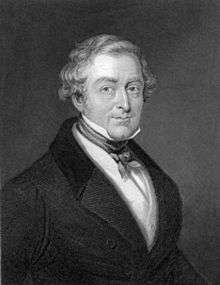
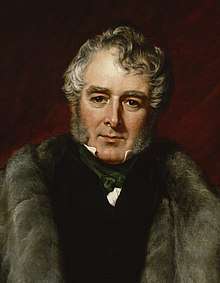
In the 1841 United Kingdom general election, there was a big swing as Sir Robert Peel's Conservatives took control of the House of Commons. Melbourne's Whigs had seen their support in the Commons erode over the previous years. Whilst Melbourne enjoyed the firm support of the young Queen Victoria, his ministry had seen increasing defeats in the Commons, culminating in the defeat of the government's budget in May 1841 by 36 votes, and by 1 vote in a 4 June 1841 vote of no confidence put forward by Peel. The Whigs and Tories were at odds over whether Melbourne's defeat required his resignation, with the Queen being advised by Lord Brougham that calling an election would be without precedent, and that it should only be dissolved to strengthen the government's hands, whereas dissolution facing the Whigs in 1841 was expected to result in their defeat. Melbourne himself opposed dissolution, although his cabinet came to accept it, and Melbourne requested the Queen dissolve Parliament, leading to an election.[1]
| |||||||||||||||||||||||||||||||||||||||||||||
All 658 seats in the House of Commons 330 seats needed for a majority | |||||||||||||||||||||||||||||||||||||||||||||
|---|---|---|---|---|---|---|---|---|---|---|---|---|---|---|---|---|---|---|---|---|---|---|---|---|---|---|---|---|---|---|---|---|---|---|---|---|---|---|---|---|---|---|---|---|---|
| |||||||||||||||||||||||||||||||||||||||||||||
 Colours denote the winning party | |||||||||||||||||||||||||||||||||||||||||||||
 Composition of the Commons after the election | |||||||||||||||||||||||||||||||||||||||||||||
| |||||||||||||||||||||||||||||||||||||||||||||
|
|
|
|
The Conservatives campaigned mainly on the issue of Peel's leadership, whilst the Whigs emphasised an impersonal platform of reforming the import duties on corn, replacing the existing sliding scale with a uniform rate. The Whig position lost them support amongst protectionists, and the Whigs saw heavy losses in constituencies like the West Riding, where aristocratic Whig families who held a strong tradition of unbroken representation in Parliament were rejected by the electorate. Even radical support coalesced around the Tories, with it being felt that Peel would be more open to electoral reform. Radical opinion also appeared to favour the business background of Peel and his supporters to the aristocratic and political background of Melbourne's Whigs, with it being felt that the Whigs made poor governors.[1]
The Whigs also lost votes to the Irish Repeal group. The Chartists picked up only a few votes despite their popular support, because voting was still restricted to a small percentage of the population. Only 3.17% of the total population voted. It is regarded as having been one of the most corrupt elections in British parliamentary history; the Westminster Review stated in 1843 that the "annals of parliamentary warfare contained no page more stained with the foulness of corruption and falsehood than that which relates the history of the general election in the year 1841".[2]
Results
| UK General Election 1841 | |||||||||||||||
|---|---|---|---|---|---|---|---|---|---|---|---|---|---|---|---|
| Party | Candidates | Votes | |||||||||||||
| Stood | Elected | Gained | Unseated | Net | % of total | % | No. | Net % | |||||||
| Conservative | 498 | 367 | +53 | 55.78 | 51.62 | 306,314 | +2.6 | ||||||||
| Whig | 388 | 271 | −73 | 41.19 | 46.15 | 273,902 | −4.8 | ||||||||
| Irish Repeal | 22 | 20 | 20 | 0 | +20 | 3.04 | 2.11 | 12,537 | N/A | ||||||
| Chartist | 8 | 0 | 0 | 0 | 0 | 0 | 0.12 | 692 | N/A | ||||||
Voting summary
Seats summary
Regional results
Great Britain
| Party | Candidates | Unopposed | Seats | Seats change | Votes | % | % change | |
|---|---|---|---|---|---|---|---|---|
| Conservative | 439 | 185 | 326 | +42 | 286,650 | 52.7 | +4.5 | |
| Whig | 333 | 83 | 229 | −42 | 256,774 | 47.2 | −4.6 | |
| Chartist | 8 | 0 | 0 | 692 | 0.1 | |||
| Total | 780 | 268 | 555 | 544,116 | 100 | |||
England
| Party | Candidates | Unopposed | Seats | Seats change | Votes | % | % change | |
|---|---|---|---|---|---|---|---|---|
| Conservative | 374 | 147 | 277 | 272,755 | 53.1 | |||
| Whig | 277 | 62 | 187 | 236,813 | 46.8 | |||
| Chartist | 4 | 0 | 0 | 307 | 0.1 | |||
| Total | 655 | 209 | 464 | 509,875 | 100 | |||
Scotland
| Party | Candidates | Unopposed | Seats | Seats change | Votes | % | % change | |
|---|---|---|---|---|---|---|---|---|
| Whig | 40 | 13 | 31 | 16,356 | 60.8 | |||
| Conservative | 35 | 16 | 22 | 9,793 | 38.3 | |||
| Chartist | 3 | 0 | 0 | 385 | 0.9 | |||
| Total | 78 | 29 | 53 | 26,534 | 100 | |||
Wales
| Party | Candidates | Unopposed | Seats | Seats change | Votes | % | % change | |
|---|---|---|---|---|---|---|---|---|
| Conservative | 24 | 16 | 21 | 4,102 | 53.2 | |||
| Whig | 16 | 8 | 11 | 3,605 | 46.8 | |||
| Chartist | 1 | 0 | 0 | 0 | 0.0 | |||
| Total | 41 | 24 | 32 | 7,707 | 100 | |||
Ireland
| Party | Candidates | Unopposed | Seats | Seats change | Votes | % | % change | |
|---|---|---|---|---|---|---|---|---|
| Whig | 55 | 30 | 42 | 17,128 | 35.1 | |||
| Irish Conservative | 59 | 27 | 41 | 19,664 | 40.1 | |||
| Irish Repeal | 22 | 12 | 20 | 12,537 | 24.8 | |||
| Total | 136 | 69 | 103 | 49,329 | 100 | |||
Universities
| Party | Candidates | Unopposed | Seats | Seats change | Votes | % | % change | |
|---|---|---|---|---|---|---|---|---|
| Conservative | 6 | 6 | 6 | Uncontested | Uncontested | |||
| Total | 6 | 6 | 6 | Uncontested | Uncontested | |||
Whig MPs who lost their seats
References
- Kemp, Betty (June 1952), "The General Election of 1841", History, 37 (130): 146–157, doi:10.1111/j.1468-229X.1952.tb00231.x, JSTOR 24402876
- "Election Compromises", The Westminster Review, 39: 114, 1 January 1843, retrieved 28 November 2018
- British Electoral Facts 1832–2006, compiled and edited by Colin Rallings and Michael Thrasher (Parliamentary Research Services, 2007)
Further reading
- Craig, F. W. S. (1989), British Electoral Facts: 1832–1987, Dartmouth: Gower, ISBN 0900178302
- Gash, Norman (1972), Sir Robert Peel: The life of Sir Robert Peel after 1830, pp. 234–72
- Rallings, Colin; Thrasher, Michael, eds. (2000), British Electoral Facts 1832–1999, Ashgate Publishing Ltd
External links
| General elections |
|
|---|---|
| Local elections |
|
| European elections | |
| Referendums | |