2017 United Kingdom local elections
The 2017 United Kingdom local elections were held on Thursday 4 May 2017. Local elections were held across Great Britain, with elections to 35 English local authorities and all councils in Scotland and Wales.
| |||||||||||||||||||||||||||||||||||||||||||||||||||||||||||||||||||||
34 English councils All 32 Scottish councils All 22 Welsh councils 8 directly elected mayors in England | |||||||||||||||||||||||||||||||||||||||||||||||||||||||||||||||||||||
|---|---|---|---|---|---|---|---|---|---|---|---|---|---|---|---|---|---|---|---|---|---|---|---|---|---|---|---|---|---|---|---|---|---|---|---|---|---|---|---|---|---|---|---|---|---|---|---|---|---|---|---|---|---|---|---|---|---|---|---|---|---|---|---|---|---|---|---|---|---|
| Turnout | 35%[1] | ||||||||||||||||||||||||||||||||||||||||||||||||||||||||||||||||||||
| |||||||||||||||||||||||||||||||||||||||||||||||||||||||||||||||||||||
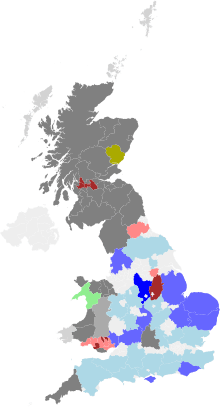
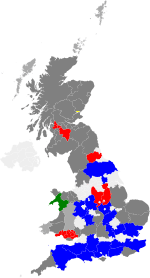
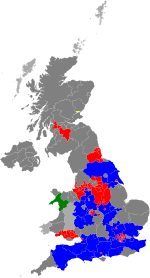
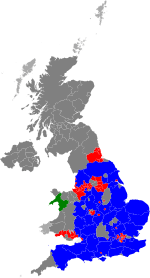
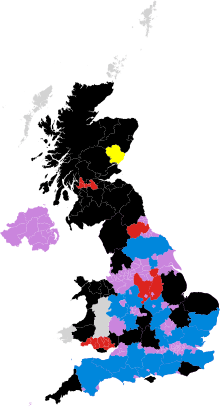
 Map showing council control (left) and largest party by ward or division (right) following the election. Majority of independent councillors No overall control No election on 4 May 2017 | |||||||||||||||||||||||||||||||||||||||||||||||||||||||||||||||||||||
.jpg)
.tif.jpg)
Newly created combined authority mayors were directly elected in six areas of England: Cambridgeshire and Peterborough, Greater Manchester, the Liverpool City Region, Tees Valley, the West Midlands, and the West of England.[3] In addition, Doncaster and North Tyneside re-elected local authority mayors.[3] Local by-elections for 107 council seats also took place on 4 May.[4]
The Conservative Party led under Prime Minister Theresa May enjoyed the best local election performance in a decade, making significant gains at the expense of the Labour Party, this despite the party having been in government for nearly seven years but it would become the only major electoral success during her premiership.[5] The UK Independence Party lost every seat they were defending, but gained just one seat at the expense of the Labour Party.[5] The Liberal Democrats lost 41 seats, despite their vote share increasing.[6][7][8] The Conservatives won four out of six metro-mayoral areas,[9] including in the traditionally Labour-voting Tees Valley and West Midlands.
The local elections were followed by a general election on 8 June.
Eligibility to vote
All registered electors (British, Irish, Commonwealth and European Union citizens) who were aged 18 or over (or aged 16 or over in Scotland)[10] on polling day were entitled to vote in the local elections.[11] A person who had two homes (such as a university student having a term-time address and living at home during holidays) could register to vote at both addresses as long as they were not in the same electoral area, and could vote in the local elections for the two different local councils.[12]
Individuals had to be registered to vote by midnight twelve working days before polling day (13 April 2017 in England and Wales; 17 April 2017 in Scotland).[13][14] Anyone qualifying as an anonymous elector had until midnight on 25 April 2017 to register.[15]
Seats held prior to the election
In total, 4,851 council seats were up for election in 88 councils; additionally six new mayors were directly elected.[16] Approximately 10,000 people were candidates for election.[17] All 32 councils in Scotland (1,227 seats) and all 22 councils in Wales (1,254 seats) were up for election; an additional 34 councils (2,370 seats) in England were up for election.[16] Of the 35 English councils up for election, 27 were county councils, seven were unitary authorities, and one was the Doncaster Metropolitan Borough Council.[18]
According to a BBC News estimate, taking into account boundary changes, the major political parties were effectively defending the following notional results in council seats on election day:
- Labour – 1,535 seats
- Conservatives – 1,336 seats
- Lib Dems – 484 seats
- SNP – 438 seats
- Plaid Cymru – 170 seats
- UKIP – 146 seats
- Green Party – 34 seats
There were also 687 independent councillors and 4 Mebyon Kernow councillors. The remaining 217 seats were held by residents' associations and minor parties.[19] A by-election for the parliamentary constituency of Manchester Gorton (caused by the death of Sir Gerald Kaufman, the sitting MP) was due to be held on the same day as the local election, but the by-election was cancelled after the general election was called for the following month.[17]
Results
Overall results - Great Britain
| Party | Councils[20] | Councillors | |||
|---|---|---|---|---|---|
| Number | Change | Number | Change | ||
| Conservative | 28 | 1,899 | |||
| Labour | 9 | 1,152 | |||
| Independent | 6 | 656 | |||
| Liberal Democrats | 0 | 441 | |||
| SNP | 0 | 431 | |||
| Plaid Cymru | 1 | 208 | |||
| Green | 0 | 21 | |||
| Scottish Green | 0 | 19 | |||
| RA | 0 | 11 | |||
| Llais Gwynedd | 0 | 6 | |||
| Mebyon Kernow | 0 | 4 | |||
| Health Concern | 0 | 2 | |||
| UKIP | 0 | 1 | |||
| Liberal | 0 | 0 | |||
| Others | 0 | 0 | |||
| No overall control | 44 | n/a | n/a | ||
| Total | 4,851 | ||||
As elections were not held throughout the country, the BBC calculated a Projected National Vote Share (PNV), which aims to assess what the council results indicate the UK-wide vote would be "if the results were repeated at a general election". The BBC's preliminary Projected National Vote Share was 38% for the Conservatives, 27% for Labour, 18% for the Liberal Democrats and 5% for UKIP, with others on around 12%.[21]
This is the highest vote share for the Conservatives in local elections since 2008, when they faced Labour a decade into government and suffering from the financial crisis. The Liberal Democrats have performed better than at any election since 2010, whilst Labour has not performed so badly since 2010.
UKIP lost 145 of their 146 seats. Prominent former UKIP members talked of the party being finished and that it should disband.[22][23][24]
Results by nation
England
| Party | Votes[25] | Vote % | +/- | Councils[26] | +/- | Seats | +/- | |
|---|---|---|---|---|---|---|---|---|
| Conservative | 3,036,709 | 46.5% | 27 | 1,439 | ||||
| Labour | 1,299,846 | 19.9% | 2 | 418 | ||||
| Liberal Democrats | 1,164,779 | 17.8% | 0 | 312 | ||||
| UKIP | 302,368 | 4.6% | 0 | 1 | ||||
| Green | 284,735 | 4.4% | 0 | 20 | ||||
| Others | 438,985 | 6.7% | 0 | 199 | ||||
| No overall control | n/a | n/a | n/a | 5 | n/a | n/a | ||
| Total | 6,545,055 | 100 | 34 | 2,389 | ||||
Note that unlike in Scotland and Wales, where all local authorities were up for election, the England results are for only 34 councils out of 353, and should not be taken as reflective of the whole of England.
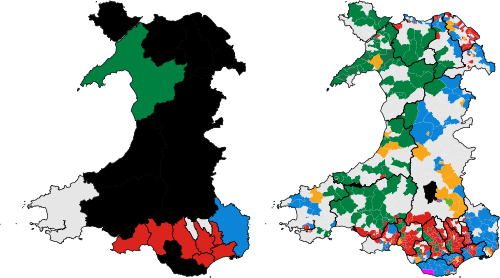
Wales
| Party | Votes[27] | % | +/- | Councils | +/- | Seats | +/- | |
|---|---|---|---|---|---|---|---|---|
| Labour | 294,989 | 30.4% | 7 | 468 | ||||
| Independent | 218,817 | 22.5% | 3 | 309 | ||||
| Conservative | 182,520 | 18.8% | 1 | 184 | ||||
| Plaid Cymru | 160,519 | 16.5% | 1 | 208 | ||||
| Liberal Democrats | 66,022 | 6.8% | 0 | 63 | ||||
| Green | 12,441 | 1.3% | 0 | 1 | ||||
| UKIP | 11,006 | 1.1% | 0 | 0 | ||||
| Other | 24,594 | 2.5% | 0 | 21 | ||||
| No overall control | n/a | n/a | n/a | 10 | n/a | n/a | ||
| Total | 970,908 | 100 | 22 | 1,254 | ||||
For comparative purposes, the table above shows changes since 2012 including Anglesey's council, which was last elected in 2013.
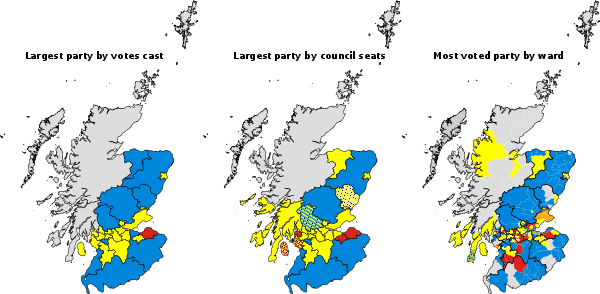
Scotland
Following boundary changes:
Summary of the 4 May 2017 Scottish council election results[28][29]
| Party | First-preference votes | Councils | +/- | 2012 seats | 2017 seats | Seat change | ||||||
|---|---|---|---|---|---|---|---|---|---|---|---|---|
| Seats won | Notional | Seats won | Seat % | vs Notional | ||||||||
| Scottish National Party | 610,454 | 32.3% | 0 | 425 | 438 | 431 | 35.1% | |||||
| Conservative | 478,073 | 25.3% | 0 | 115 | 112 | 276 | 22.5% | |||||
| Labour | 380,957 | 20.2% | 0 | 394 | 395 | 262 | 21.4% | |||||
| Independents | 196,438 | 10.4% | 3 | 196 | 198 | 168 | 14.1% | |||||
| Liberal Democrats | 130,243 | 6.9% | 0 | 71 | 70 | 67 | 5.5% | |||||
| Green | 77,682 | 4.1% | 0 | 14 | 14 | 19 | 1.6% | |||||
| Orkney Manifesto Group | 894 | 0.0% | 0 | 2 | 0.1% | New | ||||||
| West Dunbartonshire Community | 2,413 | 0.1% | 0 | 1 | 0.1% | New | ||||||
| The Rubbish Party | 784 | 0.0% | 0 | 1 | 0.1% | New | ||||||
| UKIP | 2,920 | 0.2% | 0 | 0.0% | ||||||||
| Independent Alliance North Lanarkshire | 2,823 | 0.2% | 0 | 0.0% | ||||||||
| TUSC | 1,403 | 0.1% | 0 | 0.0% | ||||||||
| A Better Britain – Unionist Party | 1,196 | 0.1% | 0 | 0.0% | ||||||||
| Scottish Socialist | 928 | 0.0% | 0 | 1 | 0 | 0.0% | ||||||
| Solidarity | 883 | 0.0% | 0 | 0.0% | ||||||||
| Libertarian | 776 | 0.0% | 0 | 0.0% | ||||||||
| RISE | 186 | 0.0% | 0 | 0.0% | ||||||||
| Scottish Independent Network | 145 | 0.0% | 0 | 0.0% | ||||||||
| Scottish Unionist | 129 | 0.0% | 0 | 0.0% | ||||||||
| Social Democratic | 112 | 0.0% | 0 | 0.0% | ||||||||
| Scottish Christian | 104 | 0.0% | 0 | 0.0% | ||||||||
| Socialist Labour | 76 | 0.0% | 0 | 0.0% | ||||||||
| National Front | 39 | 0.0% | 0 | 0.0% | ||||||||
| No Overall Control | — | — | — | 29 | — | — | — | — | — | |||
| Total | 1,889,658 | 100.0 | ±0.0 | 32 | 1,223 | 1,227 | 1,227 | 100.00 | ||||
The table has been arranged according to popular vote, not the number of seats won.
There were boundary changes in many of these councils, with an increase in council seats across the country from 1,223 to 1,227, making direct comparisons with the 2012 results problematic. Notional seats and seat change are based on a notional 2012 result calculated by the BBC.[30][31]
Maps
| Council control (voting areas only) |
Council control (whole UK) | |||||||||||||||||||||||||||||||||||||||||||||||||||||
|---|---|---|---|---|---|---|---|---|---|---|---|---|---|---|---|---|---|---|---|---|---|---|---|---|---|---|---|---|---|---|---|---|---|---|---|---|---|---|---|---|---|---|---|---|---|---|---|---|---|---|---|---|---|---|
| Before elections | After elections | Before elections | After elections | |||||||||||||||||||||||||||||||||||||||||||||||||||
 |
 |
 |
 | |||||||||||||||||||||||||||||||||||||||||||||||||||
|
No council election on 4 May 2017 | ||||||||||||||||||||||||||||||||||||||||||||||||||||||
| Largest party by popular vote (including mayoral elections) |
| |||||||||||||||||||||||||||||||||||||||||||||||||||||
| and its vote share | and the size of its majority | |||||||||||||||||||||||||||||||||||||||||||||||||||||
 |
 | |||||||||||||||||||||||||||||||||||||||||||||||||||||
No election on 4 May 2017 | ||||||||||||||||||||||||||||||||||||||||||||||||||||||
England
Non-metropolitan county councils
All 27 county councils for areas with a two-tier structure of local governance had all of their seats up for election. These were first-past-the-post elections in a mixture of single-member and multi-member electoral divisions.
These were the last elections to Dorset and Northamptonshire county councils.
- ‡ New electoral division boundaries [39]
- † The Conservatives lost control in 2013, and were replaced by a Labour/UKIP/Lib Dem coalition with Independent/Green support. The Conservatives regained the council leadership in May 2016 after the Green Party abstained in the annual Council leadership election, and by-elections and defections later brought the Conservative total to 42 seats, giving them exactly 50% of the seats.[40]
Unitary authorities
Seven single-tier unitary authorities held elections, with all of their seats up for election. These were first-past-the-post elections in a mixture of single-member and multi-member electoral divisions or wards.
| Council | Council seats up for election |
Previous control | Result | Details | ||
|---|---|---|---|---|---|---|
| Cornwall | All | No overall control[41] (Lib. Dem. and independents coalition) | No overall control (Lib. Dem. and independents coalition)[42][43] | Details | ||
| Durham | All | Labour | Labour | Details | ||
| Isle of Wight | All | No overall control (Cons. plurality) | Conservative | Details | ||
| Isles of Scilly | All | Independent | Independent | Details | ||
| Northumberland | All | No overall control (Lab. plurality) | No overall control (Cons. plurality)[44] | Details | ||
| Shropshire | All | Conservative | Conservative | Details | ||
| Wiltshire | All | Conservative | Conservative | Details | ||
Metropolitan boroughs
One metropolitan borough, the Metropolitan Borough of Doncaster, had all of its seats up for election, after moving to whole council elections in 2015.[45] This was a first-past-the-post election in a mixture of two-member and three-member wards.
| Council | Previous control | Result | Details | ||
|---|---|---|---|---|---|
| Doncaster | Labour | Labour | Details | ||
Mayoral elections

Combined authority mayors
Six elections were held for directly elected regional mayors. These newly established positions lead combined authorities set up by groups of local councils, as part of devolution deals giving the combined authorities additional powers and funding.
| Combined authority | Interim mayor/chair | Result | Details | ||
|---|---|---|---|---|---|
| Cambridgeshire and Peterborough | Robin Howe (Con) | James Palmer (Con) | Details | ||
| Greater Manchester | Tony Lloyd (Lab) | Andy Burnham (Lab) | Details | ||
| Liverpool City Region | Joe Anderson (Lab) | Steve Rotheram (Lab) | Details | ||
| Tees Valley | Sue Jeffrey (Lab) | Ben Houchen (Con) | Details | ||
| West of England | Matthew Riddle (Con) | Tim Bowles (Con) | Details | ||
| West Midlands | Bob Sleigh (Con) | Andy Street (Con) | Details | ||
Other planned mayoralties have been postponed or cancelled.[46] The election of the Sheffield City Region Combined Authority mayor was postponed in January 2017[47] and, following legal action, did not occur until the 2018 local elections.[48] The North East Combined Authority deal was scrapped as several councils in the region voted down the proposal,[49] however the smaller North of Tyne combined authority was approved by the councils and by parliament for the 2019 local elections.[50] The other devolution deals that were scrapped were for the Norfolk and Suffolk,[51] Greater Lincolnshire[52] and the Solent.[53]
Local authority mayors
Two elections for directly elected local district mayors will be held. These Mayors act as council leaders in their local authorities.
| Local Authority | Incumbent mayor | Result | Details | ||
|---|---|---|---|---|---|
| Doncaster | Ros Jones (Lab) | Ros Jones (Lab) | Details | ||
| North Tyneside | Norma Redfearn (Lab) | Norma Redfearn (Lab) | Details | ||
Scotland
Wales
- † In 2014, the only Welsh Liberal Democrat cabinet member defected to Welsh Labour; thus the Liberal Democrats left the coalition.[55] In 2015, several Independent councillors created their own group within the council called Conwy First. This group later on went to support the council instead of the remaining five independent councillors, so that the coalition was then made up of Plaid Cymru, Welsh Labour and Conwy First.[56]
- ‡ The Welsh Liberal Democrats later lost their only seat on the Council, thereby leaving the coalition.[57][58]
- †† At the original election Plaid Cymru won exactly half the seats; they later took control of the council by winning a by-election.
Notes
- Swing figures are between the BBC national projected vote share extrapolation from 2016 United Kingdom local elections, and the BBC equivalent vote share projection from these local elections held in different areas.
References
- Daniel Wainwright (9 April 2019). "Council elections: Why don't people vote?". Retrieved 20 April 2019.
- "Scotland Results". BBC News.
- "Election 2017: English mayoral candidates". BBC News. 5 April 2017. Retrieved 30 April 2017.
- "Local Elections Preview, Part I". election-data.co.uk. 28 April 2017.
- "Tories set for best local election results in decade as UKIP obliterated". The Telegraph. Retrieved 2017-05-05.
- Elgot, Jessica (2017-05-05). "No Lib Dem resurgence at local elections but share of votes increases". The Guardian. ISSN 0261-3077. Retrieved 5 May 2017.
- "The New Statesman 2017 local elections liveblog". www.newstatesman.com. Retrieved 5 May 2017.
- "Local elections 2017: Tories make early gains". 5 May 2017. Retrieved 5 May 2017 – via bbc.co.uk.
- Smith, Mikey (5 May 2017). "Follow all the UK local election results 2017 LIVE". mirror. Retrieved 6 May 2017.
- "Scottish Elections (Reduction of Voting Age) Act 2015, Section 1". Legislation.gov.uk. Retrieved 24 April 2017.
- "Representation of the People Act 1983, Section 2". Legislation.gov.uk. Retrieved 24 April 2017.
- Electoral Commission. "I have two homes. Can I register at both addresses?". electoralcommission.org.uk. The Electoral Commission. Retrieved 24 April 2017.
- "Timetable for local elections in England and Wales: 4 May 2017". The Electoral Commission. Archived from the original (doc) on 24 April 2017. Retrieved 24 April 2017.
- Note that Easter Monday is a working day in Scotland. "Timetable for Scottish council elections on 4 May 2017" (doc). The Electoral Commission. Retrieved 24 April 2017.
- The deadline for the receipt and determination of anonymous electoral registration applications is one working day before the publication date of the notice of alteration to the Electoral Register (that is the sixth working day before polling day). cf "Guidance for Electoral Registration Officers (Part 4 – Maintaining the register throughout the year)" (pdf). Cabinet Office and The Electoral Commission. July 2016. p. 114. Retrieved 24 April 2017.
- Local elections: Voters set to head for the polls, BBC News (3 May 2017).
- Elections 2017: Polls close across England, BBC News (4 May 2017).
- Ashley Cowburn, Local elections 2017: When are they and why could they be so important?,The Independent (3 May 2017).
- "A guide to local elections taking place on Thursday". BBC. 3 May 2017.
- "Local elections 2017: The results mapped". BBC News. Retrieved 6 May 2017.
- "Steve Fisher on Twitter". Retrieved 6 May 2017.
- "Ukip is 'finished as an electoral force' says biggest donor Arron Banks after local election wipeout". telegraph.co.uk. Retrieved 6 May 2017.
- "Ukip got what it wanted. Time to disband". theguardian.com. 5 May 2017. Retrieved 6 May 2017.
- "Ukip, my old party, is finished. And I'm elated about it". The Guardian. 5 May 2017. Retrieved 6 May 2017.
- "English local authorities, 2017". Britain Elects. Retrieved 3 August 2017.
- "England local elections 2017". BBC News. Retrieved 6 May 2017.
- "Year Tables". 19 December 2015.
- "BBC News :: Full Scottish council election results published".
- Board, Electoral Management. "Electoral Management Board - SLGE2017 Summary Results Data". www.electionsscotland.info.
- "Scotland Results". BBC News.
- "How BBC calculates local election results". 9 May 2017 – via www.bbc.com.
- "The Cotswold (Electoral Changes) Order 2017". Retrieved 18 February 2017.
- "Archived copy". Archived from the original on 2017-05-10. Retrieved 2017-06-07.CS1 maint: archived copy as title (link)
- "Conservative-led coalition to run Nottinghamshire CC". www.publicsectorexecutive.com.
- "The Cherwell (Electoral Changes) Order 2017". Retrieved 18 February 2017.
- "Tories form alliance to run Oxfordshire". 16 May 2017 – via www.bbc.co.uk.
- "Find out who will be running Oxfordshire County Council for the next four years". Oxford Mail.
- Sian Grzeszczyk (29 April 2013). "BBC News – Warwickshire elections 2013: Conservatives lose control". Bbc.co.uk. Retrieved 3 May 2013.
- "Trailer – Local Elections May 2017". gwydir.demon.co.uk. Retrieved 18 February 2017.
- Dan Grimmer (9 May 2016). "Conservatives take control of Norfolk County Council as Greens abstain". Eastern Daily Press. Retrieved 9 January 2017.
- "Cornwall Council". Cornwall.gov.uk. Archived from the original on 2013-04-29. Retrieved 2013-05-03.
- "Lib Dems and independents regain council". 23 May 2017 – via www.bbc.co.uk.
- "Liberal Democrats and independents retain control of Cornwall Council". Falmouth Packet.
- "Tories form new administration at Northumberland County Council". Archived from the original on 2018-06-17. Retrieved 2017-06-07.
- "The Borough of Doncaster (Scheme of Elections) Order 2013". legislation.gov.uk. Retrieved 12 August 2016.
- Wichmann, Janine (2017-01-04). "So which English cities are actually getting devolution deals?". CityMetric. Retrieved 2017-01-09.
- "Devolution poll is axed". Sheffield Telegraph. 2017-01-12. Retrieved 2017-01-14.
- "Sheffield's botched 'unlawful' devo consultation likely to cost £500k". Retrieved 18 February 2017.
- Jonathan Walker (2016-09-08). "North East mayor and £900 million devolution deal is scrapped". ChronicleLive. Retrieved 2017-01-14.
- Jonathan Walker (2 November 2019). "'A golden era for the North East': The new North of Tyne Combined Authority is launched". ChronicleLive. Retrieved 5 November 2018.
- "Norfolk and Suffolk elected mayor plans scrapped". BBC News. 2016-11-18. Retrieved 2017-01-14.
- Stefan Pidluznyj (2016-11-11). "Scrapped: Lincolnshire's £450m devolution deal no more". The Lincolnite. Retrieved 2017-01-14.
- William Rimell (12 October 2018). "Hampshire County Council leader Roy Perry 'not surprised' by Solent 'super council' deal snub". Southern Daily Echo. Newsquest. Retrieved 5 November 2018.
- (now), Andrew Sparrow; Phipps, and Claire; (earlier), Kevin Rawlinson (5 May 2017). "Local elections 2017: Tories make gains as votes counted in England, Wales and Scotland – live". Retrieved 5 May 2017 – via The Guardian.
- Staff (4 July 2014). "Conwy: Liberal Democrat councillor Mike Priestley defects to Labour". Daily Post. Retrieved 9 January 2017.
- Staff (10 March 2016). "Conwy council Independents in disarray over attempt to oust Plaid Cymru leader". Daily Post. Retrieved 9 January 2017.
- "Denbighshire Labour councillor defends opposition". Denbighshirefreepress.co.uk. 13 June 2012. Archived from the original on 20 December 2016. Retrieved 9 January 2017.
- "Committee details – Cabinet". Denbighshire County Council. 26 October 2016. Retrieved 9 January 2017.
| General elections |
|
|---|---|
| Local elections |
|
| European elections | |
| Referendums | |