Edwards County, Illinois
Edwards County is a county located in the U.S. state of Illinois. As of the 2010 census, the population was 6,721.[1] Its county seat is Albion.[2] It is located in the southern portion known locally as "Little Egypt".
Edwards County | |
|---|---|
 Edwards County Courthouse in Albion | |
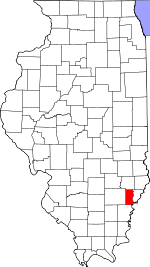 Location within the U.S. state of Illinois | |
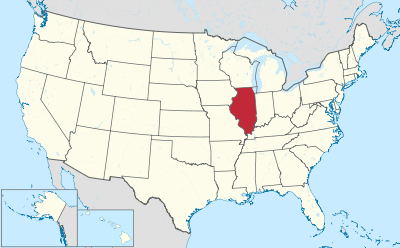 Illinois's location within the U.S. | |
| Coordinates: 38°25′N 88°04′W | |
| Country | |
| State | |
| Founded | 1814 |
| Named for | Ninian Edwards |
| Seat | Albion |
| Largest city | Albion |
| Area | |
| • Total | 223 sq mi (580 km2) |
| • Land | 222 sq mi (570 km2) |
| • Water | 0.3 sq mi (0.8 km2) 0.1% |
| Population (2010) | |
| • Total | 6,721 |
| • Estimate (2018) | 6,392 |
| • Density | 30/sq mi (12/km2) |
| Time zone | UTC−6 (Central) |
| • Summer (DST) | UTC−5 (CDT) |
| Congressional district | 15th |
History
Edwards County was named for Ninian Edwards,[3] the governor of the Illinois Territory, and, later, governor of Illinois.
Edwards County is subdivided into "Road Districts", rather than "Townships" as in most Illinois counties. Pursuant to the Land Ordinance of 1785, the Northwest Territory (including Illinois) was surveyed and mostly organized into townships that are six miles square; but Edwards County was settled prior to that survey, and its pre-existing Road Districts do not generally correspond with the survey's townships.


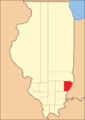 The county between 1819 and 1821. At this point Crawford County was split off from Edwards, and Wayne Counties.
 Edwards between 1821 and 1824
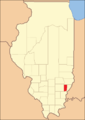 Edwards in 1824, reduced to its current size by the creation of Wabash County
Geography
According to the U.S. Census Bureau, the county has a total area of 223 square miles (580 km2), of which 222 square miles (570 km2) is land and 0.3 square miles (0.78 km2) (0.1%) is water.[4] It is the fourth-smallest county in Illinois by area.
When Edwards County was formed in 1814, it comprised nearly half of the State of Illinois. New counties were formed from it until, in 1824, it assumed its present form from the creation of Wabash County. The two are the fourth and fifth smallest counties in Illinois.
Climate and weather
| Albion, Illinois | ||||||||||||||||||||||||||||||||||||||||||||||||||||||||||||
|---|---|---|---|---|---|---|---|---|---|---|---|---|---|---|---|---|---|---|---|---|---|---|---|---|---|---|---|---|---|---|---|---|---|---|---|---|---|---|---|---|---|---|---|---|---|---|---|---|---|---|---|---|---|---|---|---|---|---|---|---|
| Climate chart (explanation) | ||||||||||||||||||||||||||||||||||||||||||||||||||||||||||||
| ||||||||||||||||||||||||||||||||||||||||||||||||||||||||||||
| ||||||||||||||||||||||||||||||||||||||||||||||||||||||||||||
In recent years, average temperatures in the county seat of Albion have ranged from a low of 21 °F (−6 °C) in January to a high of 89 °F (32 °C) in July, although a record low of −20 °F (−29 °C) was recorded in January 1982 and a record high of 109 °F (43 °C) was recorded in July 1954. Average monthly precipitation ranged from 2.57 inches (65 mm) in January to 5.13 inches (130 mm) in April.[5]
Major highways
Adjacent counties
- Richland County (north)
- Wabash County (east)
- White County (south)
- Wayne County (west)
Demographics
| Historical population | |||
|---|---|---|---|
| Census | Pop. | %± | |
| 1820 | 3,444 | — | |
| 1830 | 1,649 | −52.1% | |
| 1840 | 3,070 | 86.2% | |
| 1850 | 3,524 | 14.8% | |
| 1860 | 5,454 | 54.8% | |
| 1870 | 7,565 | 38.7% | |
| 1880 | 8,597 | 13.6% | |
| 1890 | 9,444 | 9.9% | |
| 1900 | 10,345 | 9.5% | |
| 1910 | 10,049 | −2.9% | |
| 1920 | 9,431 | −6.1% | |
| 1930 | 8,303 | −12.0% | |
| 1940 | 8,974 | 8.1% | |
| 1950 | 9,056 | 0.9% | |
| 1960 | 7,940 | −12.3% | |
| 1970 | 7,090 | −10.7% | |
| 1980 | 7,961 | 12.3% | |
| 1990 | 7,440 | −6.5% | |
| 2000 | 6,971 | −6.3% | |
| 2010 | 6,721 | −3.6% | |
| Est. 2018 | 6,392 | [6] | −4.9% |
| U.S. Decennial Census[7] 1790-1960[8] 1900-1990[9] 1990-2000[10] 2010-2017[1] | |||

As of the 2010 United States Census, there were 6,721 people, 2,840 households, and 1,926 families residing in the county.[11] The population density was 30.2 inhabitants per square mile (11.7/km2). There were 3,187 housing units at an average density of 14.3 per square mile (5.5/km2).[4] The racial makeup of the county was 98.0% white, 0.4% black or African American, 0.3% Asian, 0.1% American Indian, 0.3% from other races, and 0.8% from two or more races. Those of Hispanic or Latino origin made up 0.9% of the population.[11] In terms of ancestry, 26.8% were German, 22.4% were English, 13.3% were American, and 8.4% were Irish.[12]
Of the 2,840 households, 28.9% had children under the age of 18 living with them, 54.8% were married couples living together, 8.3% had a female householder with no husband present, 32.2% were non-families, and 28.5% of all households were made up of individuals. The average household size was 2.35 and the average family size was 2.86. The median age was 42.7 years.[11]
The median income for a household in the county was $40,430 and the median income for a family was $51,337. Males had a median income of $40,183 versus $27,295 for females. The per capita income for the county was $21,113. About 10.6% of families and 12.2% of the population were below the poverty line, including 17.1% of those under age 18 and 12.3% of those age 65 or over.[13]
Communities
Villages
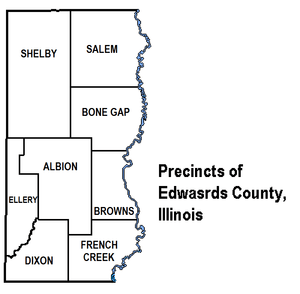
Precincts
- Albion
- Albion No. 1
- Albion No. 2
- Albion No. 3
- Bone Gap
- Browns
- Dixon
- Ellery
- French Creek
- Salem
- Salem No. 1
- Salem No. 2
- Shelby
- Shelby No. 1
- Shelby No. 2
Politics
Edwards County is one of the most consistently Republican counties in the nation. It has voted for the Republican candidate in all Presidential elections from 1856 to present, except in 1912 when the party was divided and Theodore Roosevelt won the county as the “Bull Moose” Progressive candidate.[14] In the last five Presidential elections no Democratic candidate has reached 34 percent of the county's vote.[15] Edwards County also holds the distinction of having the lowest percentage of any Illinois county of votes for governor Pat Quinn, a Democrat, in his failed 2014 reelection bid. Quinn lost 101 of the 102 counties in Illinois, capturing only 13.7% of the vote in Edwards County.[16] Hillary Clinton fared even worse in 2016 with only 13.1 percent of the county's ballots.
| Year | Republican | Democratic | Third parties |
|---|---|---|---|
| 2016 | 83.6% 2,778 | 13.1% 434 | 3.4% 112 |
| 2012 | 74.5% 2,405 | 23.4% 754 | 2.1% 69 |
| 2008 | 63.6% 2,137 | 33.9% 1,140 | 2.5% 85 |
| 2004 | 71.7% 2,412 | 27.7% 930 | 0.7% 22 |
| 2000 | 67.9% 2,212 | 30.0% 978 | 2.2% 70 |
| 1996 | 52.0% 1,613 | 35.1% 1,089 | 12.9% 401 |
| 1992 | 45.1% 1,601 | 36.6% 1,299 | 18.4% 652 |
| 1988 | 64.1% 2,212 | 35.3% 1,218 | 0.6% 20 |
| 1984 | 72.3% 2,778 | 27.5% 1,057 | 0.3% 10 |
| 1980 | 68.1% 2,556 | 27.8% 1,041 | 4.1% 154 |
| 1976 | 58.5% 2,379 | 40.5% 1,648 | 1.0% 39 |
| 1972 | 73.9% 3,017 | 25.9% 1,055 | 0.2% 9 |
| 1968 | 63.7% 2,633 | 26.5% 1,095 | 9.9% 407 |
| 1964 | 53.2% 2,262 | 46.8% 1,991 | |
| 1960 | 69.4% 3,291 | 30.5% 1,446 | 0.2% 8 |
| 1956 | 73.4% 3,339 | 26.6% 1,210 | 0.0% 1 |
| 1952 | 75.0% 3,502 | 24.9% 1,162 | 0.1% 5 |
| 1948 | 66.1% 2,491 | 32.0% 1,206 | 1.9% 73 |
| 1944 | 71.0% 3,016 | 28.2% 1,197 | 0.9% 37 |
| 1940 | 64.9% 3,361 | 34.2% 1,770 | 1.0% 51 |
| 1936 | 55.2% 2,813 | 43.4% 2,211 | 1.5% 76 |
| 1932 | 52.3% 2,203 | 46.4% 1,956 | 1.4% 57 |
| 1928 | 74.8% 2,861 | 24.8% 950 | 0.4% 15 |
| 1924 | 69.6% 2,750 | 26.5% 1,047 | 3.9% 155 |
| 1920 | 79.2% 3,002 | 19.6% 742 | 1.2% 46 |
| 1916 | 65.4% 2,885 | 31.5% 1,389 | 3.1% 138 |
| 1912 | 34.0% 817 | 27.0% 650 | 38.9% 936[lower-alpha 1] |
| 1908 | 64.5% 1,614 | 29.8% 747 | 5.7% 142 |
| 1904 | 67.3% 1,610 | 24.9% 595 | 7.9% 188 |
| 1900 | 64.2% 1,577 | 33.5% 823 | 2.3% 57 |
| 1896 | 64.0% 1,572 | 34.7% 852 | 1.4% 34 |
| 1892 | 62.6% 1,350 | 31.4% 677 | 6.0% 130 |
In other positions the county has been not been consistently Republican for as long, but nevertheless has been so for many years. The last Democratic Senatorial candidate it backed was Alan J. Dixon in 1986[18] and the last Democratic gubernatorial candidate it supported was Glenn Poshard, who carried all of Southern Illinois in his failed 1998 bid.[19] Edwards County lies in Illinois's 15th congressional district, which has Cook Partisan Voting Index of R+21 and has been represented by Republican John Shimkus since 2013. In more local positions the county is in the 109th district of the Illinois House of Representatives so is represented by Republican David Reis and is in the Illinois Senate it lies in the 55th district and is represented by Republican Dale Righter.[20]
Edwards County is a dry county, with multiple referenda to allow alcohol sales failing in the mid-1990s. The portion of Grayville, Illinois that lies within Edwards County does allow alcohol sales per Grayville city ordinance.[21]
Notes
- There were only 818 votes for the leading “other” candidate, Progressive Theodore Roosevelt, plus 100 for the Prohibition Party’s Eugene Chafin, 16 for Socialist Eugene Debs, and 3 for Socialist Labor candidate Arthur Reimer.
References
- United States Census Bureau 2007 TIGER/Line Shapefiles
- United States Board on Geographic Names (GNIS)
- United States National Atlas
- "State & County QuickFacts". United States Census Bureau. Archived from the original on June 6, 2011. Retrieved July 4, 2014.
- "Find a County". National Association of Counties. Archived from the original on July 4, 2012. Retrieved June 7, 2011.
- Gannett, Henry (1905). The Origin of Certain Place Names in the United States. Govt. Print. Off. pp. 115.
- "Population, Housing Units, Area, and Density: 2010 - County". United States Census Bureau. Archived from the original on February 13, 2020. Retrieved July 11, 2015.
- "Monthly Averages for Albion, Illinois". The Weather Channel. Retrieved January 27, 2011.
- "Population and Housing Unit Estimates". Retrieved November 6, 2019.
- "U.S. Decennial Census". United States Census Bureau. Retrieved July 4, 2014.
- "Historical Census Browser". University of Virginia Library. Retrieved July 4, 2014.
- "Population of Counties by Decennial Census: 1900 to 1990". United States Census Bureau. Retrieved July 4, 2014.
- "Census 2000 PHC-T-4. Ranking Tables for Counties: 1990 and 2000" (PDF). United States Census Bureau. Retrieved July 4, 2014.
- "DP-1 Profile of General Population and Housing Characteristics: 2010 Demographic Profile Data". United States Census Bureau. Archived from the original on February 13, 2020. Retrieved July 11, 2015.
- "DP02 SELECTED SOCIAL CHARACTERISTICS IN THE UNITED STATES – 2006-2010 American Community Survey 5-Year Estimates". United States Census Bureau. Archived from the original on February 13, 2020. Retrieved July 11, 2015.
- "DP03 SELECTED ECONOMIC CHARACTERISTICS – 2006-2010 American Community Survey 5-Year Estimates". United States Census Bureau. Archived from the original on February 13, 2020. Retrieved July 11, 2015.
- The Political Graveyard; Edwards County, Illinois
- "President Map - Election Results 2008 - The New York Times". elections.nytimes.com.
- "WJBD - Local News - Quinn Loses Hardest in Edwards County". wjbdradio.com.
- Leip, David. "Dave Leip's Atlas of U.S. Presidential Elections". uselectionatlas.org.
- "David Leip's Election Atlas (Maps for Illinois Senate by election)". uselectionatlas.org.
- "David Leip's Election Atlas (Maps for Illinois Governor by election)". uselectionatlas.org.
- "District Map & General Information - Senator Dale Righter - Dale Righter, Illinois State Senator – 55th District". dalerighter.com. Archived from the original on November 9, 2014. Retrieved November 9, 2014.
- "Illinois Liquor Control Commission Home" (PDF). www.state.il.us.
External links
Places adjacent to Edwards County, Illinois | ||||||||||
|---|---|---|---|---|---|---|---|---|---|---|
| ||||||||||
Municipalities and communities of Edwards County, Illinois, United States | ||
|---|---|---|
| Cities | Map of Illinois highlighting Edwards County | |
| Villages | ||
| Precincts |
| |
| Unincorporated communities | ||
| Ghost towns | ||
| Footnotes | ‡This populated place also has portions in an adjacent county or counties | |
| Counties | 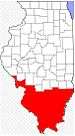 | |
|---|---|---|
| Mid-sized cities (25,000+) | ||
| Small Cities (10,000-25,000) | ||
| Small Cities (5,000-10,000) | ||
| Interstates | ||
| Airports/Military bases |
| |
| Universities | ||
| Colleges | ||
| Sports teams based in the Southern Illinois | ||
| Authority control |
|
|---|