Bond County, Illinois
Bond County is a county located in the U.S. state of Illinois. As of the 2010 census, the population was 17,768.[1] Its county seat is Greenville.[2]
Bond County | |
|---|---|
 Bond County Courthouse in Greenville | |
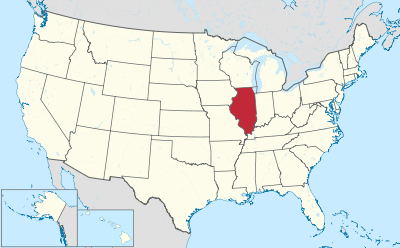
 Location within the U.S. state of Illinois | |
 Illinois's location within the U.S. | |
| Coordinates: 38°53′N 89°26′W | |
| Country | |
| State | |
| Founded | 1817 |
| Named for | Shadrach Bond |
| Seat | Greenville |
| Largest city | Greenville |
| Area | |
| • Total | 383 sq mi (990 km2) |
| • Land | 380 sq mi (1,000 km2) |
| • Water | 2.5 sq mi (6 km2) 0.6% |
| Population (2010) | |
| • Total | 17,768 |
| • Estimate (2018) | 16,630 |
| • Density | 46/sq mi (18/km2) |
| Time zone | UTC−6 (Central) |
| • Summer (DST) | UTC−5 (CDT) |
| Congressional districts | 13th, 15th |
| Website | https://www.bondcountyil.com/ |
Bond County is included in the St. Louis, MO-IL Metropolitan Statistical Area.
History
Bond County was formed in 1817 out of Madison County. It was named for Shadrach Bond, who was then the delegate from the Illinois Territory to the United States Congress, and who thereupon became the first governor of Illinois, serving from 1818 to 1822.[3]
The county's primary city, Greenville, had a post office from 1819 and was incorporated as a town in 1855 and as a city in 1872.[3] A few possible reasons have been put forth for the naming of the town. Some think the town was named after Greenville, North Carolina, which had been named after Revolutionary War general Nathanael Greene. Others say that Greenville was named by early settler Thomas White because it was "so green and nice." A third possibility is that Greenville was named after Green P. Rice, the town's first merchant.[3]
In 1824, a vote taken on slavery in Bond County had received 240 votes against and 63 votes for slavery.[4] While Illinois was not a slave state, it was adjacent to slave states, Missouri and Kentucky, and did allow the continued use of "indentured servants," a process many slaveowners used to keep their slaves even in a free state.[4]
In Bond County, at one point 14 slaves were registered to eight owners.[4] One slave, Silas Register, took his last name from the act of being registered at the county clerk's office. Register was the last known Bond County slave to survive; he died in 1872 at the age of 76.[4] A few of the slaves are buried in the county with the families they were indentured to.[4] One former slave, Fanny, was free after her owners moved out of the state and worked in the town so that she could buy her husband, Stephen, at auction in Missouri.[4]
During the 1840s, Bond County played host to a few people conducting slaves to freedom on the Underground Railroad.[4] Teacher T.A. Jones lived in Reno and in 2008, a letter in which he told of his Underground Railroad activities was discovered in a staircase in Sparta.[4] Slaves were often spirited from Missouri, sometimes through Carlyle to Bond County.[4] Rev. John Leeper was able to disguise his Underground Railroad activities due to his milling business.[4] Dr. Henry Perrine practiced medicine near Greenville and helped with the secret railroad activities.[4] Rev. George Denny's house was found in the 1930s to conceal a secret chamber that had been used in the Railroad.[4]
Greenville University was founded as Almira College in 1855. In 1941, college president H.J. Long "declared the founding of Almira and Greenville ran parallel, for both were founded on prayer."[3]
When Abraham Lincoln and Stephen Douglas gave speeches in Greenville in 1858 during a campaign for the United States Senate, Douglas said: "Ladies and gentlemen it gives me great and supreme gratification and pleasure to see this vast concourse of people assembled to hear me upon this my first visit to Old Bond."[3] The Illinois State Register reported of the occasion: "I've seen many gatherings in Old Bond county but I never saw anything equal to this and I never expect to."[3]
On November 21, 1915, the Liberty Bell passed through Greenville on its nationwide tour returning to Pennsylvania from the Panama-Pacific International Exposition in San Francisco. After that trip, the Liberty Bell returned to Pennsylvania and will not be moved again.[3][5]
The Greenville Public Library was established as a Carnegie library and is on the National Register of Historic Places. Hogue Hall at Greenville College also appears on the National Register.[3]
On April 18, 1934, during the Great Depression, a group of 500 protesters marched to the Illinois Emergency Relief Commission to lodge complaints about the delivery of emergency supplies from the state and federal governments.[3]
Ronald Reagan visited Greenville on the campaign trail in the 1980s and gave a speech on the courthouse lawn. Barack Obama, the junior Senator from Illinois elected as President in November 2008, also visited Greenville while campaigning for his Senate seat in 2004, in a visit hosted by the Bond County Democrats.[6] Women in Bond County could vote for the first time in 1914.[3]
 Bond County at the time of its creation in 1817, extending north to Lake Superior.
 Bond County between 1821 and 1824
 Bond between 1824 and 1843
 Bond county was enlarged slightly to its current size in 1843.
Geography
According to the U.S. Census Bureau, the county has a total area of 383 square miles (990 km2), of which 380 square miles (980 km2) is land and 2.5 square miles (6.5 km2) (0.6%) is water.[7]
Adjacent counties
- Montgomery County – north
- Fayette County – east
- Clinton County – south
- Madison County – west
Major highways


Climate and weather
| Greenville, Illinois | ||||||||||||||||||||||||||||||||||||||||||||||||||||||||||||
|---|---|---|---|---|---|---|---|---|---|---|---|---|---|---|---|---|---|---|---|---|---|---|---|---|---|---|---|---|---|---|---|---|---|---|---|---|---|---|---|---|---|---|---|---|---|---|---|---|---|---|---|---|---|---|---|---|---|---|---|---|
| Climate chart (explanation) | ||||||||||||||||||||||||||||||||||||||||||||||||||||||||||||
| ||||||||||||||||||||||||||||||||||||||||||||||||||||||||||||
| ||||||||||||||||||||||||||||||||||||||||||||||||||||||||||||
In recent years, average temperatures in the county seat of Greenville have ranged from a low of 21 °F (−6 °C) in January to a high of 91 °F (33 °C) in July, although a record low of −22 °F (−30 °C) was recorded in February 1905 and a record high of 114 °F (46 °C) was recorded in July 1954. Average monthly precipitation ranged from 2.00 inches (51 mm) in February to 4.31 inches (109 mm) in May.[8]
Demographics

| Historical population | |||
|---|---|---|---|
| Census | Pop. | %± | |
| 1820 | 2,931 | — | |
| 1830 | 3,124 | 6.6% | |
| 1840 | 5,060 | 62.0% | |
| 1850 | 6,144 | 21.4% | |
| 1860 | 9,815 | 59.7% | |
| 1870 | 13,152 | 34.0% | |
| 1880 | 14,866 | 13.0% | |
| 1890 | 14,550 | −2.1% | |
| 1900 | 16,078 | 10.5% | |
| 1910 | 17,075 | 6.2% | |
| 1920 | 16,045 | −6.0% | |
| 1930 | 14,406 | −10.2% | |
| 1940 | 14,540 | 0.9% | |
| 1950 | 14,157 | −2.6% | |
| 1960 | 14,060 | −0.7% | |
| 1970 | 14,012 | −0.3% | |
| 1980 | 16,224 | 15.8% | |
| 1990 | 14,991 | −7.6% | |
| 2000 | 17,633 | 17.6% | |
| 2010 | 17,768 | 0.8% | |
| Est. 2018 | 16,630 | [9] | −6.4% |
| U.S. Decennial Census[10] 1790-1960[11] 1900-1990[12] 1990-2000[13] 2010-2013[1] | |||
As of the 2010 United States Census, there were 17,768 people, 6,427 households, and 4,340 families residing in the county.[14] The population density was 46.7 inhabitants per square mile (18.0/km2). There were 7,089 housing units at an average density of 18.6 per square mile (7.2/km2).[7] The racial makeup of the county was 90.9% white, 6.1% black or African American, 0.5% American Indian, 0.4% Asian, 0.3% from other races, and 1.8% from two or more races. Those of Hispanic or Latino origin made up 3.1% of the population.[14] In terms of ancestry, 26.6% were German, 12.2% were English, 10.1% were Irish, and 8.4% were American.[15]
Of the 6,427 households, 30.4% had children under the age of 18 living with them, 53.6% were married couples living together, 9.1% had a female householder with no husband present, 32.5% were non-families, and 26.8% of all households were made up of individuals. The average household size was 2.44 and the average family size was 2.93. The median age was 39.7 years.[14]
The median income for a household in the county was $51,946 and the median income for a family was $60,786. Males had a median income of $44,458 versus $31,220 for females. The per capita income for the county was $24,341. About 7.4% of families and 10.8% of the population were below the poverty line, including 10.6% of those under age 18 and 9.1% of those age 65 or over.[16]
Education
- Bond County Community Unit School District 2
- Carlyle Community Unit School District 1
- Highland Community Unit School District 5
- Hillsboro Community Unit School District 3
- Mulberry Grove Community Unit School District 1
- Vandalia Community Unit School District 203
- Greenville University
Politics
Bond is a strongly Republican county. Only two Democrats have gained an absolute majority of the county's vote since at least 1880 – Franklin D. Roosevelt in 1932 and Lyndon Johnson in 1964.
| Year | Republican | Democratic | Third parties |
|---|---|---|---|
| 2016 | 64.6% 4,888 | 27.3% 2,068 | 8.1% 614 |
| 2012 | 55.5% 4,095 | 41.0% 3,020 | 3.5% 260 |
| 2008 | 49.6% 3,947 | 48.3% 3,843 | 2.1% 170 |
| 2004 | 55.2% 4,068 | 43.8% 3,228 | 1.0% 73 |
| 2000 | 54.1% 3,804 | 43.5% 3,060 | 2.4% 168 |
| 1996 | 43.3% 3,018 | 46.1% 3,213 | 10.6% 739 |
| 1992 | 36.0% 2,715 | 45.4% 3,428 | 18.6% 1,405 |
| 1988 | 50.8% 3,608 | 48.7% 3,459 | 0.5% 38 |
| 1984 | 59.5% 4,240 | 40.3% 2,870 | 0.3% 21 |
| 1980 | 58.4% 4,398 | 37.6% 2,834 | 4.0% 300 |
| 1976 | 49.7% 3,716 | 49.2% 3,682 | 1.1% 80 |
| 1972 | 62.3% 4,475 | 37.6% 2,704 | 0.1% 4 |
| 1968 | 52.8% 3,674 | 36.2% 2,516 | 11.0% 763 |
| 1964 | 44.5% 3,058 | 55.5% 3,815 | |
| 1960 | 60.0% 4,297 | 39.9% 2,856 | 0.1% 9 |
| 1956 | 60.4% 4,342 | 39.4% 2,834 | 0.2% 11 |
| 1952 | 62.0% 4,565 | 37.7% 2,776 | 0.2% 18 |
| 1948 | 53.0% 3,438 | 43.8% 2,837 | 3.2% 208 |
| 1944 | 58.2% 3,907 | 38.9% 2,607 | 2.9% 194 |
| 1940 | 57.4% 4,754 | 40.8% 3,376 | 1.9% 155 |
| 1936 | 51.6% 4,046 | 45.2% 3,541 | 3.2% 249 |
| 1932 | 45.6% 3,171 | 52.2% 3,630 | 2.3% 157 |
| 1928 | 64.1% 4,160 | 35.4% 2,298 | 0.6% 36 |
| 1924 | 56.9% 3,644 | 33.5% 2,143 | 9.7% 620 |
| 1920 | 64.7% 3,662 | 27.1% 1,533 | 8.3% 468 |
| 1916 | 54.0% 3,626 | 39.5% 2,652 | 6.5% 436 |
| 1912 | 33.6% 1,152 | 37.2% 1,278 | 29.2% 1,003 |
| 1908 | 53.7% 2,143 | 36.7% 1,465 | 9.6% 384 |
| 1904 | 55.9% 2,055 | 32.9% 1,210 | 11.3% 414 |
| 1900 | 53.9% 2,101 | 41.8% 1,629 | 4.3% 168 |
| 1896 | 53.0% 1,967 | 44.8% 1,664 | 2.2% 83 |
| 1892 | 50.3% 1,659 | 40.2% 1,328 | 9.5% 314 |
See also
- National Register of Historic Places listings in Bond County, Illinois
References
- "State & County QuickFacts". United States Census Bureau. Retrieved July 3, 2014.
- "Find a County". National Association of Counties. Archived from the original on May 31, 2011. Retrieved June 7, 2011.
- Allan H. Keith, Historical Stories: About Greenville and Bond County, IL. Consulted on August 15, 2007.
- "Several Stops On 'Underground Railroad' In Bond County". Greenville Advocate. November 11, 2008.
- "Liberty Bell Attracts Crowd in Greenville During 1915 Stop". Greenville Advocate. July 3, 2007.
- "Obama Visited Cafe in 2004". Greenville Advocate. November 11, 2008.
- "Population, Housing Units, Area, and Density: 2010 - County". United States Census Bureau. Archived from the original on February 12, 2020. Retrieved July 11, 2015.
- "Monthly Averages for Greenville, Illinois". The Weather Channel. Retrieved January 27, 2011.
- "Population and Housing Unit Estimates". Retrieved November 7, 2019.
- "U.S. Decennial Census". United States Census Bureau. Retrieved July 3, 2014.
- "Historical Census Browser". University of Virginia Library. Retrieved July 3, 2014.
- "Population of Counties by Decennial Census: 1900 to 1990". United States Census Bureau. Retrieved July 3, 2014.
- "Census 2000 PHC-T-4. Ranking Tables for Counties: 1990 and 2000" (PDF). United States Census Bureau. Retrieved July 3, 2014.
- "DP-1 Profile of General Population and Housing Characteristics: 2010 Demographic Profile Data". United States Census Bureau. Archived from the original on February 13, 2020. Retrieved July 11, 2015.
- "DP02 SELECTED SOCIAL CHARACTERISTICS IN THE UNITED STATES – 2006-2010 American Community Survey 5-Year Estimates". United States Census Bureau. Archived from the original on February 13, 2020. Retrieved July 11, 2015.
- "DP03 SELECTED ECONOMIC CHARACTERISTICS – 2006-2010 American Community Survey 5-Year Estimates". United States Census Bureau. Archived from the original on February 13, 2020. Retrieved July 11, 2015.
- Leip, David. "Dave Leip's Atlas of U.S. Presidential Elections". uselectionatlas.org. Retrieved October 29, 2018.
External links
- County Website
- United States Census Bureau 2007 TIGER/Line Shapefiles
- United States Board on Geographic Names (GNIS)
- United States National Atlas
Places adjacent to Bond County, Illinois | ||||||||||
|---|---|---|---|---|---|---|---|---|---|---|
| ||||||||||
Municipalities and communities of Bond County, Illinois, United States | ||
|---|---|---|
| City | Map of Illinois highlighting Bond County | |
| Villages | ||
| Townships | ||
| Unincorporated communities | ||
| Ghost town | ||
| Footnotes | ‡This populated place also has portions in an adjacent county or counties | |
| Counties |  | |
|---|---|---|
| Major Cities (25,000+) | ||
| Cities (5,000-25,000) | ||
| Communities (1,000-5,000) |
| |
| Interstates | ||
| Airports | ||
| Colleges | ||
| Sports teams |
| |
| Authority control |
|
|---|