McLean County, Illinois
McLean County is the largest county by land area in the U.S. state of Illinois. According to the 2010 census, it had a population of 169,572.[1] Its county seat is Bloomington.[2]
McLean County | |
|---|---|
.jpg) | |
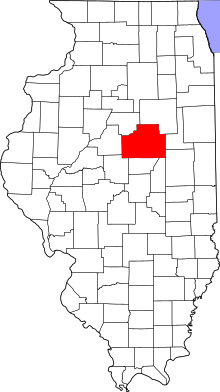 Location within the U.S. state of Illinois | |
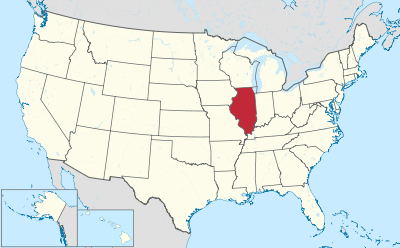 Illinois's location within the U.S. | |
| Coordinates: 40°29′N 88°51′W | |
| Country | |
| State | |
| Founded | December 25, 1830 |
| Named for | John McLean |
| Seat | Bloomington |
| Largest city | Bloomington |
| Area | |
| • Total | 1,186 sq mi (3,070 km2) |
| • Land | 1,183 sq mi (3,060 km2) |
| • Water | 2.9 sq mi (8 km2) 0.2% |
| Population (2010) | |
| • Total | 169,572 |
| • Estimate (2019) | 171,517 |
| • Density | 140/sq mi (55/km2) |
| Time zone | UTC−6 (Central) |
| • Summer (DST) | UTC−5 (CDT) |
| Congressional districts | 13th, 18th |
| Website | www |
McLean County is included in the Bloomington–Normal, IL Metropolitan Statistical Area.
Pronunciation
Locally, the second syllable of McLean is pronounced with a 'long a' (ā, IPA /ei/) sound (i.e. "muh-KLAIN") (as with native son McLean Stevenson), not with a 'long e' (ē, IPA /i/) sound ("muh-KLEEN").
History
McLean County was formed late in 1830 out of Tazewell County. It was named for John McLean, United States Senator for Illinois, who died in 1830.[3]
 McLean County from the time of its creation to 1837
 McLean County between 1837 and 1841
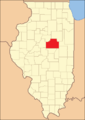 McLean County in 1841, reduced to its present borders
Geography
According to the U.S. Census Bureau, the county has a total area of 1,186 square miles (3,070 km2), of which 1,183 square miles (3,060 km2) is land and 2.9 square miles (7.5 km2) (0.2%) is water.[4] It is the largest county in Illinois by land area and third-largest by total area. McLean County is actually larger than the land area of Rhode Island (1045 sq mi).
Climate and weather
| Bloomington, Illinois | ||||||||||||||||||||||||||||||||||||||||||||||||||||||||||||
|---|---|---|---|---|---|---|---|---|---|---|---|---|---|---|---|---|---|---|---|---|---|---|---|---|---|---|---|---|---|---|---|---|---|---|---|---|---|---|---|---|---|---|---|---|---|---|---|---|---|---|---|---|---|---|---|---|---|---|---|---|
| Climate chart (explanation) | ||||||||||||||||||||||||||||||||||||||||||||||||||||||||||||
| ||||||||||||||||||||||||||||||||||||||||||||||||||||||||||||
| ||||||||||||||||||||||||||||||||||||||||||||||||||||||||||||
In recent years, average temperatures in the county seat of Bloomington have ranged from a low of 14 °F (−10 °C) in January to a high of 86 °F (30 °C) in July, although a record low of −23 °F (−31 °C) was recorded in January 1985 and a record high of 103 °F (39 °C) was recorded in June 1988. Average monthly precipitation ranged from 1.71 inches (43 mm) in February to 4.52 inches (115 mm) in May.[5]
Adjacent counties
- Woodford County - northwest
- Livingston County - northeast
- Ford County - east
- Champaign County - southeast
- Piatt County - south
- DeWitt County - south
- Logan County - southwest
- Tazewell County - west
Major highways


Demographics
| Historical population | |||
|---|---|---|---|
| Census | Pop. | %± | |
| 1840 | 6,565 | — | |
| 1850 | 10,163 | 54.8% | |
| 1860 | 28,772 | 183.1% | |
| 1870 | 53,988 | 87.6% | |
| 1880 | 60,100 | 11.3% | |
| 1890 | 63,036 | 4.9% | |
| 1900 | 67,843 | 7.6% | |
| 1910 | 68,008 | 0.2% | |
| 1920 | 70,107 | 3.1% | |
| 1930 | 73,117 | 4.3% | |
| 1940 | 73,930 | 1.1% | |
| 1950 | 76,577 | 3.6% | |
| 1960 | 83,877 | 9.5% | |
| 1970 | 104,389 | 24.5% | |
| 1980 | 119,149 | 14.1% | |
| 1990 | 129,180 | 8.4% | |
| 2000 | 150,433 | 16.5% | |
| 2010 | 169,572 | 12.7% | |
| Est. 2019 | 171,517 | [6] | 1.1% |
| U.S. Decennial Census[7] 1790-1960[8] 1900-1990[9] 1990-2000[10] 2010-2019[1] | |||
As of the 2010 United States Census, there were 169,572 people, 65,104 households, and 40,124 families residing in the county.[11] The population density was 143.3 inhabitants per square mile (55.3/km2). There were 69,656 housing units at an average density of 58.9 per square mile (22.7/km2).[4] The racial makeup of the county was 84.3% white, 7.3% black or African American, 4.3% Asian, 0.2% American Indian, 1.5% from other races, and 2.3% from two or more races. Those of Hispanic or Latino origin made up 4.4% of the population.[11] In terms of ancestry, 31.2% were German, 15.4% were Irish, 11.4% were American, and 11.0% were English.[12]
Of the 65,104 households, 31.4% had children under the age of 18 living with them, 48.5% were married couples living together, 9.6% had a female householder with no husband present, 38.4% were non-families, and 28.1% of all households were made up of individuals. The average household size was 2.44 and the average family size was 3.02. The median age was 32.1 years.[11]
The median income for a household in the county was $57,642 and the median income for a family was $77,093. Males had a median income of $52,271 versus $39,685 for females. The per capita income for the county was $28,167. About 6.2% of families and 12.9% of the population were below the poverty line, including 11.4% of those under age 18 and 5.5% of those age 65 or over.[13]
Communities
Cities
Town
Villages

Census-designated place
Other unincorporated communities
Townships
McLean County is divided into these townships:
Ghost towns
- Allin[14]
- Benjaminville
- Kumler
Government
McLean County has a twenty-member board representing ten districts within the county. Districts 1-3 encompass all of the county outside of Bloomington and Normal. Districts 4-6 are within the town limits of Normal, and districts 7-10 are within Bloomington city limits.
Politics
McLean County is historically a Republican-leaning county. The only Democrats to gain an absolute majority of the county's vote since the Civil War have been Franklin D. Roosevelt in 1932 and 1936 and Lyndon Johnson by a mere 420 votes out of over 38,000 total in 1964. Illinois resident Barack Obama in 2008 and Woodrow Wilson in 1912 both carried the county by narrow pluralities. McLean has trended Democratic, sufficiently so that Hillary Clinton in 2016 lost the county by just 1.3 percent despite failing to win the Presidency.
| Year | Republican | Democratic | Third parties |
|---|---|---|---|
| 2016 | 45.8% 37,237 | 44.5% 36,196 | 9.7% 7,891 |
| 2012 | 54.4% 39,947 | 43.4% 31,883 | 2.2% 1,639 |
| 2008 | 48.5% 36,767 | 49.7% 37,689 | 1.9% 1,422 |
| 2004 | 57.6% 41,276 | 41.7% 29,877 | 0.7% 467 |
| 2000 | 55.8% 34,008 | 41.0% 24,936 | 3.2% 1,954 |
| 1996 | 49.5% 26,428 | 42.5% 22,708 | 8.0% 4,299 |
| 1992 | 43.4% 25,726 | 39.0% 23,090 | 17.7% 10,469 |
| 1988 | 61.8% 30,572 | 37.7% 18,659 | 0.6% 280 |
| 1984 | 66.6% 32,221 | 32.8% 15,880 | 0.5% 248 |
| 1980 | 61.1% 30,096 | 27.6% 13,587 | 11.3% 5,549 |
| 1976 | 62.1% 28,493 | 36.2% 16,601 | 1.7% 785 |
| 1972 | 67.6% 31,060 | 32.3% 14,824 | 0.2% 71 |
| 1968 | 59.2% 22,284 | 34.0% 12,779 | 6.8% 2,567 |
| 1964 | 49.4% 19,120 | 50.6% 19,550 | |
| 1960 | 63.9% 24,758 | 36.0% 13,971 | 0.1% 32 |
| 1956 | 67.6% 25,758 | 32.4% 12,332 | 0.1% 21 |
| 1952 | 64.8% 24,494 | 35.2% 13,296 | 0.1% 36 |
| 1948 | 58.5% 18,430 | 40.9% 12,904 | 0.6% 183 |
| 1944 | 57.7% 19,366 | 41.8% 14,011 | 0.6% 185 |
| 1940 | 54.4% 21,865 | 44.9% 18,024 | 0.7% 277 |
| 1936 | 43.0% 16,826 | 55.0% 21,508 | 2.0% 798 |
| 1932 | 43.1% 15,450 | 54.5% 19,535 | 2.5% 886 |
| 1928 | 65.4% 20,780 | 33.8% 10,742 | 0.8% 267 |
| 1924 | 56.0% 16,550 | 23.1% 6,826 | 21.0% 6,206 |
| 1920 | 65.3% 16,680 | 25.1% 6,411 | 9.6% 2,464 |
| 1916 | 53.2% 14,988 | 41.5% 11,699 | 5.2% 1,473 |
| 1912 | 30.2% 4,624 | 35.0% 5,356 | 34.7% 5,314 |
| 1908 | 55.9% 8,953 | 37.3% 5,982 | 6.8% 1,088 |
| 1904 | 58.7% 8,772 | 27.7% 4,149 | 13.6% 2,034 |
| 1900 | 56.4% 9,487 | 39.3% 6,613 | 4.3% 718 |
| 1896 | 59.6% 9,964 | 37.9% 6,328 | 2.5% 420 |
| 1892 | 50.4% 7,445 | 43.9% 6,487 | 5.6% 832 |
Notable persons
- Pokey LaFarge, musician and songwriter
- Bonnie Lou, recording artist and television celebrity
- William H. Rowe, farmer, businessman, and politician
References
- "State & County QuickFacts". United States Census Bureau. Archived from the original on June 6, 2011. Retrieved July 7, 2014.
- "Find a County". National Association of Counties. Archived from the original on May 31, 2011. Retrieved June 7, 2011.
- Gannett, Henry (1905). The Origin of Certain Place Names in the United States. U.S. Government Printing Office. p. 194.
- "Population, Housing Units, Area, and Density: 2010 - County". United States Census Bureau. Archived from the original on February 12, 2020. Retrieved July 12, 2015.
- "Monthly Averages for Bloomington, Illinois". The Weather Channel. Archived from the original on December 6, 2010. Retrieved January 27, 2011.
- "Population and Housing Unit Estimates". Retrieved May 21, 2020.
- "U.S. Decennial Census". United States Census Bureau. Retrieved July 7, 2014.
- "Historical Census Browser". University of Virginia Library. Archived from the original on August 11, 2012. Retrieved July 7, 2014.
- "Population of Counties by Decennial Census: 1900 to 1990". United States Census Bureau. Archived from the original on April 24, 2014. Retrieved July 7, 2014.
- "Census 2000 PHC-T-4. Ranking Tables for Counties: 1990 and 2000" (PDF). United States Census Bureau. Archived (PDF) from the original on December 18, 2014. Retrieved July 7, 2014.
- "DP-1 Profile of General Population and Housing Characteristics: 2010 Demographic Profile Data". United States Census Bureau. Archived from the original on February 13, 2020. Retrieved July 12, 2015.
- "DP02 SELECTED SOCIAL CHARACTERISTICS IN THE UNITED STATES – 2006-2010 American Community Survey 5-Year Estimates". United States Census Bureau. Archived from the original on February 13, 2020. Retrieved July 12, 2015.
- "DP03 SELECTED ECONOMIC CHARACTERISTICS – 2006-2010 American Community Survey 5-Year Estimates". United States Census Bureau. Archived from the original on February 13, 2020. Retrieved July 12, 2015.
- Gannett, Henry (May 6, 2018). "The Origin of Certain Place Names in the United States". U.S. Government Printing Office. Retrieved May 6, 2018 – via Google Books.
- Leip, David. "Dave Leip's Atlas of U.S. Presidential Elections". uselectionatlas.org. Archived from the original on March 23, 2018. Retrieved May 6, 2018.
External links
| Wikisource has original text related to this article: |
| Wikimedia Commons has media related to McLean County, Illinois. |
- McLean County Government Web Site
- McLean County Divorce
- Map of McLean Co., showing political subdivisions
Places adjacent to McLean County, Illinois | ||||||||||
|---|---|---|---|---|---|---|---|---|---|---|
| ||||||||||
Municipalities and communities of McLean County, Illinois, United States | ||
|---|---|---|
| Cities | Map of Illinois highlighting McLean County | |
| Town | ||
| Villages | ||
| Townships | ||
| CDP | ||
| Other unincorporated communities | ||
| Ghost towns | ||
| Authority control |
|
|---|