Champaign County, Illinois
Champaign County is a county in the U.S. state of Illinois. As of the 2010 census, its population was 201,081,[1] making it the 10th-most populous county in Illinois. Its county seat is Urbana.[2]
Champaign County | |
|---|---|
County | |
 The Champaign County Courthouse in Urbana | |
 Location within the U.S. state of Illinois | |
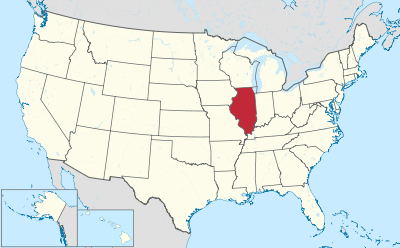 Illinois's location within the U.S. | |
| Coordinates: 40°08′N 88°12′W | |
| Country | |
| State | |
| Founded | 1833 |
| Named for | Champaign County, Ohio |
| Seat | Urbana |
| Largest city | Champaign |
| Area | |
| • Total | 998 sq mi (2,580 km2) |
| • Land | 996 sq mi (2,580 km2) |
| • Water | 2.1 sq mi (5 km2) 0.2% |
| Population (2010) | |
| • Total | 201,081 |
| • Estimate (2019) | 209,689 |
| • Density | 200/sq mi (78/km2) |
| Time zone | UTC−6 (Central) |
| • Summer (DST) | UTC−5 (CDT) |
| Congressional districts | 13th, 15th |
| Website | www |
Champaign County is part of the Champaign–Urbana, IL Metropolitan Statistical Area. The twin cities of Urbana and Champaign are the only cities in the county, and they nearly surround the campus of the University of Illinois at Urbana–Champaign.
History
Champaign County was organized in 1833, having been previously a part of Vermilion County. The county and county seat were named for Champaign County, Ohio and Urbana, Ohio respectively, the homeplace of the Illinois legislator who sponsored the bill to create the county. The development of the county was greatly furthered by the arrival of the Chicago Branch of the Illinois Central Railroad, and even more by the establishment of the land-grant university. Later, the county also got an airport and a mass transit district. The northern part of the county experienced an economic and demographic setback with the closing of Chanute Air Training Center in the 1990s. In the 2004 Presidential election, it was one of only 15 of the 102 Illinois counties where John Kerry received a majority of the vote (50.37%).[3]
 Champaign County at the time of its creation in 1833
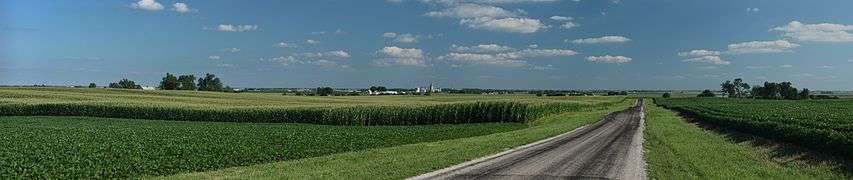
 Country grain elevator in Champaign County
Geography
According to the U.S. Census Bureau, the county has a total area of 998 square miles (2,580 km2), of which 996 square miles (2,580 km2) is land and 2.1 square miles (5.4 km2) (0.2%) is water.[4] It is the fifth-largest county in Illinois by land area.
Because Champaign County is situated on a large and very flat plateau, it had virtually no natural drainage, so that much of the County consisted of wetlands until drainage ditches were built, beginning in the 1870s. This was an example of an upland marsh, which resulted in a high incidence of malaria before the late nineteenth century.
The topography of Champaign County was formed by the Wisconsin Glacier about 20,000 years before the present. Lobes of ice from what is now Lake Michigan crossed the county, creating a deep pile of glacial soil, up to 300 feet thick, topped by numerous moraines forming small, flat watersheds with no outlets.
Champaign County is situated on the divide between the Ohio and Mississippi Rivers. Rivers flow out of Champaign County to the east, west, and south. The Kaskaskia River has its origin to the northwest of Champaign, draining the western side of that City. The Kaskaskia flows toward the southwest, joining the Mississippi south of St. Louis, Missouri.
The Embarras River, on the other hand, drains the south-central portion of the Champaign–Urbana metropolitan area, originating in southeastern Champaign and flowing through the experimental fields on the southern part of the campus of the University of Illinois. The Embarras is a tributary to the Wabash River and Ohio River systems. The northeast corner of Champaign, the central portion of the University campus, and the northern part of Urbana are drained by the Boneyard Creek, which flows into the Saline Ditch, a tributary of the Vermilion and Wabash rivers.

Adjacent counties
- McLean County – northwest
- Ford County – north
- Vermilion County – east
- Edgar County – southeast
- Douglas County – south
- Piatt County – west
Transportation
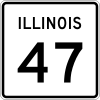
Major highways


Airports
The following public-use airports are located in the county:[5]
- University of Illinois Willard Airport (CMI) – Champaign–Urbana
- Rantoul National Aviation Center (Frank Elliott Field) (TIP) – Rantoul
- Frasca Field (C16) – Urbana
Rail
Passenger trains operated by Amtrak connect Champaign along the old Illinois Central route, operating between Chicago and either Carbondale (the Illini and Saluki services) or New Orleans (City of New Orleans service).
Renewable energy
In August 2018, the Champaign County Board voted to approve solar farms on certain agricultural properties. Solar farms use photovoltaic energy, which is energy produced by cells that generate electricity when they are hit by light. The board approved solar farms in AG-1 and AG-2 agricultural zoning districts. In order to make the solar farms, developers must obtain a special permit from the county board first. As of August 24, at least seven applications to build farms were submitted.[6]
Climate and weather
| Urbana, Illinois | ||||||||||||||||||||||||||||||||||||||||||||||||||||||||||||
|---|---|---|---|---|---|---|---|---|---|---|---|---|---|---|---|---|---|---|---|---|---|---|---|---|---|---|---|---|---|---|---|---|---|---|---|---|---|---|---|---|---|---|---|---|---|---|---|---|---|---|---|---|---|---|---|---|---|---|---|---|
| Climate chart (explanation) | ||||||||||||||||||||||||||||||||||||||||||||||||||||||||||||
| ||||||||||||||||||||||||||||||||||||||||||||||||||||||||||||
| ||||||||||||||||||||||||||||||||||||||||||||||||||||||||||||
In recent years, average temperatures in the county seat of Urbana have ranged from a low of 16 °F (−9 °C) in January to a high of 85 °F (29 °C) in July, although a record low of −25 °F (−32 °C) was recorded in January 1999 and a record high of 109 °F (43 °C) was recorded in July 1954. Average monthly precipitation ranged from 1.90 inches (48 mm) in January to 4.80 inches (122 mm) in May.[7]
Demographics

| Historical population | |||
|---|---|---|---|
| Census | Pop. | %± | |
| 1840 | 1,475 | — | |
| 1850 | 2,649 | 79.6% | |
| 1860 | 14,629 | 452.2% | |
| 1870 | 32,737 | 123.8% | |
| 1880 | 40,863 | 24.8% | |
| 1890 | 42,159 | 3.2% | |
| 1900 | 47,622 | 13.0% | |
| 1910 | 51,829 | 8.8% | |
| 1920 | 56,959 | 9.9% | |
| 1930 | 64,273 | 12.8% | |
| 1940 | 70,578 | 9.8% | |
| 1950 | 106,100 | 50.3% | |
| 1960 | 132,436 | 24.8% | |
| 1970 | 163,281 | 23.3% | |
| 1980 | 168,392 | 3.1% | |
| 1990 | 173,025 | 2.8% | |
| 2000 | 179,669 | 3.8% | |
| 2010 | 201,081 | 11.9% | |
| Est. 2019 | 209,689 | [8] | 4.3% |
| U.S. Decennial Census[9] 1790–1960[10] 1900–1990[11] 1990–2000[12] 2010–2019[1] | |||
As of the 2010 census, there were 201,081 people, 80,665 households, and 42,737 families residing in the county.[13] The population density was 201.8 inhabitants per square mile (77.9/km2). There were 87,569 housing units at an average density of 87.9 per square mile (33.9/km2).[4] The racial makeup of the county was 73.4% white, 12.4% black or African American, 8.9% Asian, 0.3% American Indian, 0.1% Pacific islander, 2.2% from other races, and 2.7% from two or more races. Those of Hispanic or Latino origin made up 5.3% of the population.[13] In terms of ancestry, 23.9% were German, 12.2% were Irish, 11.5% were American, and 8.9% were English.[14]
Of the 80,665 households, 25.8% had children under the age of 18 living with them, 39.7% were married couples living together, 9.9% had a female householder with no husband present, 47.0% were non-families, and 33.2% of all households were made up of individuals. The average household size was 2.29 and the average family size was 2.95. The median age was 28.9 years.[13]
The median income for a household in the county was $45,262 and the median income for a family was $65,785. Males had a median income of $45,823 versus $35,321 for females. The per capita income for the county was $24,553. About 9.7% of families and 20.5% of the population were below the poverty line, including 20.2% of those under age 18 and 8.3% of those age 65 or over.[15]
The Champaign County Economic Development Corporation (CHCEDC) produced a 2009 County Demographic Profile which includes information on the population, labor, housing, cost of living, education, taxes, retail sales, transportation, quality of life, utilities.[16] CHCEDC also conducts labor force studies every two years and labor shed studies every few years.[17]
Economy
Supported by the University of Illinois, through such backings like Research Park, and Champaign County leaders, the area has shown even more growth in Information Technology, Micro/Nanotechnology, Bio-Imaging, Healthcare, Logistics, Distribution and Agribusiness in recent years.[18]
The Top 2009 Employers of the county are the University of Illinois, Carle Clinic Association, Carle Foundation Hospital, Champaign Schools Unit 4, Kraft Foods, Provena Covenant Medical, Parkland College, Kirby Foods, Christie Clinic Association, Urbana Schools District and Hobbico.[19]
Communities
Villages
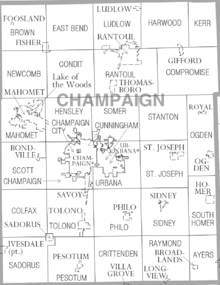
Townships
Census-designated places
Other unincorporated places
Ghost town
Politics
Like most of central Illinois, Champaign County was powerfully Republican between the Civil War and the latter portion of the 20th century. From 1856 to 1988, it only supported a Democrat three times, in the national Democratic landslides of 1932, 1936 and 1964.
Since 1988, Champaign County has been one of the few Democratic bastions in central Illinois, and has become one of the most Democratic counties in downstate Illinois. It has supported a Democrat in the last seven presidential elections, and since 2004 has given a majority to Democratic candidates. This is largely due to the political leanings of the University of Illinois campus community and staff. This tracks with Democratic gains in other counties influenced by college towns since the 1990s. The county's more rural precincts are still heavily Republican. However, they are no match for Champaign and Urbana, which account for over 60 percent of the county's population. George Bush senior in 1988 was the last Republican to carry the county, and Barack Obama's 2008 performance was the best by a Democrat. Donald Trump had a particularly poor showing in the county, receiving a little over 35% of the vote, his third-worst showing in the state and his worst outside the Chicago area.
| Year | Republican | Democratic | Third parties |
|---|---|---|---|
| 2016 | 36.4% 33,368 | 54.7% 50,137 | 8.9% 8,123 |
| 2012 | 44.9% 35,312 | 51.9% 40,831 | 3.1% 2,466 |
| 2008 | 40.1% 33,871 | 57.6% 48,597 | 2.3% 1,940 |
| 2004 | 48.4% 39,896 | 50.4% 41,524 | 1.2% 1,014 |
| 2000 | 46.6% 34,645 | 47.8% 35,515 | 5.6% 4,125 |
| 1996 | 42.5% 28,232 | 48.9% 32,454 | 8.6% 5,743 |
| 1992 | 35.6% 27,096 | 46.0% 35,003 | 18.4% 13,993 |
| 1988 | 52.4% 33,247 | 46.8% 29,733 | 0.8% 519 |
| 1984 | 58.6% 39,224 | 40.7% 27,266 | 0.7% 435 |
| 1980 | 51.0% 33,329 | 32.2% 21,017 | 16.9% 11,014 |
| 1976 | 54.7% 34,546 | 42.6% 26,858 | 2.7% 1,703 |
| 1972 | 57.4% 33,700 | 42.2% 24,743 | 0.4% 236 |
| 1968 | 53.5% 26,027 | 37.9% 18,425 | 8.6% 4,196 |
| 1964 | 46.0% 22,010 | 54.0% 25,792 | 0.0% 0 |
| 1960 | 61.2% 27,793 | 37.7% 17,115 | 1.2% 533 |
| 1956 | 67.1% 28,190 | 32.8% 13,799 | 0.1% 51 |
| 1952 | 65.9% 27,188 | 33.8% 13,951 | 0.3% 112 |
| 1948 | 60.9% 19,156 | 36.8% 11,572 | 2.3% 737 |
| 1944 | 57.5% 18,935 | 42.0% 13,842 | 0.5% 177 |
| 1940 | 53.3% 20,314 | 46.0% 17,563 | 0.7% 267 |
| 1936 | 45.8% 15,808 | 52.7% 18,203 | 1.5% 524 |
| 1932 | 45.0% 13,995 | 53.0% 16,474 | 1.9% 601 |
| 1928 | 68.3% 19,494 | 31.2% 8,915 | 0.5% 141 |
| 1924 | 62.8% 14,244 | 23.0% 5,221 | 14.2% 3,212 |
| 1920 | 71.8% 15,573 | 24.2% 5,247 | 4.0% 861 |
| 1916 | 57.8% 14,632 | 37.9% 9,601 | 4.2% 1,071 |
| 1912 | 25.6% 3,220 | 35.4% 4,454 | 38.9% 4,896 |
| 1908 | 57.2% 7,162 | 38.5% 4,830 | 4.3% 539 |
| 1904 | 61.1% 6,954 | 33.0% 3,754 | 5.9% 674 |
| 1900 | 55.1% 6,660 | 41.5% 5,015 | 3.5% 420 |
| 1896 | 57.7% 6,780 | 39.5% 4,643 | 2.9% 335 |
| 1892 | 50.9% 5,290 | 43.4% 4,502 | 5.7% 594 |
References
- "State & County QuickFacts". United States Census Bureau. Retrieved July 4, 2014.
- "Find a County". National Association of Counties. Archived from the original on May 31, 2011. Retrieved June 7, 2011.
- Leip, David. "Dave Leip's Atlas of U.S. Presidential Elections – 2004 Presidential General Election Results – Champaign County, Illinois". uselectionatlas.org. Retrieved April 18, 2018.
- "Population, Housing Units, Area, and Density: 2010 – County". United States Census Bureau. Archived from the original on February 12, 2020. Retrieved July 11, 2015.
- "Champaign County Public and Private Airports". www.tollfreeairline.com. Retrieved March 18, 2018.
- "Champaign County Board approves zoning changes for solar farms". Retrieved August 25, 2018.
- "Monthly Averages for Urbana, Illinois". The Weather Channel. Retrieved January 27, 2011.
- "Population and Housing Unit Estimates". Retrieved May 21, 2020.
- "U.S. Decennial Census". United States Census Bureau. Retrieved July 4, 2014.
- "Historical Census Browser". University of Virginia Library. Retrieved July 4, 2014.
- "Population of Counties by Decennial Census: 1900 to 1990". United States Census Bureau. Retrieved July 4, 2014.
- "Census 2000 PHC-T-4. Ranking Tables for Counties: 1990 and 2000" (PDF). United States Census Bureau. Retrieved July 4, 2014.
- "DP-1 Profile of General Population and Housing Characteristics: 2010 Demographic Profile Data". United States Census Bureau. Archived from the original on February 13, 2020. Retrieved July 11, 2015.
- "DP02 SELECTED SOCIAL CHARACTERISTICS IN THE UNITED STATES – 2006–2010 American Community Survey 5-Year Estimates". United States Census Bureau. Archived from the original on February 13, 2020. Retrieved July 11, 2015.
- "DP03 SELECTED ECONOMIC CHARACTERISTICS – 2006–2010 American Community Survey 5-Year Estimates". United States Census Bureau. Archived from the original on February 13, 2020. Retrieved July 11, 2015.
- Archived September 30, 2011, at the Wayback Machine
- Archived November 20, 2011, at the Wayback Machine
- Archived October 22, 2011, at the Wayback Machine
- Archived October 22, 2011, at the Wayback Machine
- Leip, David. "Dave Leip's Atlas of U.S. Presidential Elections". uselectionatlas.org. Retrieved March 18, 2018.
Bibliography
- Mathews, Milton W; McLean, Lewis A. (1886). Early History and Pioneers of Champaign County. Urbana, Illinois: Champaign County Herald. Retrieved November 29, 2010.
- Stewart, J. R., ed. (1918). A Standard History of Champaign County Illinois. 1. Chicago and New York: The Lewis Publishing Company. Retrieved November 29, 2010.
- Stewart, J. R., ed. (1918). A Standard History of Champaign County Illinois. 2. Chicago and New York: The Lewis Publishing Company. Retrieved November 29, 2010.
- Cunningham, Joseph O., ed. (1905). Historical Encyclopedia of Illinois and History of Champaign County. Chicago: Munsell Publishing Company. pp. 631–1060. Retrieved November 29, 2010.
External links
- Champaign County Official Page
- Champaign County Visitors Information
- Champaign County Economic Development Corporation
- United States Census Bureau 2007 TIGER/Line Shapefiles
- United States Board on Geographic Names (GNIS)
- United States National Atlas
- Book of the Champaign County Courthouse dedication from 1901
Places adjacent to Champaign County, Illinois | ||||||||||
|---|---|---|---|---|---|---|---|---|---|---|
| ||||||||||
Municipalities and communities of Champaign County, Illinois, United States | ||
|---|---|---|
| Cities | Map of Illinois highlighting Champaign County | |
| Villages | ||
| Townships | ||
| CDPs | ||
| Other unincorporated communities | ||
| Ghost town | ||
| Footnotes | ‡This populated place also has portions in an adjacent county or counties | |

| Authority control |
|
|---|