1964 United States presidential election in Illinois
The 1964 United States presidential election in Illinois took place on November 3, 1964, as part of the 1964 United States presidential election. State voters chose twenty-six[2] representatives, or electors, to the Electoral College, who voted for president and vice president.
| ||||||||||||||||||||||||||
| ||||||||||||||||||||||||||
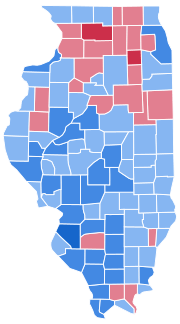 County Results
| ||||||||||||||||||||||||||
| ||||||||||||||||||||||||||

| Elections in Illinois | ||||||||||
|---|---|---|---|---|---|---|---|---|---|---|
 | ||||||||||
|
||||||||||
|
||||||||||
|
||||||||||
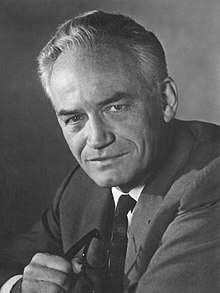
Illinois was won by incumbent President Lyndon B. Johnson (D–Texas), with 59.47% of the popular vote, against Senator Barry Goldwater (R–Arizona), with 40.53% of the popular vote.[3][4] As of the 2016 presidential election, this is the last election in which Adams County, Morgan County, Effingham County, Logan County, Wayne County, DeWitt County, Menard County, Wabash County, and Scott County voted for a Democratic Presidential candidate.[5] This would be the last time until 1992 that Illinois would go for a Democrat in a presidential election.
Results
| Party | Candidate | Votes | % | |
|---|---|---|---|---|
| Democratic | Lyndon B. Johnson (inc.) | 2,796,833 | 59.47% | |
| Republican | Barry Goldwater | 1,905,946 | 40.53% | |
| Write-in | 62 | 0.00% | ||
| Total votes | 4,702,841 | 100% | ||
Results by county
| County | Lyndon Baines Johnson Democratic |
Barry Morris Goldwater Republican |
Various candidates Write-ins |
Margin | Total votes cast[6] | ||||
|---|---|---|---|---|---|---|---|---|---|
| # | % | # | % | # | % | # | % | ||
| Adams | 18,321 | 56.70% | 13,993 | 43.30% | 4,328 | 13.39% | 32,314 | ||
| Alexander | 4,763 | 62.20% | 2,895 | 37.80% | 1,868 | 24.39% | 7,658 | ||
| Bond | 3,815 | 55.51% | 3,058 | 44.49% | 757 | 11.01% | 6,873 | ||
| Boone | 3,694 | 42.23% | 5,053 | 57.77% | -1,359 | -15.54% | 8,747 | ||
| Brown | 2,083 | 60.59% | 1,355 | 39.41% | 728 | 21.18% | 3,438 | ||
| Bureau | 9,086 | 48.75% | 9,552 | 51.25% | -466 | -2.50% | 18,638 | ||
| Calhoun | 1,805 | 58.36% | 1,288 | 41.64% | 517 | 16.72% | 3,093 | ||
| Carroll | 4,062 | 47.51% | 4,487 | 52.49% | -425 | -4.97% | 8,549 | ||
| Cass | 4,424 | 60.94% | 2,836 | 39.06% | 1,588 | 21.87% | 7,260 | ||
| Champaign | 25,792 | 53.96% | 22,010 | 46.04% | 3,782 | 7.91% | 47,802 | ||
| Christian | 11,898 | 65.91% | 6,153 | 34.09% | 5,745 | 31.83% | 18,051 | ||
| Clark | 4,464 | 50.34% | 4,403 | 49.66% | 61 | 0.69% | 8,867 | ||
| Clay | 4,551 | 55.39% | 3,665 | 44.61% | 886 | 10.78% | 8,216 | ||
| Clinton | 7,339 | 61.00% | 4,692 | 39.00% | 2,647 | 22.00% | 12,031 | ||
| Coles | 11,377 | 56.17% | 8,878 | 43.83% | 2,499 | 12.34% | 20,255 | ||
| Cook | 1,537,181 | 63.18% | 895,718 | 36.82% | 641,463 | 26.37% | 2,432,899 | ||
| Crawford | 5,624 | 53.78% | 4,834 | 46.22% | 790 | 7.55% | 10,458 | ||
| Cumberland | 3,056 | 57.58% | 2,251 | 42.42% | 805 | 15.17% | 5,307 | ||
| DeKalb | 10,257 | 46.52% | 11,791 | 53.48% | 1 | 0.00% | -1,534 | -6.96% | 22,049 |
| DeWitt | 4,371 | 54.80% | 3,605 | 45.20% | 766 | 9.60% | 7,976 | ||
| Douglas | 4,695 | 52.65% | 4,223 | 47.35% | 472 | 5.29% | 8,918 | ||
| DuPage | 66,229 | 40.11% | 98,871 | 59.89% | -32,642 | -19.77% | 165,100 | ||
| Edgar | 5,966 | 50.59% | 5,827 | 49.41% | 139 | 1.18% | 11,793 | ||
| Edwards | 1,991 | 46.81% | 2,262 | 53.19% | -271 | -6.37% | 4,253 | ||
| Effingham | 6,782 | 57.35% | 5,044 | 42.65% | 1,738 | 14.70% | 11,826 | ||
| Fayette | 6,295 | 58.36% | 4,492 | 41.64% | 1,803 | 16.71% | 10,787 | ||
| Ford | 3,427 | 42.43% | 4,650 | 57.57% | -1,223 | -15.14% | 8,077 | ||
| Franklin | 13,581 | 64.06% | 7,620 | 35.94% | 5,961 | 28.12% | 21,201 | ||
| Fulton | 13,030 | 62.60% | 7,785 | 37.40% | 5,245 | 25.20% | 20,815 | ||
| Gallatin | 2,845 | 67.11% | 1,394 | 32.89% | 1,451 | 34.23% | 4,239 | ||
| Greene | 4,781 | 60.45% | 3,128 | 39.55% | 1,653 | 20.90% | 7,909 | ||
| Grundy | 5,246 | 48.72% | 5,522 | 51.28% | -276 | -2.56% | 10,768 | ||
| Hamilton | 3,133 | 55.02% | 2,561 | 44.98% | 572 | 10.05% | 5,694 | ||
| Hancock | 6,199 | 52.73% | 5,557 | 47.27% | 642 | 5.46% | 11,756 | ||
| Hardin | 1,639 | 55.32% | 1,324 | 44.68% | 315 | 10.63% | 2,963 | ||
| Henderson | 2,271 | 54.93% | 1,863 | 45.07% | 408 | 9.87% | 4,134 | ||
| Henry | 12,085 | 53.17% | 10,644 | 46.83% | 1,441 | 6.34% | 22,729 | ||
| Iroquois | 7,029 | 42.72% | 9,423 | 57.28% | -2,394 | -14.55% | 16,452 | ||
| Jackson | 12,165 | 63.43% | 7,013 | 36.57% | 5,152 | 26.86% | 19,178 | ||
| Jasper | 3,406 | 56.58% | 2,614 | 43.42% | 792 | 13.16% | 6,020 | ||
| Jefferson | 9,653 | 60.71% | 6,248 | 39.29% | 3,405 | 21.41% | 15,901 | ||
| Jersey | 3,936 | 56.41% | 3,041 | 43.59% | 895 | 12.83% | 6,977 | ||
| Jo Daviess | 4,818 | 51.12% | 4,607 | 48.88% | 211 | 2.24% | 9,425 | ||
| Johnson | 1,770 | 44.39% | 2,217 | 55.61% | -447 | -11.21% | 3,987 | ||
| Kane | 40,703 | 46.73% | 46,391 | 53.27% | -5,688 | -6.53% | 87,094 | ||
| Kankakee | 20,792 | 56.39% | 16,082 | 43.61% | 4,710 | 12.77% | 36,874 | ||
| Kendall | 3,430 | 37.53% | 5,710 | 62.47% | -2,280 | -24.95% | 9,140 | ||
| Knox | 15,000 | 53.86% | 12,850 | 46.14% | 2,150 | 7.72% | 27,850 | ||
| Lake | 62,785 | 51.60% | 58,840 | 48.36% | 42 | 0.03% | 3,945 | 3.24% | 121,667 |
| LaSalle | 30,923 | 59.31% | 21,216 | 40.69% | 9,707 | 18.62% | 52,139 | ||
| Lawrence | 5,136 | 55.15% | 4,176 | 44.85% | 960 | 10.31% | 9,312 | ||
| Lee | 7,315 | 46.41% | 8,445 | 53.59% | -1,130 | -7.17% | 15,760 | ||
| Livingston | 8,476 | 45.29% | 10,239 | 54.71% | -1,763 | -9.42% | 18,715 | ||
| Logan | 7,712 | 53.12% | 6,805 | 46.88% | 907 | 6.25% | 14,517 | ||
| Macon | 35,045 | 66.12% | 17,957 | 33.88% | 17,088 | 32.24% | 53,002 | ||
| Macoupin | 15,227 | 64.37% | 8,430 | 35.63% | 6,797 | 28.73% | 23,657 | ||
| Madison | 65,115 | 68.45% | 30,009 | 31.55% | 35,106 | 36.91% | 95,124 | ||
| Marion | 12,363 | 63.65% | 7,060 | 36.35% | 5,303 | 27.30% | 19,423 | ||
| Marshall | 3,561 | 52.60% | 3,209 | 47.40% | 352 | 5.20% | 6,770 | ||
| Mason | 4,857 | 63.16% | 2,833 | 36.84% | 2,024 | 26.32% | 7,690 | ||
| Massac | 3,396 | 52.46% | 3,078 | 47.54% | 318 | 4.91% | 6,474 | ||
| McDonough | 6,144 | 47.08% | 6,907 | 52.92% | -763 | -5.85% | 13,051 | ||
| McHenry | 18,014 | 44.46% | 22,503 | 55.54% | -4,489 | -11.08% | 40,517 | ||
| McLean | 19,550 | 50.56% | 19,120 | 49.44% | 430 | 1.11% | 38,670 | ||
| Menard | 2,491 | 51.76% | 2,322 | 48.24% | 169 | 3.51% | 4,813 | ||
| Mercer | 4,410 | 51.10% | 4,220 | 48.90% | 190 | 2.20% | 8,630 | ||
| Monroe | 4,605 | 53.92% | 3,936 | 46.08% | 669 | 7.83% | 8,541 | ||
| Montgomery | 10,581 | 62.22% | 6,425 | 37.78% | 4,156 | 24.44% | 17,006 | ||
| Morgan | 9,235 | 56.05% | 7,240 | 43.95% | 1,995 | 12.11% | 16,475 | ||
| Moultrie | 3,733 | 59.96% | 2,493 | 40.04% | 1,240 | 19.92% | 6,226 | ||
| Ogle | 6,917 | 39.87% | 10,430 | 60.13% | -3,513 | -20.25% | 17,347 | ||
| Peoria | 47,360 | 58.70% | 33,327 | 41.30% | 14,033 | 17.39% | 80,687 | ||
| Perry | 6,639 | 60.76% | 4,287 | 39.24% | 2,352 | 21.53% | 10,926 | ||
| Piatt | 3,897 | 55.37% | 3,141 | 44.63% | 756 | 10.74% | 7,038 | ||
| Pike | 6,576 | 61.52% | 4,113 | 38.48% | 2,463 | 23.04% | 10,689 | ||
| Pope | 1,117 | 45.67% | 1,329 | 54.33% | -212 | -8.67% | 2,446 | ||
| Pulaski | 3,332 | 66.01% | 1,716 | 33.99% | 1,616 | 32.01% | 5,048 | ||
| Putnam | 1,359 | 54.58% | 1,131 | 45.42% | 228 | 9.16% | 2,490 | ||
| Randolph | 9,199 | 61.32% | 5,803 | 38.68% | 3,396 | 22.64% | 15,002 | ||
| Richland | 4,239 | 52.08% | 3,901 | 47.92% | 338 | 4.15% | 8,140 | ||
| Rock Island | 41,759 | 63.78% | 23,714 | 36.22% | 18,045 | 27.56% | 65,473 | ||
| Saline | 8,337 | 59.43% | 5,691 | 40.57% | 2,646 | 18.86% | 14,028 | ||
| Sangamon | 43,073 | 56.55% | 33,077 | 43.43% | 16 | 0.02% | 9,996 | 13.12% | 76,166 |
| Schuyler | 2,504 | 50.88% | 2,417 | 49.12% | 87 | 1.77% | 4,921 | ||
| Scott | 1,952 | 54.54% | 1,627 | 45.46% | 325 | 9.08% | 3,579 | ||
| Shelby | 7,088 | 62.34% | 4,281 | 37.66% | 2,807 | 24.69% | 11,369 | ||
| St. Clair | 74,005 | 72.39% | 28,226 | 27.61% | 45,779 | 44.78% | 102,231 | ||
| Stark | 1,776 | 45.62% | 2,117 | 54.38% | -341 | -8.76% | 3,893 | ||
| Stephenson | 10,854 | 53.98% | 9,252 | 46.02% | 1,602 | 7.97% | 20,106 | ||
| Tazewell | 28,561 | 62.45% | 17,170 | 37.55% | 11,391 | 24.91% | 45,731 | ||
| Union | 5,208 | 62.37% | 3,142 | 37.63% | 2,066 | 24.74% | 8,350 | ||
| Vermilion | 24,765 | 55.94% | 19,506 | 44.06% | 5,259 | 11.88% | 44,271 | ||
| Wabash | 3,721 | 56.16% | 2,905 | 43.84% | 816 | 12.32% | 6,626 | ||
| Warren | 4,670 | 47.02% | 5,258 | 52.95% | 3 | 0.03% | -588 | -5.92% | 9,931 |
| Washington | 3,670 | 48.87% | 3,840 | 51.13% | -170 | -2.26% | 7,510 | ||
| Wayne | 5,198 | 52.28% | 4,745 | 47.72% | 453 | 4.56% | 9,943 | ||
| White | 5,963 | 59.85% | 4,000 | 40.15% | 1,963 | 19.70% | 9,963 | ||
| Whiteside | 12,536 | 49.21% | 12,940 | 50.79% | -404 | -1.59% | 25,476 | ||
| Will | 49,663 | 56.25% | 38,619 | 43.75% | 11,044 | 12.51% | 88,282 | ||
| Williamson | 14,613 | 61.55% | 9,130 | 38.45% | 5,483 | 23.09% | 23,743 | ||
| Winnebago | 48,834 | 55.02% | 39,920 | 44.98% | 8,914 | 10.04% | 88,754 | ||
| Woodford | 5,914 | 48.63% | 6,248 | 51.37% | -334 | -2.75% | 12,162 | ||
| Totals | 2,796,833 | 59.47% | 1,905,946 | 40.53% | 62 | 0.00% | 890,887 | 18.94% | 4,702,841 |
References
- "United States Presidential election of 1964 - Encyclopædia Britannica". Retrieved May 30, 2017.
- "1964 Election for the Forty-Fifth Term (1965-69)". Retrieved May 30, 2017.
- "1964 Presidential General Election Results - Illinois". Retrieved May 30, 2017.
- "The American Presidency Project - Election of 1964". Retrieved May 30, 2017.
- Sullivan, Robert David; ‘How the Red and Blue Map Evolved Over the Past Century’; America Magazine in The National Catholic Review; June 29, 2016
- Scammon, Richard M. (compiler); America at the Polls: A Handbook of Presidential Election Statistics 1920-1964; pp. 134-135 ISBN 0405077114
