Ford County, Illinois
Ford County is a county in the U.S. state of Illinois. According to the 2010 United States Census, it had a population of 14,081.[1] Its county seat is Paxton.[2]
Ford County | |
|---|---|
 Ford County Courthouse in Paxton | |
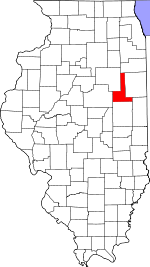 Location within the U.S. state of Illinois | |
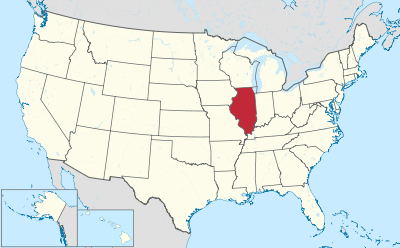 Illinois's location within the U.S. | |
| Coordinates: 40°35′N 88°13′W | |
| Country | |
| State | |
| Founded | 1859 |
| Named for | Thomas Ford |
| Seat | Paxton |
| Largest city | Paxton |
| Area | |
| • Total | 486 sq mi (1,260 km2) |
| • Land | 486 sq mi (1,260 km2) |
| • Water | 0.6 sq mi (2 km2) 0.1% |
| Population (2010) | |
| • Total | 14,081 |
| • Estimate (2018) | 13,264 |
| • Density | 29/sq mi (11/km2) |
| Time zone | UTC−6 (Central) |
| • Summer (DST) | UTC−5 (CDT) |
| Congressional districts | 15th, 16th |
| Website | www |
Ford County is part of the Champaign–Urbana, IL Metropolitan Statistical Area.
History
Ford County was formed February 17, 1859. It was the last of Illinois's 102 counties to be formed, and was created at the behest of some residents of Vermilion County, who complained to the General Assembly that they lived too far from the county seat. Ford County was named after Thomas Ford, the Governor of Illinois from 1842 to 1846.[3]
 The creation of Douglas and Ford Counties in 1859 resulted in Illinois's current county map.
Geography
According to the US Census Bureau, the county has a total area of 486 square miles (1,260 km2), of which 486 square miles (1,260 km2) is land and 0.6 square miles (1.6 km2) (0.1%) is water.[4]
Climate and weather
| Paxton, Illinois | ||||||||||||||||||||||||||||||||||||||||||||||||||||||||||||
|---|---|---|---|---|---|---|---|---|---|---|---|---|---|---|---|---|---|---|---|---|---|---|---|---|---|---|---|---|---|---|---|---|---|---|---|---|---|---|---|---|---|---|---|---|---|---|---|---|---|---|---|---|---|---|---|---|---|---|---|---|
| Climate chart (explanation) | ||||||||||||||||||||||||||||||||||||||||||||||||||||||||||||
| ||||||||||||||||||||||||||||||||||||||||||||||||||||||||||||
| ||||||||||||||||||||||||||||||||||||||||||||||||||||||||||||
In recent years, average temperatures in the county seat of Paxton have ranged from a low of 14 °F (−10 °C) in January to a high of 85 °F (29 °C) in July, although a record low of −25 °F (−32 °C) was recorded in January 1999 and a record high of 102 °F (39 °C) was recorded in June 1988. Average monthly precipitation ranged from 1.40 inches (36 mm) in February to 4.38 inches (111 mm) in May.[5]
Adjacent counties
- Kankakee County – north
- Iroquois County – east
- Vermilion County – southeast
- Champaign County – south
- McLean County – southwest
- Livingston County – west
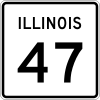
Major highways


Demographics
| Historical population | |||
|---|---|---|---|
| Census | Pop. | %± | |
| 1860 | 1,979 | — | |
| 1870 | 9,103 | 360.0% | |
| 1880 | 15,099 | 65.9% | |
| 1890 | 17,035 | 12.8% | |
| 1900 | 18,359 | 7.8% | |
| 1910 | 17,096 | −6.9% | |
| 1920 | 16,466 | −3.7% | |
| 1930 | 15,489 | −5.9% | |
| 1940 | 15,007 | −3.1% | |
| 1950 | 15,901 | 6.0% | |
| 1960 | 16,606 | 4.4% | |
| 1970 | 16,382 | −1.3% | |
| 1980 | 15,265 | −6.8% | |
| 1990 | 14,275 | −6.5% | |
| 2000 | 14,241 | −0.2% | |
| 2010 | 14,081 | −1.1% | |
| Est. 2018 | 13,264 | [6] | −5.8% |
| US Decennial Census[7] 1790-1960[8] 1900-1990[9] 1990-2000[10] 2010-2013[1] | |||

As of the 2010 United States Census, there were 14,081 people, 5,676 households, and 3,798 families living in the county.[11] The population density was 29.0 inhabitants per square mile (11.2/km2). There were 6,282 housing units at an average density of 12.9 per square mile (5.0/km2).[4] The racial makeup of the county was 97.1% white, 0.6% black or African American, 0.3% Asian, 0.2% American Indian, 0.6% from other races, and 1.1% from two or more races. Those of Hispanic or Latino origin made up 2.1% of the population.[11] In terms of ancestry, 35.7% were German, 15.5% were Irish, 13.6% were American, and 10.4% were English.[12]
Of the 5,676 households, 30.6% had children under the age of 18 living with them, 52.8% were married couples living together, 9.8% had a female householder with no husband present, 33.1% were non-families, and 29.2% of all households were made up of individuals. The average household size was 2.41 and the average family size was 2.95. The median age was 42.4 years.[11]
The median income for a household in the county was $48,667 and the median income for a family was $62,819. Males had a median income of $43,849 versus $30,136 for females. The per capita income for the county was $23,401. About 5.4% of families and 8.3% of the population were below the poverty line, including 8.3% of those under age 18 and 8.8% of those age 65 or over.[13]
Communities
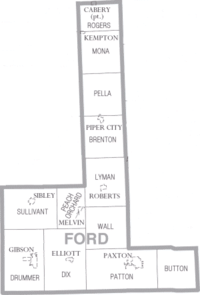
Cities
Unincorporated communities
- Clarence
- Guthrie
- Perdueville
- Stelle
Extinct settlements
Politics
Ford County is one of the state's most consistently Republican counties; since its 1859 organization it has voted for Republican presidential candidates in all but two elections. In 1912, the GOP was mortally divided and Progressive Theodore Roosevelt carried the county over the more conservative official nominee William Howard Taft; in 1932, at the height of the Great Depression, Franklin D. Roosevelt in the first of his four campaigns became and has remained the only Democrat to carry Ford County. Since 1968 no Democratic presidential candidate has topped 36% of the county's vote, and since the county first formed only three Democrats – all in landslide national victories – have managed 40% of Ford County's votes.
The Libertarian Party has performed well enough in recent elections to gain "established party" status, making it easier for Libertarian candidates to appear on the ballot. Ford is the only county in Illinois where this is the case.[14]
President Gerald Ford visited Ford County on October 24, 1974, to mark the retirement of Congressman Leslie C. Arends of Melvin who served in Congress for 40 years, including over 30 years as Republican Minority Whip.[15]
| Year | Republican | Democratic | Third parties |
|---|---|---|---|
| 2016 | 70.0% 4,480 | 22.1% 1,414 | 7.9% 502 |
| 2012 | 70.2% 4,229 | 27.5% 1,656 | 2.3% 139 |
| 2008 | 63.7% 4,079 | 34.8% 2,227 | 1.5% 94 |
| 2004 | 69.6% 4,511 | 29.5% 1,912 | 0.9% 56 |
| 2000 | 63.2% 3,889 | 34.0% 2,090 | 2.8% 174 |
| 1996 | 53.3% 3,077 | 35.8% 2,065 | 10.9% 628 |
| 1992 | 47.0% 3,046 | 33.6% 2,175 | 19.5% 1,260 |
| 1988 | 66.1% 4,059 | 33.0% 2,026 | 1.0% 60 |
| 1984 | 73.1% 4,871 | 26.5% 1,763 | 0.4% 29 |
| 1980 | 69.6% 5,024 | 25.0% 1,803 | 5.4% 387 |
| 1976 | 63.6% 4,801 | 35.6% 2,690 | 0.8% 62 |
| 1972 | 74.5% 5,656 | 25.5% 1,934 | 0.0% 1 |
| 1968 | 65.4% 5,233 | 27.7% 2,216 | 6.9% 555 |
| 1964 | 57.6% 4,650 | 42.4% 3,427 | |
| 1960 | 68.2% 5,779 | 31.8% 2,698 | 0.0% 1 |
| 1956 | 73.7% 6,027 | 26.3% 2,152 | 0.0% 3 |
| 1952 | 74.5% 6,216 | 25.4% 2,121 | 0.1% 8 |
| 1948 | 69.9% 4,903 | 29.6% 2,079 | 0.5% 33 |
| 1944 | 69.9% 5,317 | 29.9% 2,270 | 0.2% 18 |
| 1940 | 65.1% 5,770 | 34.6% 3,062 | 0.3% 30 |
| 1936 | 53.8% 4,524 | 44.2% 3,715 | 2.0% 171 |
| 1932 | 43.9% 3,342 | 54.8% 4,175 | 1.3% 99 |
| 1928 | 68.7% 4,668 | 30.9% 2,098 | 0.4% 27 |
| 1924 | 70.5% 4,672 | 16.5% 1,093 | 13.0% 859 |
| 1920 | 82.4% 4,995 | 15.8% 958 | 1.8% 109 |
| 1916 | 66.3% 4,670 | 29.2% 2,054 | 4.5% 319 |
| 1912 | 22.4% 832 | 27.9% 1,035 | 49.6% 1,841 |
| 1908 | 65.6% 2,617 | 29.2% 1,164 | 5.2% 209 |
| 1904 | 71.2% 2,836 | 23.3% 926 | 5.5% 220 |
| 1900 | 64.9% 2,936 | 32.5% 1,469 | 2.7% 121 |
| 1896 | 64.3% 2,832 | 34.2% 1,507 | 1.5% 67 |
| 1892 | 58.4% 2,227 | 35.6% 1,359 | 6.0% 227 |
References
- "State & County QuickFacts". US Census Bureau. Archived from the original on June 6, 2011. Retrieved July 5, 2014.
- "Find a County". National Association of Counties. Archived from the original on May 3, 2015. Retrieved June 7, 2011.
- Gannett, Henry (1905). The Origin of Certain Place Names in the United States. Govt. Print. Off. p. 128.
- "Population, Housing Units, Area, and Density: 2010 - County". US Census Bureau. Archived from the original on February 12, 2020. Retrieved July 11, 2015.
- "Monthly Averages for Paxton IL". The Weather Channel. Retrieved January 27, 2011.
- "Population and Housing Unit Estimates". Retrieved November 6, 2019.
- "US Decennial Census". US Census Bureau. Retrieved July 5, 2014.
- "Historical Census Browser". University of Virginia Library. Retrieved July 5, 2014.
- "Population of Counties by Decennial Census: 1900 to 1990". United States Census Bureau. Retrieved July 5, 2014.
- "Census 2000 PHC-T-4. Ranking Tables for Counties: 1990 and 2000" (PDF). US Census Bureau. Retrieved July 5, 2014.
- "Profile of General Population and Housing Characteristics: 2010 Demographic Profile Data". US Census Bureau. Archived from the original on February 13, 2020. Retrieved July 11, 2015.
- "Selected Social Characteristics in the United States – 2006-2010 American Community Survey 5-Year Estimates". US Census Bureau. Archived from the original on February 13, 2020. Retrieved July 11, 2015.
- "Selected Economic Characteristics – 2006-2010 American Community Survey 5-Year Estimates". US Census Bureau. Archived from the original on February 13, 2020. Retrieved July 11, 2015.
- Archived news story from 1999
- Welcome to Paxton Archived 12 December 2010 at the Wayback Machine, accessed February 15, 2011.
- Leip, David. "Atlas of US Presidential Elections". uselectionatlas.org. Retrieved November 1, 2018.
External links
- History of Ford County - Information from Centurama Celebrating The First 100 Years of Ford County, Illinois 1859-1959
Places adjacent to Ford County, Illinois | ||||||||||
|---|---|---|---|---|---|---|---|---|---|---|
| ||||||||||
Municipalities and communities of Ford County, Illinois, United States | ||
|---|---|---|
| Cities | Map of Illinois highlighting Ford County | |
| Villages | ||
| Townships | ||
| Unincorporated communities | ||
| Footnotes | ‡This populated place also has portions in an adjacent county or counties | |