Hamilton County, Illinois
Hamilton County is a county located in the U.S. state of Illinois. According to the 2010 census, it has a population of 8,457.[1] Its county seat is McLeansboro.[2] It is located in the southern portion of the state known locally as "Little Egypt".
Hamilton County | |
|---|---|
 Hamilton County Courthouse in McLeansboro | |
 Seal | |
 Location within the U.S. state of Illinois | |
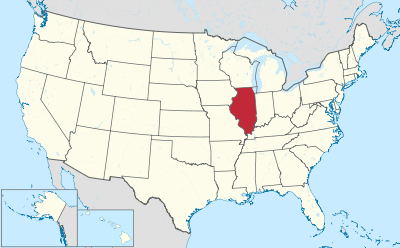 Illinois's location within the U.S. | |
| Coordinates: 38°05′N 88°32′W | |
| Country | |
| State | |
| Founded | 1821 |
| Named for | Alexander Hamilton |
| Seat | McLeansboro |
| Largest city | McLeansboro |
| Area | |
| • Total | 436 sq mi (1,130 km2) |
| • Land | 435 sq mi (1,130 km2) |
| • Water | 1.2 sq mi (3 km2) 0.3% |
| Population (2010) | |
| • Total | 8,457 |
| • Estimate (2018) | 8,163 |
| • Density | 19/sq mi (7.5/km2) |
| Time zone | UTC−6 (Central) |
| • Summer (DST) | UTC−5 (CDT) |
| Congressional district | 15th |
| Website | www |
History
Hamilton County was formed out of White County in 1821. It is named for Alexander Hamilton, Revolutionary War hero and the first United States Secretary of the Treasury.[3]
 Hamilton County at the time of its creation in 1821
On March 18, 1925, the infamous Tri-State Tornado tore across the county, destroying dozens of homes and farms in Flannigan, Twigg, Mayberry and Crook townships, and killing 37 people.
Geography
According to the U.S. Census Bureau, the county has a total area of 436 square miles (1,130 km2), of which 435 square miles (1,130 km2) is land and 1.2 square miles (3.1 km2) (0.3%) is water.[4]
Climate and weather
| McLeansboro, Illinois | ||||||||||||||||||||||||||||||||||||||||||||||||||||||||||||
|---|---|---|---|---|---|---|---|---|---|---|---|---|---|---|---|---|---|---|---|---|---|---|---|---|---|---|---|---|---|---|---|---|---|---|---|---|---|---|---|---|---|---|---|---|---|---|---|---|---|---|---|---|---|---|---|---|---|---|---|---|
| Climate chart (explanation) | ||||||||||||||||||||||||||||||||||||||||||||||||||||||||||||
| ||||||||||||||||||||||||||||||||||||||||||||||||||||||||||||
| ||||||||||||||||||||||||||||||||||||||||||||||||||||||||||||
In recent years, average temperatures in the county seat of McLeansboro have ranged from a low of 20 °F (−7 °C) in January to a high of 89 °F (32 °C) in July, although a record low of −23 °F (−31 °C) was recorded in January 1930 and a record high of 113 °F (45 °C) was recorded in July 1936. Average monthly precipitation ranged from 2.76 inches (70 mm) in February to 4.67 inches (119 mm) in May.[5]
Major highways
Adjacent counties
- Wayne County - north
- White County - east
- Gallatin County - southeast
- Saline County - south
- Franklin County - west
- Jefferson County - northwest
Demographics
| Historical population | |||
|---|---|---|---|
| Census | Pop. | %± | |
| 1830 | 2,616 | — | |
| 1840 | 3,945 | 50.8% | |
| 1850 | 6,362 | 61.3% | |
| 1860 | 9,915 | 55.8% | |
| 1870 | 13,014 | 31.3% | |
| 1880 | 16,712 | 28.4% | |
| 1890 | 17,800 | 6.5% | |
| 1900 | 20,197 | 13.5% | |
| 1910 | 18,227 | −9.8% | |
| 1920 | 15,920 | −12.7% | |
| 1930 | 12,995 | −18.4% | |
| 1940 | 13,454 | 3.5% | |
| 1950 | 12,256 | −8.9% | |
| 1960 | 10,010 | −18.3% | |
| 1970 | 8,665 | −13.4% | |
| 1980 | 9,172 | 5.9% | |
| 1990 | 8,499 | −7.3% | |
| 2000 | 8,621 | 1.4% | |
| 2010 | 8,457 | −1.9% | |
| Est. 2018 | 8,163 | [6] | −3.5% |
| U.S. Decennial Census[7] 1790-1960[8] 1900-1990[9] 1990-2000[10] 2010-2013[1] | |||
As of the 2010 United States Census, there were 8,457 people, 3,489 households, and 2,376 families residing in the county.[11] The population density was 19.5 inhabitants per square mile (7.5/km2). There were 4,104 housing units at an average density of 9.4 per square mile (3.6/km2).[4] The racial makeup of the county was 98.2% white, 0.4% black or African American, 0.2% Asian, 0.2% American Indian, 0.3% from other races, and 0.7% from two or more races. Those of Hispanic or Latino origin made up 1.2% of the population.[11] In terms of ancestry, 33.1% were German, 20.7% were Irish, 11.4% were English, and 10.3% were American.[12]
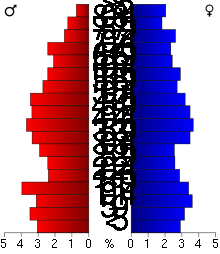
Of the 3,489 households, 29.8% had children under the age of 18 living with them, 54.9% were married couples living together, 9.2% had a female householder with no husband present, 31.9% were non-families, and 28.1% of all households were made up of individuals. The average household size was 2.39 and the average family size was 2.91. The median age was 43.1 years.[11]
The median income for a household in the county was $35,032 and the median income for a family was $50,878. Males had a median income of $45,245 versus $23,491 for females. The per capita income for the county was $21,602. About 8.2% of families and 14.5% of the population were below the poverty line, including 21.5% of those under age 18 and 8.5% of those age 65 or over.[13]
Communities
City
Town
Villages
- Broughton
- Dahlgren
- Macedonia (partly in Franklin County)
Unincorporated communities
Townships
Hamilton County is divided into twelve townships:
Politics
Like most of Southern-leaning Southern Illinois, Hamilton County was heavily Democratic before the Civil War, and unlike such counties as Johnson, Pope and Massac, it did not turn Republican after the war. Not until 1920, when isolationist sentiments turned many voters against the party of Woodrow Wilson, did Hamilton County vote Republican, and Herbert Hoover was to carry the county in 1928 due to anti-Catholic sentiment against Al Smith.
From 1940 onwards, when Wendell Willkie carried the county due to opposition to involvement in World War II, Hamilton has become increasingly Republican. Although Lyndon Johnson, Jimmy Carter in 1976 and Bill Clinton in 1992 all gained absolute majorities for the Democratic Party, since 1992, as with all traditionally Democratic parts of the Upland South, a very rapid swing to the Republicans has taken place due to overwhelming local opposition to the Democratic Party's liberal views on social issues.[14] Over the past six elections, the Republicans have advanced from losing by 21 percentage points to winning by an overwhelming fifty-eight – an average of gaining thirteen percentage points per election.
| Year | Republican | Democratic | Third parties |
|---|---|---|---|
| 2016 | 77.1% 3,206 | 19.3% 802 | 3.6% 148 |
| 2012 | 65.1% 2,566 | 32.2% 1,269 | 2.7% 106 |
| 2008 | 54.9% 2,353 | 41.9% 1,796 | 3.2% 135 |
| 2004 | 58.8% 2,653 | 40.2% 1,814 | 1.0% 47 |
| 2000 | 54.9% 2,519 | 42.4% 1,943 | 2.7% 125 |
| 1996 | 37.2% 1,677 | 49.7% 2,242 | 13.1% 590 |
| 1992 | 30.6% 1,521 | 51.9% 2,582 | 17.5% 871 |
| 1988 | 49.9% 2,622 | 49.8% 2,618 | 0.3% 16 |
| 1984 | 57.5% 3,074 | 42.1% 2,251 | 0.4% 21 |
| 1980 | 59.6% 3,254 | 36.5% 1,990 | 3.9% 212 |
| 1976 | 44.3% 2,433 | 55.2% 3,036 | 0.5% 29 |
| 1972 | 61.9% 3,282 | 37.9% 2,006 | 0.2% 11 |
| 1968 | 52.8% 2,912 | 35.4% 1,951 | 11.8% 650 |
| 1964 | 45.0% 2,561 | 55.0% 3,133 | |
| 1960 | 58.9% 3,804 | 40.9% 2,639 | 0.2% 11 |
| 1956 | 57.8% 3,675 | 42.2% 2,685 | 0.1% 4 |
| 1952 | 60.3% 4,047 | 39.6% 2,662 | 0.1% 8 |
| 1948 | 50.9% 2,887 | 48.5% 2,750 | 0.6% 32 |
| 1944 | 54.7% 3,582 | 44.5% 2,914 | 0.8% 55 |
| 1940 | 51.7% 4,005 | 47.6% 3,691 | 0.7% 52 |
| 1936 | 44.1% 3,321 | 55.1% 4,152 | 0.8% 62 |
| 1932 | 38.0% 2,513 | 61.3% 4,059 | 0.7% 45 |
| 1928 | 51.1% 3,275 | 47.4% 3,037 | 1.6% 100 |
| 1924 | 44.0% 2,659 | 52.4% 3,168 | 3.5% 214 |
| 1920 | 54.7% 3,220 | 44.0% 2,591 | 1.3% 75 |
| 1916 | 46.3% 3,239 | 52.1% 3,644 | 1.7% 118 |
| 1912 | 31.3% 1,242 | 48.4% 1,920 | 20.2% 802 |
| 1908 | 44.3% 1,809 | 52.1% 2,128 | 3.7% 150 |
| 1904 | 45.7% 1,894 | 49.4% 2,049 | 5.0% 206 |
| 1900 | 43.0% 1,911 | 55.5% 2,467 | 1.6% 71 |
| 1896 | 41.9% 1,767 | 57.1% 2,408 | 1.0% 40 |
| 1892 | 39.8% 1,505 | 54.5% 2,061 | 5.7% 215 |
References
- "State & County QuickFacts". United States Census Bureau. Archived from the original on June 6, 2011. Retrieved July 5, 2014.
- "Find a County". National Association of Counties. Retrieved June 7, 2011.
- Gannett, Henry (1905). The Origin of Certain Place Names in the United States. Govt. Print. Off. pp. 147.
- "Population, Housing Units, Area, and Density: 2010 - County". United States Census Bureau. Archived from the original on February 12, 2020. Retrieved July 11, 2015.
- "Monthly Averages for McLeansboro, Illinois". The Weather Channel. Retrieved January 27, 2011.
- "Population and Housing Unit Estimates". Retrieved November 6, 2019.
- "U.S. Decennial Census". United States Census Bureau. Retrieved July 5, 2014.
- "Historical Census Browser". University of Virginia Library. Retrieved July 5, 2014.
- "Population of Counties by Decennial Census: 1900 to 1990". United States Census Bureau. Retrieved July 5, 2014.
- "Census 2000 PHC-T-4. Ranking Tables for Counties: 1990 and 2000" (PDF). United States Census Bureau. Retrieved July 5, 2014.
- "DP-1 Profile of General Population and Housing Characteristics: 2010 Demographic Profile Data". United States Census Bureau. Archived from the original on February 13, 2020. Retrieved July 11, 2015.
- "DP02 SELECTED SOCIAL CHARACTERISTICS IN THE UNITED STATES – 2006-2010 American Community Survey 5-Year Estimates". United States Census Bureau. Archived from the original on February 13, 2020. Retrieved July 11, 2015.
- "DP03 SELECTED ECONOMIC CHARACTERISTICS – 2006-2010 American Community Survey 5-Year Estimates". United States Census Bureau. Archived from the original on February 13, 2020. Retrieved July 11, 2015.
- Cohn, Nate; ‘Demographic Shift: Southern Whites’ Loyalty to G.O.P. Nearing That of Blacks to Democrats’, New York Times, April 24, 2014
- Leip, David. "Dave Leip's Atlas of U.S. Presidential Elections". uselectionatlas.org. Retrieved November 4, 2018.
External links
- Hamilton County Illinois
- McLeansboro.com
- Hamilton County Community Unit District No.10 Schools
- Hamilton County Historical Society
- Hamilton County Foxes Football
Places adjacent to Hamilton County, Illinois | ||||||||||
|---|---|---|---|---|---|---|---|---|---|---|
| ||||||||||
Municipalities and communities of Hamilton County, Illinois, United States | ||
|---|---|---|
| Cities | Map of Illinois highlighting Hamilton County | |
| Town | ||
| Villages | ||
| Townships | ||
| Unincorporated communities | ||
| Footnotes | ‡This populated place also has portions in an adjacent county or counties | |

| Counties | 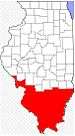 | |
|---|---|---|
| Mid-sized cities (25,000+) | ||
| Small Cities (10,000-25,000) | ||
| Small Cities (5,000-10,000) | ||
| Interstates | ||
| Airports/Military bases |
| |
| Universities | ||
| Colleges | ||
| Sports teams based in the Southern Illinois | ||