1932 United States presidential election in Illinois
The 1932 United States presidential election in Illinois took place on November 8, 1932, as part of the 1932 United States presidential election. State voters chose twenty-nine[2] representatives, or electors, to the Electoral College, who voted for president and vice president.
| ||||||||||||||||||||||||||
All 29 Illinois votes to the Electoral College | ||||||||||||||||||||||||||
|---|---|---|---|---|---|---|---|---|---|---|---|---|---|---|---|---|---|---|---|---|---|---|---|---|---|---|
| ||||||||||||||||||||||||||
| ||||||||||||||||||||||||||
| Elections in Illinois | ||||||||||
|---|---|---|---|---|---|---|---|---|---|---|
 | ||||||||||
|
||||||||||
|
||||||||||
|
||||||||||
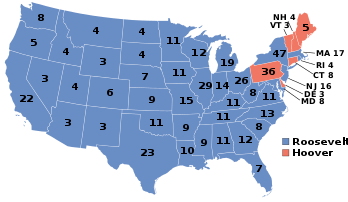
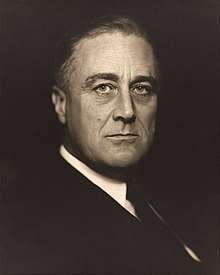
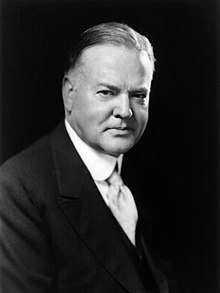
Illinois was won by Governor Franklin D. Roosevelt (D–New York), running with Speaker John Nance Garner, with 55.23% of the popular vote, against incumbent President Herbert Hoover (R–California), running with Vice President Charles Curtis, with 42.04% of the popular vote.[3][4]
This is the only occasion since at least the Civil War that any Democratic Presidential candidate has ever carried Ford County or Stark County.[5] As of the 2016 presidential election, this is also the last occasion when Livingston County and Washington County have voted for a Democratic Presidential candidate.[6]
Results
| Party | Candidate | Votes | % | |
|---|---|---|---|---|
| Democratic | Franklin D. Roosevelt | 1,882,304 | 55.23% | |
| Republican | Herbert Hoover (inc.) | 1,432,756 | 42.04% | |
| Socialist | Norman Thomas | 67,258 | 1.97% | |
| Communist | William Z. Foster | 15,582 | 0.46% | |
| Prohibition | William Upshaw | 6,388 | 0.19% | |
| Socialist Labor | Verne L. Reynolds | 3,638 | 0.11% | |
| Total votes | 3,407,926 | 100% | ||
Results by county
| County | Franklin Delano Roosevelt Democratic |
Herbert Clark Hoover Republican |
Normal Mattoon Thomas Socialist |
Various candidates Other parties |
Margin | Total votes cast[7] | |||||
|---|---|---|---|---|---|---|---|---|---|---|---|
| # | % | # | % | # | % | # | % | # | % | ||
| Adams | 21,098 | 66.62% | 10,134 | 32.00% | 379 | 1.20% | 58 | 0.18% | 10,964 | 34.62% | 31,669 |
| Alexander | 5,653 | 53.67% | 4,729 | 44.90% | 129 | 1.22% | 22 | 0.21% | 924 | 8.77% | 10,533 |
| Bond | 3,630 | 52.17% | 3,171 | 45.57% | 119 | 1.71% | 38 | 0.55% | 459 | 6.60% | 6,958 |
| Boone | 2,239 | 29.56% | 5,244 | 69.23% | 75 | 0.99% | 17 | 0.22% | -3,005 | -39.67% | 7,575 |
| Brown | 2,822 | 70.67% | 1,148 | 28.75% | 11 | 0.28% | 12 | 0.30% | 1,674 | 41.92% | 3,993 |
| Bureau | 10,309 | 53.47% | 8,721 | 45.23% | 187 | 0.97% | 63 | 0.33% | 1,588 | 8.24% | 19,280 |
| Calhoun | 2,229 | 63.61% | 1,239 | 35.36% | 29 | 0.83% | 7 | 0.20% | 990 | 28.25% | 3,504 |
| Carroll | 3,812 | 44.87% | 4,571 | 53.81% | 84 | 0.99% | 28 | 0.33% | -759 | -8.93% | 8,495 |
| Cass | 5,669 | 66.64% | 2,745 | 32.27% | 58 | 0.68% | 35 | 0.41% | 2,924 | 34.37% | 8,507 |
| Champaign | 16,474 | 53.02% | 13,995 | 45.04% | 499 | 1.61% | 102 | 0.33% | 2,479 | 7.98% | 31,070 |
| Christian | 11,515 | 63.12% | 6,096 | 33.42% | 542 | 2.97% | 89 | 0.49% | 5,419 | 29.71% | 18,242 |
| Clark | 5,659 | 57.27% | 4,148 | 41.98% | 21 | 0.21% | 53 | 0.54% | 1,511 | 15.29% | 9,881 |
| Clay | 4,565 | 56.61% | 3,373 | 41.83% | 63 | 0.78% | 63 | 0.78% | 1,192 | 14.78% | 8,064 |
| Clinton | 7,736 | 73.92% | 2,548 | 24.35% | 169 | 1.61% | 13 | 0.12% | 5,188 | 49.57% | 10,466 |
| Coles | 11,081 | 59.71% | 7,313 | 39.40% | 116 | 0.63% | 49 | 0.26% | 3,768 | 20.30% | 18,559 |
| Cook | 919,231 | 55.23% | 690,146 | 41.47% | 36,998 | 2.22% | 17,857 | 1.07% | 229,085 | 13.77% | 1,664,232 |
| Crawford | 6,081 | 56.31% | 4,550 | 42.13% | 89 | 0.82% | 80 | 0.74% | 1,531 | 14.18% | 10,800 |
| Cumberland | 3,128 | 58.75% | 2,166 | 40.68% | 16 | 0.30% | 14 | 0.26% | 962 | 18.07% | 5,324 |
| DeKalb | 6,923 | 41.72% | 9,356 | 56.38% | 273 | 1.65% | 42 | 0.25% | -2,433 | -14.66% | 16,594 |
| DeWitt | 5,339 | 55.19% | 4,207 | 43.49% | 97 | 1.00% | 30 | 0.31% | 1,132 | 11.70% | 9,673 |
| Douglas | 4,954 | 60.15% | 3,108 | 37.74% | 134 | 1.63% | 40 | 0.49% | 1,846 | 22.41% | 8,236 |
| DuPage | 18,547 | 40.49% | 25,758 | 56.23% | 1,364 | 2.98% | 140 | 0.31% | -7,211 | -15.74% | 45,809 |
| Edgar | 7,745 | 55.98% | 5,953 | 43.03% | 107 | 0.77% | 31 | 0.22% | 1,792 | 12.95% | 13,836 |
| Edwards | 1,956 | 46.39% | 2,203 | 52.25% | 36 | 0.85% | 21 | 0.50% | -247 | -5.86% | 4,216 |
| Effingham | 6,503 | 67.96% | 2,933 | 30.65% | 105 | 1.10% | 28 | 0.29% | 3,570 | 37.31% | 9,569 |
| Fayette | 7,053 | 57.06% | 5,122 | 41.44% | 89 | 0.72% | 96 | 0.78% | 1,931 | 15.62% | 12,360 |
| Ford | 4,175 | 54.82% | 3,342 | 43.88% | 90 | 1.18% | 9 | 0.12% | 833 | 10.94% | 7,616 |
| Franklin | 14,754 | 63.35% | 7,560 | 32.46% | 655 | 2.81% | 321 | 1.38% | 7,194 | 30.89% | 23,290 |
| Fulton | 12,144 | 58.92% | 7,579 | 36.77% | 569 | 2.76% | 319 | 1.55% | 4,565 | 22.15% | 20,611 |
| Gallatin | 3,469 | 72.08% | 1,279 | 26.57% | 39 | 0.81% | 26 | 0.54% | 2,190 | 45.50% | 4,813 |
| Greene | 6,347 | 67.99% | 2,857 | 30.61% | 94 | 1.01% | 37 | 0.40% | 3,490 | 37.39% | 9,335 |
| Grundy | 4,755 | 51.05% | 4,491 | 48.21% | 64 | 0.69% | 5 | 0.05% | 264 | 2.83% | 9,315 |
| Hamilton | 4,059 | 61.34% | 2,513 | 37.98% | 17 | 0.26% | 28 | 0.42% | 1,546 | 23.36% | 6,617 |
| Hancock | 8,808 | 64.13% | 4,789 | 34.87% | 50 | 0.36% | 87 | 0.63% | 4,019 | 29.26% | 13,734 |
| Hardin | 1,610 | 49.95% | 1,559 | 48.37% | 43 | 1.33% | 11 | 0.34% | 51 | 1.58% | 3,223 |
| Henderson | 2,372 | 55.60% | 1,815 | 42.55% | 66 | 1.55% | 13 | 0.30% | 557 | 13.06% | 4,266 |
| Henry | 10,122 | 45.60% | 11,376 | 51.25% | 637 | 2.87% | 64 | 0.29% | -1,254 | -5.65% | 22,199 |
| Iroquois | 9,434 | 59.34% | 6,303 | 39.65% | 138 | 0.87% | 23 | 0.14% | 3,131 | 19.69% | 15,898 |
| Jackson | 9,730 | 54.93% | 7,636 | 43.10% | 269 | 1.52% | 80 | 0.45% | 2,094 | 11.82% | 17,715 |
| Jasper | 4,390 | 65.27% | 2,300 | 34.20% | 16 | 0.24% | 20 | 0.30% | 2,090 | 31.07% | 6,726 |
| Jefferson | 9,495 | 63.28% | 5,333 | 35.54% | 101 | 0.67% | 76 | 0.51% | 4,162 | 27.74% | 15,005 |
| Jersey | 3,807 | 62.73% | 2,157 | 35.54% | 88 | 1.45% | 17 | 0.28% | 1,650 | 27.19% | 6,069 |
| Jo Daviess | 5,497 | 54.01% | 4,520 | 44.41% | 133 | 1.31% | 27 | 0.27% | 977 | 9.60% | 10,177 |
| Johnson | 2,387 | 49.11% | 2,424 | 49.87% | 37 | 0.76% | 13 | 0.27% | -37 | -0.76% | 4,861 |
| Kane | 24,638 | 42.00% | 32,934 | 56.15% | 962 | 1.64% | 122 | 0.21% | -8,296 | -14.14% | 58,656 |
| Kankakee | 13,555 | 54.67% | 10,873 | 43.86% | 321 | 1.29% | 43 | 0.17% | 2,682 | 10.82% | 24,792 |
| Kendall | 2,398 | 46.04% | 2,749 | 52.77% | 56 | 1.08% | 6 | 0.12% | -351 | -6.74% | 5,209 |
| Knox | 12,282 | 49.29% | 12,244 | 49.14% | 327 | 1.31% | 65 | 0.26% | 38 | 0.15% | 24,918 |
| Lake | 21,139 | 44.86% | 23,994 | 50.92% | 1,719 | 3.65% | 270 | 0.57% | -2,855 | -6.06% | 47,122 |
| LaSalle | 27,500 | 57.79% | 19,179 | 40.30% | 804 | 1.69% | 104 | 0.22% | 8,321 | 17.49% | 47,587 |
| Lawrence | 6,100 | 58.42% | 4,194 | 40.17% | 48 | 0.46% | 99 | 0.95% | 1,906 | 18.25% | 10,441 |
| Lee | 7,182 | 47.37% | 7,802 | 51.46% | 153 | 1.01% | 24 | 0.16% | -620 | -4.09% | 15,161 |
| Livingston | 10,024 | 53.92% | 8,403 | 45.20% | 113 | 0.61% | 49 | 0.26% | 1,621 | 8.72% | 18,589 |
| Logan | 8,119 | 57.52% | 5,850 | 41.44% | 108 | 0.77% | 39 | 0.28% | 2,269 | 16.07% | 14,116 |
| Macon | 21,638 | 54.99% | 16,868 | 42.87% | 635 | 1.61% | 205 | 0.52% | 4,770 | 12.12% | 39,346 |
| Macoupin | 14,810 | 62.65% | 7,031 | 29.74% | 1,567 | 6.63% | 232 | 0.98% | 7,779 | 32.91% | 23,640 |
| Madison | 35,211 | 61.52% | 19,774 | 34.55% | 1,980 | 3.46% | 273 | 0.48% | 15,437 | 26.97% | 57,238 |
| Marion | 10,791 | 62.09% | 6,276 | 36.11% | 217 | 1.25% | 96 | 0.55% | 4,515 | 25.98% | 17,380 |
| Marshall | 4,133 | 56.27% | 3,166 | 43.10% | 29 | 0.39% | 17 | 0.23% | 967 | 13.17% | 7,345 |
| Mason | 5,681 | 68.45% | 2,551 | 30.73% | 50 | 0.60% | 18 | 0.22% | 3,130 | 37.71% | 8,300 |
| Massac | 2,593 | 46.93% | 2,851 | 51.60% | 64 | 1.16% | 17 | 0.31% | -258 | -4.67% | 5,525 |
| McDonough | 7,608 | 53.94% | 6,329 | 44.87% | 115 | 0.82% | 53 | 0.38% | 1,279 | 9.07% | 14,105 |
| McHenry | 8,260 | 44.42% | 9,880 | 53.14% | 431 | 2.32% | 23 | 0.12% | -1,620 | -8.71% | 18,594 |
| McLean | 19,535 | 54.46% | 15,450 | 43.07% | 697 | 1.94% | 189 | 0.53% | 4,085 | 11.39% | 35,871 |
| Menard | 3,453 | 59.30% | 2,327 | 39.96% | 30 | 0.52% | 13 | 0.22% | 1,126 | 19.34% | 5,823 |
| Mercer | 4,309 | 48.77% | 4,436 | 50.21% | 45 | 0.51% | 45 | 0.51% | -127 | -1.44% | 8,835 |
| Monroe | 3,993 | 63.80% | 2,186 | 34.93% | 74 | 1.18% | 6 | 0.10% | 1,807 | 28.87% | 6,259 |
| Montgomery | 10,456 | 61.05% | 5,945 | 34.71% | 628 | 3.67% | 97 | 0.57% | 4,511 | 26.34% | 17,126 |
| Morgan | 10,170 | 56.09% | 7,787 | 42.95% | 125 | 0.69% | 48 | 0.26% | 2,383 | 13.14% | 18,130 |
| Moultrie | 4,219 | 63.48% | 2,353 | 35.40% | 48 | 0.72% | 26 | 0.39% | 1,866 | 28.08% | 6,646 |
| Ogle | 5,416 | 38.93% | 8,224 | 59.11% | 205 | 1.47% | 67 | 0.48% | -2,808 | -20.18% | 13,912 |
| Peoria | 37,605 | 59.02% | 25,166 | 39.50% | 776 | 1.22% | 169 | 0.27% | 12,439 | 19.52% | 63,716 |
| Perry | 7,400 | 64.34% | 3,778 | 32.85% | 251 | 2.18% | 73 | 0.63% | 3,622 | 31.49% | 11,502 |
| Piatt | 4,200 | 56.43% | 3,179 | 42.71% | 45 | 0.60% | 19 | 0.26% | 1,021 | 13.72% | 7,443 |
| Pike | 8,013 | 64.35% | 4,181 | 33.58% | 205 | 1.65% | 53 | 0.43% | 3,832 | 30.77% | 12,452 |
| Pope | 1,697 | 45.47% | 2,011 | 53.89% | 12 | 0.32% | 12 | 0.32% | -314 | -8.41% | 3,732 |
| Pulaski | 3,446 | 51.23% | 3,225 | 47.95% | 45 | 0.67% | 10 | 0.15% | 221 | 3.29% | 6,726 |
| Putnam | 1,554 | 58.62% | 1,050 | 39.61% | 41 | 1.55% | 6 | 0.23% | 504 | 19.01% | 2,651 |
| Randolph | 8,634 | 63.27% | 4,747 | 34.78% | 240 | 1.76% | 26 | 0.19% | 3,887 | 28.48% | 13,647 |
| Richland | 4,318 | 60.12% | 2,765 | 38.50% | 55 | 0.77% | 44 | 0.61% | 1,553 | 21.62% | 7,182 |
| Rock Island | 24,676 | 53.01% | 21,205 | 45.55% | 456 | 0.98% | 212 | 0.46% | 3,471 | 7.46% | 46,549 |
| Saline | 9,725 | 59.04% | 6,294 | 38.21% | 348 | 2.11% | 106 | 0.64% | 3,431 | 20.83% | 16,473 |
| Sangamon | 32,745 | 54.00% | 26,856 | 44.29% | 742 | 1.22% | 300 | 0.49% | 5,889 | 9.71% | 60,643 |
| Schuyler | 3,782 | 63.78% | 2,075 | 34.99% | 33 | 0.56% | 40 | 0.67% | 1,707 | 28.79% | 5,930 |
| Scott | 3,012 | 62.70% | 1,740 | 36.22% | 44 | 0.92% | 8 | 0.17% | 1,272 | 26.48% | 4,804 |
| Shelby | 8,093 | 62.40% | 4,657 | 35.91% | 126 | 0.97% | 93 | 0.72% | 3,436 | 26.49% | 12,969 |
| St. Clair | 47,305 | 65.18% | 22,744 | 31.34% | 2,073 | 2.86% | 449 | 0.62% | 24,561 | 33.84% | 72,571 |
| Stark | 2,369 | 52.26% | 2,119 | 46.75% | 34 | 0.75% | 11 | 0.24% | 250 | 5.52% | 4,533 |
| Stephenson | 10,728 | 53.11% | 8,963 | 44.38% | 349 | 1.73% | 158 | 0.78% | 1,765 | 8.74% | 20,198 |
| Tazewell | 13,591 | 64.55% | 7,260 | 34.48% | 160 | 0.76% | 44 | 0.21% | 6,331 | 30.07% | 21,055 |
| Union | 6,157 | 67.77% | 2,859 | 31.47% | 50 | 0.55% | 19 | 0.21% | 3,298 | 36.30% | 9,085 |
| Vermilion | 24,032 | 59.08% | 15,643 | 38.46% | 678 | 1.67% | 324 | 0.80% | 8,389 | 20.62% | 40,677 |
| Wabash | 4,280 | 63.93% | 2,309 | 34.49% | 66 | 0.99% | 40 | 0.60% | 1,971 | 29.44% | 6,695 |
| Warren | 5,610 | 49.83% | 5,498 | 48.84% | 88 | 0.78% | 62 | 0.55% | 112 | 0.99% | 11,258 |
| Washington | 4,696 | 59.25% | 3,076 | 38.81% | 117 | 1.48% | 37 | 0.47% | 1,620 | 20.44% | 7,926 |
| Wayne | 5,488 | 56.84% | 4,097 | 42.43% | 35 | 0.36% | 36 | 0.37% | 1,391 | 14.41% | 9,656 |
| White | 5,909 | 63.55% | 3,320 | 35.71% | 41 | 0.44% | 28 | 0.30% | 2,589 | 27.84% | 9,298 |
| Whiteside | 7,010 | 37.64% | 11,388 | 61.14% | 199 | 1.07% | 29 | 0.16% | -4,378 | -23.50% | 18,626 |
| Will | 25,798 | 49.36% | 25,173 | 48.16% | 1,190 | 2.28% | 105 | 0.20% | 625 | 1.20% | 52,266 |
| Williamson | 12,961 | 58.21% | 8,714 | 39.14% | 448 | 2.01% | 142 | 0.64% | 4,247 | 19.07% | 22,265 |
| Winnebago | 17,707 | 37.98% | 26,632 | 57.12% | 1,794 | 3.85% | 492 | 1.06% | -8,925 | -19.14% | 46,625 |
| Woodford | 5,244 | 57.05% | 3,866 | 42.06% | 71 | 0.77% | 11 | 0.12% | 1,378 | 14.99% | 9,192 |
| Totals | 1,882,304 | 55.23% | 1,432,756 | 42.04% | 67,258 | 1.97% | 25,608 | 0.75% | 449,548 | 13.19% | 3,407,926 |
References
- "United States Presidential election of 1932 - Encyclopædia Britannica". Retrieved January 18, 2019.
- "1932 Election for the Thirty-seventh Term (1933-37)". Retrieved January 18, 2019.
- "1932 Presidential General Election Results – Illinois". Retrieved October 20, 2019.
- "The American Presidency Project - Election of 1932". Retrieved January 18, 2019.
- Menendez, Albert J.; The Geography of Presidential Elections in the United States, 1868-2004, pp. 181-186 ISBN 0786422173
- Sullivan, Robert David; ‘How the Red and Blue Map Evolved Over the Past Century’; America Magazine in The National Catholic Review; June 29, 2016
- Our Campaigns; IL US President 1932