Peoria County, Illinois
Peoria County is a county in the U.S. state of Illinois. The 2010 United States Census listed its population at 186,494.[1] Its county seat is Peoria.[2]
Peoria County | |
|---|---|
 Courthouse Square in Peoria | |
 Seal | |
 Location within the U.S. state of Illinois | |
 Illinois's location within the U.S. | |
| Coordinates: 40°47′N 89°46′W | |
| Country | |
| State | |
| Founded | 1825 |
| Named for | Peoria tribe |
| Seat | Peoria |
| Largest city | Peoria |
| Area | |
| • Total | 631 sq mi (1,630 km2) |
| • Land | 619 sq mi (1,600 km2) |
| • Water | 11 sq mi (30 km2) 1.8% |
| Population (2010) | |
| • Total | 186,494 |
| • Estimate (2019) | 179,179 |
| • Density | 300/sq mi (110/km2) |
| Time zone | UTC−6 (Central) |
| • Summer (DST) | UTC−5 (CDT) |
| Congressional districts | 17th, 18th |
| Website | www |
Peoria County is part of the Peoria, IL Metropolitan Statistical Area.
History
Peoria County was formed in 1825 out of Fulton County. It was named for the Peoria, an Illiniwek people who lived there. It included most of the western valley of the Illinois River up to the Chicago river portage.
 Peoria County at creation, with unorganized territory attached to it.[3]
 Peoria County 1826–1827. The newly created Mercer and Warren Counties were temporarily attached to Peoria.[3]
 Peoria County 1827–1830. The creation of Tazewell County left Peoria with only a small tract of unorganized territory east of the Illinois River, whose border was not defined.
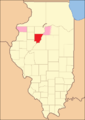 In 1830, Warren County organized a government.
 In 1831, Peoria County's present borders were established and Mercer County was attached to Warren.
Geography
According to the US Census Bureau, the county has a total area of 631 square miles (1,630 km2), of which 619 square miles (1,600 km2) is land and 11 square miles (28 km2) (1.8%) is water.[4] The county is drained by Spoon River, Kickapoo Creek, Elbow Creek, and Copperas Creek.[5]
Climate and weather
| Peoria, Illinois | ||||||||||||||||||||||||||||||||||||||||||||||||||||||||||||
|---|---|---|---|---|---|---|---|---|---|---|---|---|---|---|---|---|---|---|---|---|---|---|---|---|---|---|---|---|---|---|---|---|---|---|---|---|---|---|---|---|---|---|---|---|---|---|---|---|---|---|---|---|---|---|---|---|---|---|---|---|
| Climate chart (explanation) | ||||||||||||||||||||||||||||||||||||||||||||||||||||||||||||
| ||||||||||||||||||||||||||||||||||||||||||||||||||||||||||||
| ||||||||||||||||||||||||||||||||||||||||||||||||||||||||||||
In recent years, average temperatures in the county seat of Peoria have ranged from a low of 14 °F (−10 °C) in January to a high of 86 °F (30 °C) in July, although a record low of −27 °F (−33 °C) was recorded in January 1884 and a record high of 113 °F (45 °C) was recorded in July 1936. Average monthly precipitation ranged from 1.50 inches (38 mm) in January to 4.17 inches (106 mm) in May.[6]
Adjacent counties
- Knox County – northwest
- Stark County – north
- Marshall County – northeast
- Woodford County – east
- Tazewell County – south
- Fulton County – southwest
Transportation
Major highways
Defunct highways
Airports
- General Wayne A. Downing Peoria International Airport (PIA), formerly Greater Peoria Regional Airport
- Mount Hawley Auxiliary Airport (3MY) – Peoria, Illinois[7]
Demographics
| Historical population | |||
|---|---|---|---|
| Census | Pop. | %± | |
| 1840 | 6,153 | — | |
| 1850 | 17,547 | 185.2% | |
| 1860 | 36,601 | 108.6% | |
| 1870 | 47,540 | 29.9% | |
| 1880 | 55,355 | 16.4% | |
| 1890 | 70,378 | 27.1% | |
| 1900 | 88,608 | 25.9% | |
| 1910 | 100,255 | 13.1% | |
| 1920 | 111,710 | 11.4% | |
| 1930 | 141,344 | 26.5% | |
| 1940 | 153,374 | 8.5% | |
| 1950 | 174,347 | 13.7% | |
| 1960 | 189,044 | 8.4% | |
| 1970 | 195,318 | 3.3% | |
| 1980 | 200,466 | 2.6% | |
| 1990 | 182,827 | −8.8% | |
| 2000 | 183,433 | 0.3% | |
| 2010 | 186,494 | 1.7% | |
| Est. 2019 | 179,179 | [8] | −3.9% |
| US Decennial Census[9] 1790–1960[10] 1900–1990[11] 1990–2000[12] 2010–2019[1] | |||
As of the 2010 United States Census, there were 186,494 people, 75,793 households, and 47,248 families residing in the county.[13] The population density was 301.2 inhabitants per square mile (116.3/km2). There were 83,034 housing units at an average density of 134.1 per square mile (51.8/km2).[4] The racial makeup of the county was 74.4% white, 17.7% black or African American, 3.1% Asian, 0.3% American Indian, 1.6% from other races, and 2.8% from two or more races. Those of Hispanic or Latino origin made up 3.8% of the population.[13] In terms of ancestry, 28.3% were German, 14.8% were Irish, 10.4% were English, and 5.5% were American.[14]
Of the 75,793 households, 30.5% had children under the age of 18 living with them, 44.1% were married couples living together, 14.1% had a female householder with no husband present, 37.7% were non-families, and 31.0% of all households were made up of individuals. The average household size was 2.39 and the average family size was 3.00. The median age was 36.8 years.[13]
The median income for a household in the county was $49,747 and the median income for a family was $63,163. Males had a median income of $51,246 versus $32,881 for females. The per capita income for the county was $28,157. About 10.3% of families and 14.5% of the population were below the poverty line, including 21.8% of those under age 18 and 7.8% of those age 65 or over.[15]
Points of interest
- Glasford crater
- Jubilee College State Park
- WMBD World's Most Beautiful Drive (Grandview Drive/Prospect)[16]
- Forest Park Nature Center[17]
- Peoria Heights Tower Park[18]
- Rock Island Trail
Communities
Cities
Villages
Census-designated places
Unincorporated communities
- Alta
- Cramers
- Edelstein
- Edgewater
- Edwards
- El Vista
- Elmore
- Galena Knolls
- High Meadows
- Holmes Center
- Lake of the Woods
- Laura
- Lawn Ridge
- Mardell Manor
- Monica
- Mossville
- North Hampton
- Oak Hill
- Orchard Mines
- Pottstown
- Renchville
- Rome Heights
- Smithville
- South Rome
- Southport
- Trivoli
- Tuscarora
- Vets Row
- Vonachen Knolls
- West Hallock
Townships
School districts
Notable residents
People from Peoria County other than in the city of Peoria:
- Chris Brackett, host of Arrow Affliction on The Sportsman Channel
- Mike Dunne, pitcher for several Major League Baseball teams
- Sam Kinison, Preacher, Actor, Comedian; raised in East Peoria
- Bill Krieg, Major League Baseball player
- Lance (Henry) LeGault, TV and movie actor: Colonel Roderick Decker on The A-Team
- Zach McAllister, Major League Baseball player: Cleveland Indians pitcher
- Johnston McCulley, pulp fiction author: creator of Zorro
- Richard Pryor, Actor, Comedian
- David Ogden Stiers, actor, Major Charles Emerson Winchester III on M*A*S*H
- Josh Taylor, TV actor: Chris Kostichek on the soap opera Days of Our Lives
- Jim Thome, first baseman for several Major League Baseball teams
Government
Peoria County is governed by an 18-member County Board which meets on the second Thursday of each month. Each member represents a district with roughly 10,000 residents.[19]
| District | Board Member | Residence | In office since | Party |
|---|---|---|---|---|
| 1 | Sharon K. Williams | Peoria | 2012 | Democratic |
| 2 | Junior Watkins | Peoria | 1994 | Democratic |
| 3 | Barry Robinson | Peoria | 2016 | Democratic |
| 4 | Andrew Rand (Chair) | Peoria | 2008 | Democratic |
| 5 | Brandy Bryant | Peoria | 2019 | Democratic |
| 6 | Dr. Eden Blair | Peoria | 2019 | Democratic |
| 7 | James C. Dillon | West Peoria | 2006 | Democratic |
| 8 | Phillip Salzer | Peoria | unknown | Democratic |
| 9 | Kate Pastucha | Peoria Heights | 2017 | Democratic |
| 10 | Rob Reneau | Peoria | 2018 | Democratic |
| 11 | Linda E. Daley | Peoria | 2019 | Republican |
| 12 | Rachel Reliford | Peoria | 2018 | Republican |
| 13 | James Fennell (Vice-Chair) | Chillicothe | 2010 | Republican |
| 14 | Brian Elsasser | Princeville | 1998 | Republican |
| 15 | Steven B. Rieker | Peoria | 2016 | Republican |
| 16 | Matt Windish | Brimfield | 2016 | Republican |
| 17 | Jennifer Groves Allison | Peoria | 2019 | Democratic |
| 18 | Paul Rosenbohm | Peoria | 2010 | Republican |
The County also elects an Auditor, Circuit Clerk, Coroner, County Clerk, Sheriff, State's Attorney, Regional Superintendent, and Treasurer to four-year terms.
| Office | Current Holder | In office since | Party |
|---|---|---|---|
| Auditor | Jessica Thomas | 2018 | Democratic |
| Circuit Clerk | Bobby Spears | 2002 | Democratic |
| Coroner | Jamie Harwood | 2016 | Democratic |
| County Clerk | Rachael Parker | 2019 | Democratic |
| Sheriff | Brian Asbell | 2017 | Republican |
| State's Attorney | Jodi Hoos | 2019 | Democratic |
| Regional Superintendent | Elizabeth Crider | 2014 | Democratic |
| Treasurer | Nicole Bjerke | 2017 | Republican |
Politics
Prior to 1992, Peoria County usually voted for Republican candidates in presidential elections, only voting for Democratic Party candidates when they won nationally by a landslide. It began trending away from the GOP in the mid-1980s, as evidenced when Ronald Reagan only carried it with 55 percent of the vote in 1984 even as he was winning reelection in a landslide nationally.
From 1992 onward, the county has backed the Democratic candidate in every presidential election, though never by a margin greater than 10 percent aside from 2008 when Illinoisan Barack Obama won it by nearly 14 points. This relative closeness in results was most evident in 2004 when the county backed John Kerry over George W. Bush by only 70 votes.
| Year | Republican | Democratic | Third parties |
|---|---|---|---|
| 2016 | 45.1% 35,633 | 48.1% 38,060 | 6.8% 5,409 |
| 2012 | 46.9% 36,774 | 51.3% 40,209 | 1.8% 1,428 |
| 2008 | 42.3% 34,579 | 56.2% 45,906 | 1.5% 1,219 |
| 2004 | 49.6% 41,051 | 49.7% 41,121 | 0.7% 599 |
| 2000 | 47.4% 36,398 | 50.3% 38,604 | 2.4% 1,810 |
| 1996 | 41.8% 30,990 | 50.5% 37,383 | 7.7% 5,729 |
| 1992 | 37.8% 30,718 | 46.9% 38,099 | 15.4% 12,511 |
| 1988 | 51.4% 37,605 | 48.1% 35,253 | 0.5% 372 |
| 1984 | 55.0% 45,607 | 44.4% 36,830 | 0.6% 462 |
| 1980 | 57.3% 47,815 | 33.9% 28,276 | 8.9% 7,419 |
| 1976 | 56.7% 46,526 | 42.1% 34,606 | 1.2% 991 |
| 1972 | 64.5% 50,324 | 34.9% 27,264 | 0.6% 444 |
| 1968 | 50.0% 37,021 | 41.8% 30,937 | 8.3% 6,147 |
| 1964 | 41.3% 33,327 | 58.7% 47,360 | 0.0% 0 |
| 1960 | 53.8% 45,529 | 46.1% 39,061 | 0.1% 86 |
| 1956 | 62.7% 50,888 | 37.2% 30,145 | 0.1% 108 |
| 1952 | 59.1% 49,245 | 40.7% 33,955 | 0.2% 139 |
| 1948 | 52.8% 35,018 | 46.8% 31,026 | 0.5% 308 |
| 1944 | 50.8% 34,171 | 48.8% 32,837 | 0.4% 243 |
| 1940 | 45.2% 34,911 | 54.4% 42,009 | 0.4% 301 |
| 1936 | 34.0% 25,425 | 64.2% 48,063 | 1.8% 1,377 |
| 1932 | 39.5% 25,166 | 59.0% 37,605 | 1.5% 945 |
| 1928 | 56.5% 31,024 | 42.2% 23,150 | 1.4% 739 |
| 1924 | 58.6% 25,243 | 14.7% 6,343 | 26.7% 11,526 |
| 1920 | 66.0% 24,541 | 25.4% 9,453 | 8.6% 3,188 |
| 1916 | 48.4% 18,615 | 48.7% 18,718 | 3.0% 1,145 |
| 1912 | 41.9% 9,229 | 38.0% 8,364 | 20.1% 4,427 |
| 1908 | 52.5% 10,828 | 43.1% 8,898 | 4.4% 909 |
| 1904 | 62.0% 11,868 | 29.8% 5,697 | 8.2% 1,570 |
| 1900 | 51.8% 10,700 | 45.7% 9,433 | 2.5% 514 |
| 1896 | 52.7% 10,486 | 45.6% 9,068 | 1.7% 344 |
| 1892 | 45.6% 7,266 | 50.6% 8,053 | 3.8% 605 |
In Congress, Peoria County is represented by Democrat Cheri Bustos of Illinois's 17th congressional district and Republican Darin LaHood of the Illinois's 18th congressional district
In the Illinois Senate, Peoria County is represented by Republican Chuck Weaver of the 37th Legislative District and Democrat Dave Koehler of the 46th Legislative District. In the Illinois House of Representatives, Peoria County is represented by Republican Ryan Spain of the 73rd Representative District, Republican Mike Unes of the 91st Representative District and Democrat Jehan Gordon-Booth of the 92nd Representative District.
References
- "State & County QuickFacts". US Census Bureau. Archived from the original on June 7, 2011. Retrieved July 8, 2014.
- "Peoria County, Illinois".
- White, Jesse. Origin and Evolution of Illinois Counties. State of Illinois, March 2010.
- "Population, Housing Units, Area, and Density: 2010 – County". US Census Bureau. Archived from the original on February 12, 2020. Retrieved July 12, 2015.
-

- "Monthly Averages for Peoria IL". The Weather Channel. Retrieved January 27, 2011.
- "Peoria County Public and Private Airports". www.tollfreeairline.com. Retrieved April 17, 2018.
- "Population and Housing Unit Estimates". Retrieved April 9, 2020.
- "US Decennial Census". US Census Bureau. Retrieved July 8, 2014.
- "Historical Census Browser". University of Virginia Library. Retrieved July 8, 2014.
- "Population of Counties by Decennial Census: 1900 to 1990". US Census Bureau. Retrieved July 8, 2014.
- "Census 2000 PHC-T-4. Ranking Tables for Counties: 1990 and 2000" (PDF). US Census Bureau. Retrieved July 8, 2014.
- "Profile of General Population and Housing Characteristics: 2010 Demographic Profile Data". US Census Bureau. Archived from the original on February 13, 2020. Retrieved July 12, 2015.
- "Selected Social Characteristics in the United States – 2006–2010 American Community Survey 5-Year Estimates". US Census Bureau. Archived from the original on February 13, 2020. Retrieved July 12, 2015.
- "Selected Economic Characteristics – 2006–2010 American Community Survey 5-Year Estimates". US Census Bureau. Archived from the original on February 13, 2020. Retrieved July 12, 2015.
- Grandview Drive Google Maps (accessed 27 December 2018)
- Forest Park Nature Center Google Maps (accessed 27 December 2018)
- Peoria Heights Tower Park Google Maps (accessed 27 December 2018)
- "County Board | Peoria County, IL". www.peoriacounty.org. Retrieved October 8, 2019.
- Leip, David. "Atlas of US Presidential Elections". uselectionatlas.org. Retrieved April 17, 2018.
External links
Places adjacent to Peoria County, Illinois | ||||||||||
|---|---|---|---|---|---|---|---|---|---|---|
| ||||||||||
Municipalities and communities of Peoria County, Illinois, United States | ||
|---|---|---|
| Cities | Map of Illinois highlighting Peoria County | |
| Villages | ||
| Townships | ||
| CDPs | ||
| Other unincorporated communities |
| |
| Footnotes | ‡This populated place also has portions in an adjacent county or counties | |

| Authority control |
|
|---|