1972 United States presidential election in Illinois
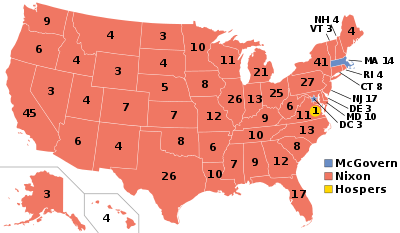
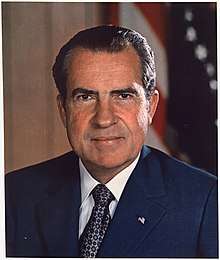
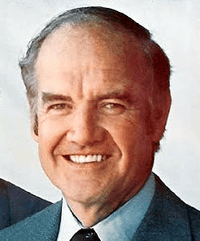
The 1972 United States presidential election in Illinois was held on November 7, 1972 as part of the 1972 United States presidential election. Incumbent President Nixon won the state of Illinois with 59.03 percent of the vote, carrying the state's 26 electoral votes.[1] He defeated his main opponent, Democratic candidate George McGovern in Illinois by an large margin of 18.52%, which still left Illinois 4.63% more Democratic than the nation.
| ||||||||||||||||||||||||||
| ||||||||||||||||||||||||||
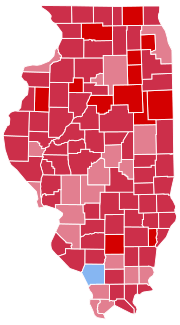 County Results
| ||||||||||||||||||||||||||
| ||||||||||||||||||||||||||
| Elections in Illinois | ||||||||||
|---|---|---|---|---|---|---|---|---|---|---|
 | ||||||||||
|
||||||||||
|
||||||||||
|
||||||||||
Nixon won all but one of Illinois’ 102 counties. The solitary exception was Jackson County, home to Southern Illinois University Carbondale, which notably had voted for Nixon in the previous election and was one of only five counties outside McGovern’s home state to switch from Republican to Democratic at this election.[lower-alpha 1][2] This election is the most recent in which Cook County voted Republican, the only Republican victory in St. Clair County since Calvin Coolidge in 1924,[3] and the last until 2016 when Alexander County supported a Republican nominee.[4]
Results
| 1972 United States presidential election in Illinois | |||||
|---|---|---|---|---|---|
| Party | Candidate | Votes | Percentage | Electoral votes | |
| Republican | Richard Nixon | 2,788,179 | 59.03% | 26 | |
| Democratic | George McGovern | 1,913,472 | 40.51% | 0 | |
| Socialist Labor | Louis Fisher | 12,344 | 0.26% | 0 | |
| Communist | Gus Hall | 4,541 | 0.10% | 0 | |
| Write-in | John Schmitz | 2,471 | 0.05% | 0 | |
| Write-ins | — | 2,229 | 0.05% | 0 | |
| Totals | 4,723,236 | 100.0% | 26 | ||
Results by county
| County | Richard Milhous Nixon Republican |
George Stanley McGovern Democratic |
Louis Fisher Socialist Labor |
Various candidates Other parties |
Margin | Total votes cast[5] | |||||
|---|---|---|---|---|---|---|---|---|---|---|---|
| # | % | # | % | # | % | # | % | # | % | ||
| Adams | 20,731 | 69.46% | 9,055 | 30.34% | 57 | 0.19% | 3 | 0.01% | 11,676 | 39.12% | 29,846 |
| Alexander | 2,669 | 51.24% | 2,482 | 47.65% | 49 | 0.94% | 9 | 0.17% | 187 | 3.59% | 5,209 |
| Bond | 4,475 | 62.30% | 2,704 | 37.64% | 4 | 0.06% | 0 | 0.00% | 1,771 | 24.66% | 7,183 |
| Boone | 7,003 | 68.89% | 3,131 | 30.80% | 29 | 0.29% | 2 | 0.02% | 3,872 | 38.09% | 10,165 |
| Brown | 1,780 | 58.90% | 1,203 | 39.81% | 36 | 1.19% | 3 | 0.10% | 577 | 19.09% | 3,022 |
| Bureau | 12,786 | 67.47% | 6,133 | 32.36% | 22 | 0.12% | 11 | 0.06% | 6,653 | 35.10% | 18,952 |
| Calhoun | 1,705 | 56.51% | 1,299 | 43.06% | 13 | 0.43% | 0 | 0.00% | 406 | 13.46% | 3,017 |
| Carroll | 6,041 | 69.99% | 2,571 | 29.79% | 18 | 0.21% | 1 | 0.01% | 3,470 | 40.20% | 8,631 |
| Cass | 4,414 | 61.14% | 2,803 | 38.83% | 1 | 0.01% | 1 | 0.01% | 1,611 | 22.32% | 7,219 |
| Champaign | 33,700 | 57.43% | 24,743 | 42.17% | 97 | 0.17% | 139 | 0.24% | 8,957 | 15.26% | 58,679 |
| Christian | 10,072 | 56.98% | 7,556 | 42.75% | 44 | 0.25% | 3 | 0.02% | 2,516 | 14.23% | 17,675 |
| Clark | 5,706 | 65.74% | 2,965 | 34.16% | 8 | 0.09% | 1 | 0.01% | 2,741 | 31.58% | 8,680 |
| Clay | 5,283 | 64.92% | 2,844 | 34.95% | 8 | 0.10% | 3 | 0.04% | 2,439 | 29.97% | 8,138 |
| Clinton | 7,931 | 62.39% | 4,756 | 37.41% | 15 | 0.12% | 10 | 0.08% | 3,175 | 24.98% | 12,712 |
| Coles | 13,681 | 62.90% | 7,988 | 36.72% | 15 | 0.07% | 67 | 0.31% | 5,693 | 26.17% | 21,751 |
| Cook | 1,234,307 | 53.41% | 1,063,268 | 46.01% | 7,328 | 0.32% | 6,134 | 0.27% | 171,039 | 7.40% | 2,311,037 |
| Crawford | 6,568 | 65.32% | 3,477 | 34.58% | 9 | 0.09% | 1 | 0.01% | 3,091 | 30.74% | 10,055 |
| Cumberland | 3,257 | 60.79% | 2,083 | 38.88% | 9 | 0.17% | 9 | 0.17% | 1,174 | 21.91% | 5,358 |
| DeKalb | 18,910 | 60.25% | 12,375 | 39.43% | 41 | 0.13% | 58 | 0.18% | 6,535 | 20.82% | 31,384 |
| DeWitt | 5,025 | 65.22% | 2,672 | 34.68% | 7 | 0.09% | 1 | 0.01% | 2,353 | 30.54% | 7,705 |
| Douglas | 5,840 | 68.66% | 2,656 | 31.23% | 8 | 0.09% | 2 | 0.02% | 3,184 | 37.43% | 8,506 |
| DuPage | 172,341 | 75.02% | 57,043 | 24.83% | 297 | 0.13% | 58 | 0.03% | 115,298 | 50.19% | 229,739 |
| Edgar | 7,195 | 64.73% | 3,889 | 34.99% | 29 | 0.26% | 3 | 0.03% | 3,306 | 29.74% | 11,116 |
| Edwards | 3,017 | 73.93% | 1,055 | 25.85% | 9 | 0.22% | 0 | 0.00% | 1,962 | 48.08% | 4,081 |
| Effingham | 8,752 | 66.34% | 4,431 | 33.59% | 7 | 0.05% | 3 | 0.02% | 4,321 | 32.75% | 13,193 |
| Fayette | 6,574 | 61.05% | 4,192 | 38.93% | 1 | 0.01% | 1 | 0.01% | 2,382 | 22.12% | 10,768 |
| Ford | 5,656 | 74.51% | 1,934 | 25.48% | 1 | 0.01% | 0 | 0.00% | 3,722 | 49.03% | 7,591 |
| Franklin | 10,121 | 54.04% | 8,545 | 45.62% | 32 | 0.17% | 31 | 0.17% | 1,576 | 8.41% | 18,729 |
| Fulton | 12,328 | 61.80% | 7,529 | 37.74% | 77 | 0.39% | 15 | 0.08% | 4,799 | 24.06% | 19,949 |
| Gallatin | 2,148 | 53.69% | 1,844 | 46.09% | 6 | 0.15% | 3 | 0.07% | 304 | 7.60% | 4,001 |
| Greene | 4,673 | 62.13% | 2,824 | 37.55% | 23 | 0.31% | 1 | 0.01% | 1,849 | 24.58% | 7,521 |
| Grundy | 8,725 | 70.70% | 3,584 | 29.04% | 20 | 0.16% | 12 | 0.10% | 5,141 | 41.66% | 12,341 |
| Hamilton | 3,282 | 61.94% | 2,006 | 37.86% | 9 | 0.17% | 2 | 0.04% | 1,276 | 24.08% | 5,299 |
| Hancock | 7,519 | 67.56% | 3,592 | 32.28% | 16 | 0.14% | 2 | 0.02% | 3,927 | 35.29% | 11,129 |
| Hardin | 1,915 | 62.54% | 1,140 | 37.23% | 6 | 0.20% | 1 | 0.03% | 775 | 25.31% | 3,062 |
| Henderson | 2,689 | 60.62% | 1,744 | 39.31% | 2 | 0.05% | 1 | 0.02% | 945 | 21.30% | 4,436 |
| Henry | 14,796 | 63.82% | 8,368 | 36.09% | 17 | 0.07% | 4 | 0.02% | 6,428 | 27.72% | 23,185 |
| Iroquois | 11,995 | 76.00% | 3,723 | 23.59% | 12 | 0.08% | 52 | 0.33% | 8,272 | 52.41% | 15,782 |
| Jackson | 12,393 | 48.42% | 13,146 | 51.37% | 48 | 0.19% | 6 | 0.02% | -753 | -2.94% | 25,593 |
| Jasper | 3,461 | 61.18% | 2,114 | 37.37% | 8 | 0.14% | 74 | 1.31% | 1,347 | 23.81% | 5,657 |
| Jefferson | 9,448 | 71.55% | 3,696 | 27.99% | 50 | 0.38% | 11 | 0.08% | 5,752 | 43.56% | 13,205 |
| Jersey | 5,164 | 60.70% | 3,317 | 38.99% | 8 | 0.09% | 18 | 0.21% | 1,847 | 21.71% | 8,507 |
| Jo Daviess | 5,763 | 63.34% | 3,318 | 36.47% | 13 | 0.14% | 5 | 0.05% | 2,445 | 26.87% | 9,099 |
| Johnson | 2,826 | 68.54% | 1,293 | 31.36% | 4 | 0.10% | 0 | 0.00% | 1,533 | 37.18% | 4,123 |
| Kane | 64,546 | 69.87% | 27,525 | 29.80% | 163 | 0.18% | 143 | 0.15% | 37,021 | 40.08% | 92,377 |
| Kankakee | 26,866 | 66.54% | 13,434 | 33.27% | 54 | 0.13% | 19 | 0.05% | 13,432 | 33.27% | 40,373 |
| Kendall | 9,373 | 78.65% | 2,525 | 21.19% | 19 | 0.16% | 0 | 0.00% | 6,848 | 57.46% | 11,917 |
| Knox | 17,315 | 64.69% | 9,333 | 34.87% | 60 | 0.22% | 58 | 0.22% | 7,982 | 29.82% | 26,766 |
| Lake | 92,052 | 65.84% | 47,416 | 33.91% | 278 | 0.20% | 66 | 0.05% | 44,636 | 31.93% | 139,812 |
| LaSalle | 31,190 | 59.20% | 21,405 | 40.63% | 82 | 0.16% | 10 | 0.02% | 9,785 | 18.57% | 52,687 |
| Lawrence | 5,347 | 65.36% | 2,818 | 34.45% | 15 | 0.18% | 1 | 0.01% | 2,529 | 30.91% | 8,181 |
| Lee | 10,636 | 68.67% | 4,788 | 30.91% | 12 | 0.08% | 53 | 0.34% | 5,848 | 37.76% | 15,489 |
| Livingston | 13,217 | 72.07% | 5,110 | 27.86% | 9 | 0.05% | 3 | 0.02% | 8,107 | 44.21% | 18,339 |
| Logan | 10,277 | 69.95% | 4,395 | 29.91% | 18 | 0.12% | 2 | 0.01% | 5,882 | 40.04% | 14,692 |
| Macon | 29,596 | 59.16% | 20,296 | 40.57% | 114 | 0.23% | 23 | 0.05% | 9,300 | 18.59% | 50,029 |
| Macoupin | 13,583 | 58.03% | 9,662 | 41.28% | 147 | 0.63% | 15 | 0.06% | 3,921 | 16.75% | 23,407 |
| Madison | 55,385 | 55.88% | 43,289 | 43.68% | 137 | 0.14% | 305 | 0.31% | 12,096 | 12.20% | 99,116 |
| Marion | 10,755 | 60.58% | 6,968 | 39.25% | 21 | 0.12% | 10 | 0.06% | 3,787 | 21.33% | 17,754 |
| Marshall | 4,452 | 67.43% | 2,141 | 32.43% | 8 | 0.12% | 1 | 0.02% | 2,311 | 35.00% | 6,602 |
| Mason | 4,897 | 62.70% | 2,901 | 37.14% | 8 | 0.10% | 4 | 0.05% | 1,996 | 25.56% | 7,810 |
| Massac | 4,313 | 69.99% | 1,831 | 29.71% | 14 | 0.23% | 4 | 0.06% | 2,482 | 40.28% | 6,162 |
| McDonough | 10,573 | 67.18% | 5,143 | 32.68% | 17 | 0.11% | 5 | 0.03% | 5,430 | 34.50% | 15,738 |
| McHenry | 36,114 | 74.75% | 12,090 | 25.02% | 88 | 0.18% | 20 | 0.04% | 24,024 | 49.73% | 48,312 |
| McLean | 31,060 | 67.59% | 14,824 | 32.26% | 57 | 0.12% | 14 | 0.03% | 16,236 | 35.33% | 45,955 |
| Menard | 3,657 | 69.49% | 1,587 | 30.15% | 8 | 0.15% | 11 | 0.21% | 2,070 | 39.33% | 5,263 |
| Mercer | 5,452 | 60.98% | 3,477 | 38.89% | 8 | 0.09% | 3 | 0.03% | 1,975 | 22.09% | 8,940 |
| Monroe | 6,479 | 68.44% | 2,958 | 31.25% | 24 | 0.25% | 5 | 0.05% | 3,521 | 37.20% | 9,466 |
| Montgomery | 9,025 | 56.71% | 6,858 | 43.10% | 27 | 0.17% | 3 | 0.02% | 2,167 | 13.62% | 15,913 |
| Morgan | 11,103 | 66.13% | 5,674 | 33.80% | 11 | 0.07% | 1 | 0.01% | 5,429 | 32.34% | 16,789 |
| Moultrie | 3,143 | 57.07% | 2,350 | 42.67% | 9 | 0.16% | 5 | 0.09% | 793 | 14.40% | 5,507 |
| Ogle | 13,512 | 73.88% | 4,743 | 25.93% | 32 | 0.17% | 3 | 0.02% | 8,769 | 47.94% | 18,290 |
| Peoria | 50,324 | 64.49% | 27,264 | 34.94% | 112 | 0.14% | 337 | 0.43% | 23,060 | 29.55% | 78,037 |
| Perry | 6,968 | 62.98% | 4,084 | 36.91% | 9 | 0.08% | 3 | 0.03% | 2,884 | 26.07% | 11,064 |
| Piatt | 5,057 | 67.72% | 2,394 | 32.06% | 16 | 0.21% | 1 | 0.01% | 2,663 | 35.66% | 7,468 |
| Pike | 5,940 | 60.23% | 3,883 | 39.37% | 38 | 0.39% | 2 | 0.02% | 2,057 | 20.86% | 9,863 |
| Pope | 1,440 | 64.92% | 773 | 34.85% | 4 | 0.18% | 1 | 0.05% | 667 | 30.07% | 2,218 |
| Pulaski | 2,485 | 59.27% | 1,683 | 40.14% | 21 | 0.50% | 4 | 0.10% | 802 | 19.13% | 4,193 |
| Putnam | 1,556 | 58.10% | 1,112 | 41.52% | 4 | 0.15% | 6 | 0.22% | 444 | 16.58% | 2,678 |
| Randolph | 9,761 | 60.20% | 6,440 | 39.72% | 14 | 0.09% | 0 | 0.00% | 3,321 | 20.48% | 16,215 |
| Richland | 5,558 | 68.41% | 2,553 | 31.42% | 12 | 0.15% | 2 | 0.02% | 3,005 | 36.98% | 8,125 |
| Rock Island | 37,548 | 53.39% | 32,529 | 46.25% | 227 | 0.32% | 26 | 0.04% | 5,019 | 7.14% | 70,330 |
| Saline | 7,660 | 59.30% | 5,226 | 40.46% | 26 | 0.20% | 6 | 0.05% | 2,434 | 18.84% | 12,918 |
| Sangamon | 50,458 | 65.46% | 25,720 | 33.37% | 284 | 0.37% | 617 | 0.80% | 24,738 | 32.09% | 77,079 |
| Schuyler | 2,994 | 66.03% | 1,534 | 33.83% | 2 | 0.04% | 4 | 0.09% | 1,460 | 32.20% | 4,534 |
| Scott | 2,228 | 66.00% | 1,145 | 33.92% | 2 | 0.06% | 1 | 0.03% | 1,083 | 32.08% | 3,376 |
| Shelby | 7,217 | 62.08% | 4,389 | 37.75% | 17 | 0.15% | 3 | 0.03% | 2,828 | 24.32% | 11,626 |
| St. Clair | 50,519 | 51.50% | 46,636 | 47.54% | 876 | 0.89% | 66 | 0.07% | 3,883 | 3.96% | 98,097 |
| Stark | 2,529 | 71.44% | 993 | 28.05% | 8 | 0.23% | 10 | 0.28% | 1,536 | 43.39% | 3,540 |
| Stephenson | 13,584 | 67.86% | 6,404 | 31.99% | 24 | 0.12% | 7 | 0.03% | 7,180 | 35.87% | 20,019 |
| Tazewell | 31,937 | 67.08% | 15,576 | 32.71% | 83 | 0.17% | 17 | 0.04% | 16,361 | 34.36% | 47,613 |
| Union | 5,034 | 59.36% | 3,428 | 40.42% | 16 | 0.19% | 2 | 0.02% | 1,606 | 18.94% | 8,480 |
| Vermilion | 24,863 | 63.06% | 14,413 | 36.56% | 70 | 0.18% | 79 | 0.20% | 10,450 | 26.51% | 39,425 |
| Wabash | 4,310 | 68.35% | 1,985 | 31.48% | 5 | 0.08% | 6 | 0.10% | 2,325 | 36.87% | 6,306 |
| Warren | 7,021 | 70.15% | 2,969 | 29.67% | 15 | 0.15% | 3 | 0.03% | 4,052 | 40.49% | 10,008 |
| Washington | 5,179 | 68.85% | 2,327 | 30.94% | 12 | 0.16% | 4 | 0.05% | 2,852 | 37.92% | 7,522 |
| Wayne | 6,400 | 69.75% | 2,763 | 30.11% | 10 | 0.11% | 2 | 0.02% | 3,637 | 39.64% | 9,175 |
| White | 6,052 | 62.10% | 3,678 | 37.74% | 11 | 0.11% | 5 | 0.05% | 2,374 | 24.36% | 9,746 |
| Whiteside | 17,305 | 68.40% | 7,909 | 31.26% | 80 | 0.32% | 7 | 0.03% | 9,396 | 37.14% | 25,301 |
| Will | 65,155 | 65.67% | 33,633 | 33.90% | 185 | 0.19% | 245 | 0.25% | 31,522 | 31.77% | 99,218 |
| Williamson | 14,101 | 60.02% | 9,202 | 39.17% | 12 | 0.05% | 177 | 0.75% | 4,899 | 20.85% | 23,492 |
| Winnebago | 57,682 | 61.46% | 35,937 | 38.29% | 179 | 0.19% | 52 | 0.06% | 21,745 | 23.17% | 93,850 |
| Woodford | 9,622 | 72.85% | 3,558 | 26.94% | 18 | 0.14% | 10 | 0.08% | 6,064 | 45.91% | 13,208 |
| Totals | 2,788,179 | 59.03% | 1,913,472 | 40.51% | 12,344 | 0.26% | 9,241 | 0.20% | 874,707 | 18.52% | 4,723,236 |
Notes
- The others were Pitkin County, Colorado, Stevens County, Minnesota, Washtenaw County, Michigan and Athens County, Ohio – all of which were and are dominated by college towns.
References
- "1972 Presidential General Election Results – Illinois". Retrieved May 13, 2016.
- Menendez, Albert J.; The Geography of Presidential Elections in the United States, 1868-2004, p. 98 ISBN 0786422173
- The Political Graveyard; St. Clair County, Illinois
- Sullivan, Robert David; ‘How the Red and Blue Map Evolved Over the Past Century’; America Magazine in The National Catholic Review; June 29, 2016
- Our Campaigns; IL US President 1972