1912 United States presidential election in Illinois
The 1912 United States presidential election in Illinois took place on November 5, 1912, as part of the 1912 United States presidential election. State voters chose twenty-nine representatives, or electors, to the Electoral College, who voted for president and vice president.
| |||||||||||||||||||||||||||||||||||||||||||||||||||||||
| |||||||||||||||||||||||||||||||||||||||||||||||||||||||
 County Results
| |||||||||||||||||||||||||||||||||||||||||||||||||||||||
| |||||||||||||||||||||||||||||||||||||||||||||||||||||||


| Elections in Illinois | ||||||||||
|---|---|---|---|---|---|---|---|---|---|---|
 | ||||||||||
|
||||||||||
|
||||||||||
|
||||||||||
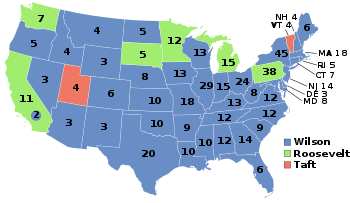
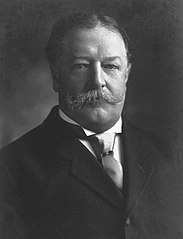
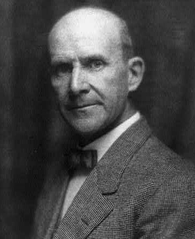
Illinois was won by New Jersey Governor Woodrow Wilson (D–New Jersey), running with Indiana governor Thomas R. Marshall, with 35.34% of the popular vote, against the 26th president of the United States Theodore Roosevelt (P–New York), running with California governor Hiram Johnson, with 33.72% of the popular vote, the 27th president of the United States William Howard Taft (R–Ohio), running with Columbia University President Nicholas Murray Butler, with 22.13% of the popular vote and the five-time candidate of the Socialist Party of America for President of the United States Eugene V. Debs (S–Indiana), running with the first Socialist mayor of a major city in the United States Emil Seidel, with 7.09% of the popular vote.[1] As of the 2016 presidential election, this is the last election in which Lee County, Ogle County and Edwards County did not support the Republican nominee.[2]
Results
| Party | Candidate | Votes | % | |
|---|---|---|---|---|
| Democratic | Woodrow Wilson | 405,048 | 35.34% | |
| Progressive | Theodore Roosevelt | 386,478 | 33.72% | |
| Republican | William Howard Taft | 253,593 | 22.13% | |
| Socialist | Eugene V. Debs | 81,278 | 7.09% | |
| Prohibition | Stuart Hamblen | 15,710 | 1.37% | |
| Socialist Labor | Arthur Reimer | 4,066 | 0.35% | |
| Total votes | 1,146,173 | 100% | ||
Results by county
| County | Thomas Woodrow Wilson Democratic |
William Howard Taft Republican |
Theodore Roosevelt Progressive |
Eugene Victor Debs Socialist |
Various candidates Other parties |
Margin[lower-alpha 1] | Total votes cast[3] | ||||||
|---|---|---|---|---|---|---|---|---|---|---|---|---|---|
| # | % | # | % | # | % | # | % | # | % | # | % | ||
| Adams | 6,952 | 48.74% | 2,733 | 19.16% | 3,780 | 26.50% | 559 | 3.92% | 239 | 1.68% | 3,172 | 22.24% | 14,263 |
| Alexander | 1,936 | 40.39% | 2,003 | 41.79% | 709 | 14.79% | 107 | 2.23% | 38 | 0.79% | -67[lower-alpha 2] | -1.40% | 4,793 |
| Bond | 1,278 | 37.23% | 1,152 | 33.56% | 725 | 21.12% | 64 | 1.86% | 214 | 6.23% | 126[lower-alpha 2] | 3.67% | 3,433 |
| Boone | 540 | 14.67% | 1,361 | 36.96% | 1,624 | 44.11% | 113 | 3.07% | 44 | 1.20% | -263[lower-alpha 3] | -7.14% | 3,682 |
| Brown | 1,358 | 58.74% | 381 | 16.48% | 524 | 22.66% | 12 | 0.52% | 37 | 1.60% | 834 | 36.07% | 2,312 |
| Bureau | 2,800 | 30.59% | 1,816 | 19.84% | 3,738 | 40.84% | 549 | 6.00% | 250 | 2.73% | -938 | -10.25% | 9,153 |
| Calhoun | 602 | 49.43% | 373 | 30.62% | 154 | 12.64% | 22 | 1.81% | 67 | 5.50% | 229[lower-alpha 2] | 18.80% | 1,218 |
| Carroll | 1,098 | 26.71% | 1,577 | 38.36% | 1,257 | 30.58% | 84 | 2.04% | 95 | 2.31% | 320[lower-alpha 3] | 7.78% | 4,111 |
| Cass | 2,223 | 52.99% | 719 | 17.14% | 1,086 | 25.89% | 103 | 2.46% | 64 | 1.53% | 1,137 | 27.10% | 4,195 |
| Champaign | 4,454 | 35.43% | 3,220 | 25.62% | 4,481 | 35.65% | 172 | 1.37% | 243 | 1.93% | -27 | -0.21% | 12,570 |
| Christian | 3,821 | 48.48% | 1,994 | 25.30% | 1,464 | 18.57% | 376 | 4.77% | 227 | 2.88% | 1,827[lower-alpha 2] | 23.18% | 7,882 |
| Clark | 2,517 | 45.34% | 1,897 | 34.17% | 943 | 16.98% | 49 | 0.88% | 146 | 2.63% | 620[lower-alpha 2] | 11.17% | 5,552 |
| Clay | 1,926 | 44.37% | 1,622 | 37.36% | 624 | 14.37% | 84 | 1.94% | 85 | 1.96% | 304[lower-alpha 2] | 7.00% | 4,341 |
| Clinton | 2,674 | 56.29% | 973 | 20.48% | 775 | 16.32% | 265 | 5.58% | 63 | 1.33% | 1,701[lower-alpha 2] | 35.81% | 4,750 |
| Coles | 3,453 | 40.98% | 2,263 | 26.86% | 2,437 | 28.92% | 170 | 2.02% | 103 | 1.22% | 1,016 | 12.06% | 8,426 |
| Cook | 130,702 | 30.44% | 74,851 | 17.44% | 166,061 | 38.68% | 52,659 | 12.27% | 5,039 | 1.17% | -35,359 | -8.24% | 429,312 |
| Crawford | 2,691 | 47.41% | 1,266 | 22.30% | 1,525 | 26.87% | 65 | 1.15% | 129 | 2.27% | 1,166 | 20.54% | 5,676 |
| Cumberland | 1,673 | 48.63% | 990 | 28.78% | 692 | 20.12% | 31 | 0.90% | 54 | 1.57% | 683[lower-alpha 2] | 19.85% | 3,440 |
| DeKalb | 1,568 | 21.44% | 1,776 | 24.28% | 3,643 | 49.81% | 205 | 2.80% | 122 | 1.67% | -1,867[lower-alpha 3] | -25.53% | 7,314 |
| DeWitt | 1,880 | 39.79% | 1,346 | 28.49% | 1,306 | 27.64% | 119 | 2.52% | 74 | 1.57% | 534[lower-alpha 2] | 11.30% | 4,725 |
| Douglas | 1,633 | 36.56% | 1,386 | 31.03% | 1,277 | 28.59% | 53 | 1.19% | 118 | 2.64% | 247[lower-alpha 2] | 5.53% | 4,467 |
| DuPage | 2,236 | 28.09% | 1,136 | 14.27% | 4,169 | 52.37% | 193 | 2.42% | 227 | 2.85% | -1,933 | -24.28% | 7,961 |
| Edgar | 3,479 | 47.02% | 2,430 | 32.84% | 1,244 | 16.81% | 91 | 1.23% | 155 | 2.09% | 1,049[lower-alpha 2] | 14.18% | 7,399 |
| Edwards | 650 | 27.04% | 817 | 33.99% | 818 | 34.03% | 16 | 0.67% | 103 | 4.28% | -1[lower-alpha 3] | -0.04% | 2,404 |
| Effingham | 2,575 | 59.76% | 1,002 | 23.25% | 622 | 14.43% | 46 | 1.07% | 64 | 1.49% | 1,573[lower-alpha 2] | 36.50% | 4,309 |
| Fayette | 2,782 | 46.04% | 1,481 | 24.51% | 1,558 | 25.79% | 82 | 1.36% | 139 | 2.30% | 1,224 | 20.26% | 6,042 |
| Ford | 1,035 | 27.91% | 832 | 22.44% | 1,729 | 46.63% | 23 | 0.62% | 89 | 2.40% | -694 | -18.72% | 3,708 |
| Franklin | 2,435 | 41.92% | 2,098 | 36.12% | 731 | 12.58% | 407 | 7.01% | 138 | 2.38% | 337[lower-alpha 2] | 5.80% | 5,809 |
| Fulton | 3,902 | 35.06% | 2,263 | 20.33% | 3,334 | 29.96% | 1,334 | 11.99% | 297 | 2.67% | 568 | 5.10% | 11,130 |
| Gallatin | 1,697 | 54.55% | 1,051 | 33.78% | 203 | 6.53% | 107 | 3.44% | 53 | 1.70% | 646[lower-alpha 2] | 20.77% | 3,111 |
| Greene | 2,801 | 57.44% | 1,064 | 21.82% | 831 | 17.04% | 124 | 2.54% | 56 | 1.15% | 1,737[lower-alpha 2] | 35.62% | 4,876 |
| Grundy | 1,172 | 24.77% | 1,380 | 29.17% | 1,919 | 40.56% | 180 | 3.80% | 80 | 1.69% | -539[lower-alpha 3] | -11.39% | 4,731 |
| Hamilton | 1,920 | 48.44% | 1,242 | 31.33% | 668 | 16.85% | 79 | 1.99% | 55 | 1.39% | 678[lower-alpha 2] | 17.10% | 3,964 |
| Hancock | 3,692 | 48.80% | 1,577 | 20.84% | 1,937 | 25.60% | 188 | 2.48% | 172 | 2.27% | 1,755 | 23.20% | 7,566 |
| Hardin | 644 | 40.63% | 691 | 43.60% | 153 | 9.65% | 47 | 2.97% | 50 | 3.15% | -47[lower-alpha 2] | -2.97% | 1,585 |
| Henderson | 721 | 30.97% | 648 | 27.84% | 871 | 37.41% | 31 | 1.33% | 57 | 2.45% | -150 | -6.44% | 2,328 |
| Henry | 2,219 | 24.22% | 1,859 | 20.29% | 4,505 | 49.17% | 376 | 4.10% | 204 | 2.23% | -2,286 | -24.95% | 9,163 |
| Iroquois | 2,474 | 32.92% | 1,866 | 24.83% | 2,959 | 39.37% | 52 | 0.69% | 165 | 2.20% | -485 | -6.45% | 7,516 |
| Jackson | 3,323 | 42.42% | 2,780 | 35.49% | 1,339 | 17.09% | 268 | 3.42% | 123 | 1.57% | 543[lower-alpha 2] | 6.93% | 7,833 |
| Jasper | 2,042 | 51.77% | 1,227 | 31.11% | 545 | 13.82% | 16 | 0.41% | 114 | 2.89% | 815[lower-alpha 2] | 20.66% | 3,944 |
| Jefferson | 3,237 | 48.94% | 1,834 | 27.73% | 1,294 | 19.56% | 142 | 2.15% | 107 | 1.62% | 1,403[lower-alpha 2] | 21.21% | 6,614 |
| Jersey | 1,573 | 55.06% | 838 | 29.33% | 381 | 13.34% | 12 | 0.42% | 53 | 1.86% | 735[lower-alpha 2] | 25.73% | 2,857 |
| Jo Daviess | 2,226 | 40.77% | 1,233 | 22.58% | 1,747 | 32.00% | 139 | 2.55% | 115 | 2.11% | 479 | 8.77% | 5,460 |
| Johnson | 952 | 32.57% | 1,025 | 35.07% | 809 | 27.68% | 66 | 2.26% | 71 | 2.43% | -73[lower-alpha 2] | -2.50% | 2,923 |
| Kane | 4,394 | 23.05% | 2,415 | 12.67% | 11,494 | 60.29% | 529 | 2.77% | 234 | 1.23% | -7,100 | -37.24% | 19,066 |
| Kankakee | 2,532 | 29.01% | 3,178 | 36.41% | 2,792 | 31.99% | 141 | 1.62% | 85 | 0.97% | 386[lower-alpha 3] | 4.42% | 8,728 |
| Kendall | 531 | 20.03% | 534 | 20.14% | 1,526 | 57.56% | 21 | 0.79% | 39 | 1.47% | -992[lower-alpha 3] | -37.42% | 2,651 |
| Knox | 2,758 | 26.35% | 1,750 | 16.72% | 5,386 | 51.46% | 405 | 3.87% | 168 | 1.61% | -2,628 | -25.11% | 10,467 |
| Lake | 2,436 | 24.09% | 2,183 | 21.59% | 4,888 | 48.33% | 445 | 4.40% | 161 | 1.59% | -2,452 | -24.25% | 10,113 |
| LaSalle | 7,036 | 35.56% | 4,858 | 24.56% | 6,918 | 34.97% | 636 | 3.21% | 336 | 1.70% | 118 | 0.60% | 19,784 |
| Lawrence | 2,550 | 47.93% | 1,617 | 30.39% | 774 | 14.55% | 170 | 3.20% | 209 | 3.93% | 933[lower-alpha 2] | 17.54% | 5,320 |
| Lee | 1,995 | 31.00% | 1,482 | 23.03% | 2,747 | 42.68% | 115 | 1.79% | 97 | 1.51% | -752 | -11.68% | 6,436 |
| Livingston | 3,334 | 36.01% | 2,444 | 26.40% | 3,230 | 34.89% | 71 | 0.77% | 179 | 1.93% | 104 | 1.12% | 9,258 |
| Logan | 3,229 | 48.19% | 1,397 | 20.85% | 1,776 | 26.50% | 163 | 2.43% | 136 | 2.03% | 1,453 | 21.68% | 6,701 |
| Macon | 4,435 | 36.12% | 3,356 | 27.33% | 3,976 | 32.38% | 293 | 2.39% | 218 | 1.78% | 459 | 3.74% | 12,278 |
| Macoupin | 4,902 | 47.53% | 2,177 | 21.11% | 2,147 | 20.82% | 806 | 7.81% | 282 | 2.73% | 2,725[lower-alpha 2] | 26.42% | 10,314 |
| Madison | 7,155 | 40.04% | 5,462 | 30.57% | 3,197 | 17.89% | 1,703 | 9.53% | 351 | 1.96% | 1,693[lower-alpha 2] | 9.48% | 17,868 |
| Marion | 3,493 | 44.26% | 1,586 | 20.10% | 2,099 | 26.60% | 498 | 6.31% | 216 | 2.74% | 1,394 | 17.66% | 7,892 |
| Marshall | 1,685 | 44.72% | 790 | 20.97% | 1,180 | 31.32% | 42 | 1.11% | 71 | 1.88% | 505 | 13.40% | 3,768 |
| Mason | 2,173 | 52.73% | 948 | 23.00% | 859 | 20.84% | 45 | 1.09% | 96 | 2.33% | 1,225[lower-alpha 2] | 29.73% | 4,121 |
| Massac | 599 | 21.47% | 1,341 | 48.06% | 788 | 28.24% | 21 | 0.75% | 41 | 1.47% | 553[lower-alpha 3] | 19.82% | 2,790 |
| McDonough | 2,959 | 42.44% | 1,876 | 26.90% | 1,785 | 25.60% | 181 | 2.60% | 172 | 2.47% | 1,083[lower-alpha 2] | 15.53% | 6,973 |
| McHenry | 1,913 | 25.69% | 2,370 | 31.82% | 3,046 | 40.90% | 39 | 0.52% | 79 | 1.06% | -676[lower-alpha 3] | -9.08% | 7,447 |
| McLean | 5,356 | 35.02% | 4,624 | 30.23% | 4,350 | 28.44% | 562 | 3.67% | 402 | 2.63% | 732[lower-alpha 2] | 4.79% | 15,294 |
| Menard | 1,530 | 48.19% | 620 | 19.53% | 903 | 28.44% | 60 | 1.89% | 62 | 1.95% | 627 | 19.75% | 3,175 |
| Mercer | 1,602 | 32.07% | 959 | 19.20% | 2,093 | 41.89% | 222 | 4.44% | 120 | 2.40% | -491 | -9.83% | 4,996 |
| Monroe | 1,398 | 44.31% | 1,433 | 45.42% | 299 | 9.48% | 19 | 0.60% | 6 | 0.19% | -35[lower-alpha 2] | -1.11% | 3,155 |
| Montgomery | 3,705 | 45.69% | 2,195 | 27.07% | 1,476 | 18.20% | 469 | 5.78% | 264 | 3.26% | 1,510[lower-alpha 2] | 18.62% | 8,109 |
| Morgan | 3,648 | 48.11% | 1,466 | 19.34% | 2,090 | 27.57% | 193 | 2.55% | 185 | 2.44% | 1,558 | 20.55% | 7,582 |
| Moultrie | 1,501 | 46.96% | 747 | 23.37% | 853 | 26.69% | 29 | 0.91% | 66 | 2.07% | 648 | 20.28% | 3,196 |
| Ogle | 1,750 | 25.95% | 2,014 | 29.86% | 2,720 | 40.33% | 57 | 0.85% | 204 | 3.02% | -706[lower-alpha 3] | -10.47% | 6,745 |
| Peoria | 8,364 | 37.98% | 2,594 | 11.78% | 9,229 | 41.91% | 1,571 | 7.13% | 262 | 1.19% | -865 | -3.93% | 22,020 |
| Perry | 2,107 | 44.53% | 1,341 | 28.34% | 894 | 18.89% | 215 | 4.54% | 175 | 3.70% | 766[lower-alpha 2] | 16.19% | 4,732 |
| Piatt | 1,417 | 37.84% | 1,064 | 28.41% | 1,150 | 30.71% | 36 | 0.96% | 78 | 2.08% | 267 | 7.13% | 3,745 |
| Pike | 3,371 | 50.90% | 1,668 | 25.18% | 1,169 | 17.65% | 253 | 3.82% | 162 | 2.45% | 1,703[lower-alpha 2] | 25.71% | 6,623 |
| Pope | 664 | 27.68% | 1,099 | 45.81% | 587 | 24.47% | 24 | 1.00% | 25 | 1.04% | -435[lower-alpha 2] | -18.13% | 2,399 |
| Pulaski | 978 | 30.73% | 1,632 | 51.27% | 454 | 14.26% | 78 | 2.45% | 41 | 1.29% | -654[lower-alpha 2] | -20.55% | 3,183 |
| Putnam | 424 | 29.00% | 403 | 27.56% | 583 | 39.88% | 28 | 1.92% | 24 | 1.64% | -159 | -10.88% | 1,462 |
| Randolph | 3,217 | 50.38% | 1,548 | 24.24% | 1,169 | 18.31% | 308 | 4.82% | 144 | 2.25% | 1,669[lower-alpha 2] | 26.14% | 6,386 |
| Richland | 1,800 | 48.39% | 862 | 23.17% | 811 | 21.80% | 114 | 3.06% | 133 | 3.58% | 938[lower-alpha 2] | 25.22% | 3,720 |
| Rock Island | 3,997 | 26.14% | 2,394 | 15.66% | 6,506 | 42.55% | 2,128 | 13.92% | 264 | 1.73% | -2,509 | -16.41% | 15,289 |
| Saline | 3,599 | 44.37% | 2,254 | 27.79% | 1,468 | 18.10% | 660 | 8.14% | 130 | 1.60% | 1,345[lower-alpha 2] | 16.58% | 8,111 |
| Sangamon | 8,406 | 42.25% | 3,994 | 20.07% | 6,196 | 31.14% | 1,007 | 5.06% | 294 | 1.48% | 2,210 | 11.11% | 19,897 |
| Schuyler | 1,714 | 50.00% | 853 | 24.88% | 694 | 20.25% | 31 | 0.90% | 136 | 3.97% | 861[lower-alpha 2] | 25.12% | 3,428 |
| Scott | 1,341 | 54.53% | 686 | 27.90% | 379 | 15.41% | 25 | 1.02% | 28 | 1.14% | 655[lower-alpha 2] | 26.64% | 2,459 |
| Shelby | 3,467 | 50.33% | 1,629 | 23.65% | 1,431 | 20.77% | 121 | 1.76% | 241 | 3.50% | 1,838[lower-alpha 2] | 26.68% | 6,889 |
| St. Clair | 10,826 | 41.85% | 8,156 | 31.53% | 4,064 | 15.71% | 2,498 | 9.66% | 322 | 1.24% | 2,670[lower-alpha 2] | 10.32% | 25,866 |
| Stark | 669 | 28.59% | 549 | 23.46% | 1,053 | 45.00% | 41 | 1.75% | 28 | 1.20% | -384 | -16.41% | 2,340 |
| Stephenson | 3,850 | 42.49% | 1,367 | 15.09% | 3,476 | 38.37% | 215 | 2.37% | 152 | 1.68% | 374 | 4.13% | 9,060 |
| Tazewell | 3,654 | 47.35% | 1,054 | 13.66% | 2,500 | 32.40% | 371 | 4.81% | 138 | 1.79% | 1,154 | 14.95% | 7,717 |
| Union | 2,648 | 60.36% | 1,194 | 27.22% | 458 | 10.44% | 23 | 0.52% | 64 | 1.46% | 1,454[lower-alpha 2] | 33.14% | 4,387 |
| Vermilion | 5,576 | 31.80% | 5,655 | 32.25% | 4,984 | 28.43% | 714 | 4.07% | 604 | 3.44% | -79[lower-alpha 2] | -0.45% | 17,533 |
| Wabash | 1,676 | 50.41% | 841 | 25.29% | 601 | 18.08% | 72 | 2.17% | 135 | 4.06% | 835[lower-alpha 2] | 25.11% | 3,325 |
| Warren | 2,080 | 34.86% | 915 | 15.34% | 2,627 | 44.03% | 237 | 3.97% | 107 | 1.79% | -547 | -9.17% | 5,966 |
| Washington | 1,654 | 39.06% | 1,304 | 30.80% | 1,058 | 24.99% | 135 | 3.19% | 83 | 1.96% | 350[lower-alpha 2] | 8.27% | 4,234 |
| Wayne | 2,378 | 42.26% | 1,586 | 28.19% | 1,418 | 25.20% | 74 | 1.32% | 171 | 3.04% | 792[lower-alpha 2] | 14.07% | 5,627 |
| White | 2,708 | 51.11% | 1,692 | 31.94% | 591 | 11.16% | 182 | 3.44% | 125 | 2.36% | 1,016[lower-alpha 2] | 19.18% | 5,298 |
| Whiteside | 1,996 | 25.89% | 1,437 | 18.64% | 3,904 | 50.63% | 91 | 1.18% | 283 | 3.67% | -1,908 | -24.74% | 7,711 |
| Will | 4,717 | 28.13% | 3,331 | 19.87% | 8,092 | 48.26% | 467 | 2.79% | 160 | 0.95% | -3,375 | -20.13% | 16,767 |
| Williamson | 3,258 | 35.16% | 3,209 | 34.63% | 1,765 | 19.05% | 706 | 7.62% | 329 | 3.55% | 49[lower-alpha 2] | 0.53% | 9,267 |
| Winnebago | 2,276 | 17.37% | 2,537 | 19.36% | 7,089 | 54.09% | 955 | 7.29% | 248 | 1.89% | -4,552[lower-alpha 3] | -34.73% | 13,105 |
| Woodford | 2,051 | 45.06% | 850 | 18.67% | 1,495 | 32.84% | 83 | 1.82% | 73 | 1.60% | 556 | 12.21% | 4,552 |
| Totals | 405,048 | 35.34% | 253,593 | 22.13% | 386,478 | 33.72% | 81,278 | 7.09% | 19,776 | 1.73% | 18,570 | 1.62% | 1,146,173 |
Notes
- Because Roosevelt finished ahead of Taft in Illinois as a whole, all vote and percentage margins give are Wilson minus Roosevelt unless stated in the total for the county in question.
- In this county where Roosevelt ran third behind both Taft and Wilson, the margin given is Wilson vote minus Taft vote and percentage margin Wilson percentage minus Taft percentage.
- In this county where Wilson ran third behind both Taft and Roosevelt, margin given is Taft vote minus Roosevelt vote and percentage margin Taft percentage minus Roosevelt percentage.
References
- "1912 Presidential Election Results Illinois".
- Menendez, Albert J.; The Geography of Presidential Elections in the United States, 1868-2004, pp. 181-186 ISBN 0786422173
- Illinois State Board of Elections; Vote for President – November 5, 1912: Highest Aggregate vote in Each County