Wayne County, Illinois
Wayne County is a county located in the U.S. state of Illinois. According to the 2010 census, it had a population of 16,760.[1] Its county seat is Fairfield.[2] It is located in the southern portion of Illinois known locally as "Little Egypt".
Wayne County | |
|---|---|
 Wayne County Courthouse in Fairfield | |
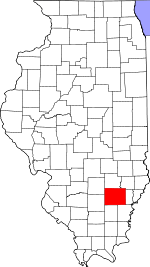 Location within the U.S. state of Illinois | |
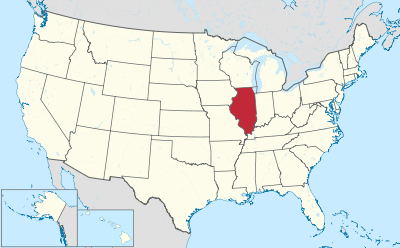 Illinois's location within the U.S. | |
| Coordinates: 38°26′N 88°25′W | |
| Country | |
| State | |
| Founded | 1819 |
| Named for | Anthony Wayne |
| Seat | Fairfield |
| Largest city | Fairfield |
| Area | |
| • Total | 715 sq mi (1,850 km2) |
| • Land | 714 sq mi (1,850 km2) |
| • Water | 1.7 sq mi (4 km2) 0.2% |
| Population (2010) | |
| • Total | 16,760 |
| • Estimate (2018) | 16,332 |
| • Density | 23/sq mi (9.1/km2) |
| Time zone | UTC−6 (Central) |
| • Summer (DST) | UTC−5 (CDT) |
| Congressional district | 15th |
| Website | www |
History
Wayne County was formed in 1819 out of Edwards County. It is named after Gen. "Mad Anthony" Wayne, an officer in the Revolutionary War and Northwest Indian War.
 Wayne County between its 1819 creation and 1821
 Wayne County between 1821 and 1824
 Wayne County in 1824, reduced to its current size
Geography
According to the U.S. Census Bureau, the county has a total area of 715 square miles (1,850 km2), of which 714 square miles (1,850 km2) is land and 1.7 square miles (4.4 km2) (0.2%) is water.[3]
Climate and weather
| Fairfield, Illinois | ||||||||||||||||||||||||||||||||||||||||||||||||||||||||||||
|---|---|---|---|---|---|---|---|---|---|---|---|---|---|---|---|---|---|---|---|---|---|---|---|---|---|---|---|---|---|---|---|---|---|---|---|---|---|---|---|---|---|---|---|---|---|---|---|---|---|---|---|---|---|---|---|---|---|---|---|---|
| Climate chart (explanation) | ||||||||||||||||||||||||||||||||||||||||||||||||||||||||||||
| ||||||||||||||||||||||||||||||||||||||||||||||||||||||||||||
| ||||||||||||||||||||||||||||||||||||||||||||||||||||||||||||
In recent years, average temperatures in the county seat of Fairfield have ranged from a low of 20 °F (−7 °C) in January to a high of 88 °F (31 °C) in July, although a record low of −23 °F (−31 °C) was recorded in January 1994 and a record high of 113 °F (45 °C) was recorded in July 1901. Average monthly precipitation ranged from 2.70 inches (69 mm) in February to 4.80 inches (122 mm) in April.[4]
Major highways


Adjacent counties
- Clay County (north)
- Richland County (northeast)
- Edwards County (east)
- White County (southeast)
- Hamilton County (south)
- Jefferson County (southwest)
- Marion County (northwest)
Demographics
| Historical population | |||
|---|---|---|---|
| Census | Pop. | %± | |
| 1820 | 1,114 | — | |
| 1830 | 2,553 | 129.2% | |
| 1840 | 5,133 | 101.1% | |
| 1850 | 6,825 | 33.0% | |
| 1860 | 12,223 | 79.1% | |
| 1870 | 19,758 | 61.6% | |
| 1880 | 21,291 | 7.8% | |
| 1890 | 23,806 | 11.8% | |
| 1900 | 27,626 | 16.0% | |
| 1910 | 25,697 | −7.0% | |
| 1920 | 22,772 | −11.4% | |
| 1930 | 19,130 | −16.0% | |
| 1940 | 22,092 | 15.5% | |
| 1950 | 20,933 | −5.2% | |
| 1960 | 19,008 | −9.2% | |
| 1970 | 17,004 | −10.5% | |
| 1980 | 18,059 | 6.2% | |
| 1990 | 17,241 | −4.5% | |
| 2000 | 17,151 | −0.5% | |
| 2010 | 16,760 | −2.3% | |
| Est. 2018 | 16,332 | [5] | −2.6% |
| U.S. Decennial Census[6] 1790-1960[7] 1900-1990[8] 1990-2000[9] 2010-2013[1] | |||
As of the 2010 United States Census, there were 16,760 people, 7,102 households, and 4,853 families living in the county.[10] The population density was 23.5 inhabitants per square mile (9.1/km2). There were 7,975 housing units at an average density of 11.2 per square mile (4.3/km2).[3] The racial makeup of the county was 98.0% white, 0.4% Asian, 0.3% black or African American, 0.2% American Indian, 0.3% from other races, and 0.8% from two or more races. Those of Hispanic or Latino origin made up 1.1% of the population.[10] In terms of ancestry, 17.0% were German, 14.1% were English, 12.7% were American, and 9.8% were Irish.[11]
Of the 7,102 households, 28.7% had children under the age of 18 living with them, 55.1% were married couples living together, 9.1% had a female householder with no husband present, 31.7% were non-families, and 28.4% of all households were made up of individuals. The average household size was 2.35 and the average family size was 2.86. The median age was 42.9 years.[10]
The median income for a household in the county was $39,207 and the median income for a family was $47,879. Males had a median income of $34,800 versus $27,192 for females. The per capita income for the county was $21,493. About 9.9% of families and 14.3% of the population were below the poverty line, including 18.0% of those under age 18 and 13.8% of those age 65 or over.[12]
Communities
City
Villages
Unincorporated communities
Townships
Wayne County is divided into these 20 townships:
Program 1033 Acquisitions
According to Department of Defense data, Wayne County has received six 5.56MM rifles and three "Utility Trucks" with a total acquisition cost of $120,705.[13]
Politics
| Year | Republican | Democratic | Third parties |
|---|---|---|---|
| 2016 | 83.9% 6,967 | 12.6% 1,048 | 3.4% 286 |
| 2012 | 77.8% 5,988 | 19.7% 1,514 | 2.5% 195 |
| 2008 | 66.8% 5,390 | 31.6% 2,547 | 1.7% 134 |
| 2004 | 73.6% 6,102 | 25.8% 2,139 | 0.6% 46 |
| 2000 | 69.5% 5,347 | 28.7% 2,209 | 1.8% 137 |
| 1996 | 49.5% 4,029 | 37.5% 3,054 | 13.0% 1,057 |
| 1992 | 42.9% 3,809 | 37.6% 3,332 | 19.5% 1,731 |
| 1988 | 63.3% 5,481 | 36.2% 3,135 | 0.5% 44 |
| 1984 | 70.4% 6,298 | 29.3% 2,621 | 0.4% 32 |
| 1980 | 62.9% 6,013 | 34.1% 3,258 | 3.0% 286 |
| 1976 | 54.4% 5,211 | 44.9% 4,303 | 0.7% 67 |
| 1972 | 69.8% 6,400 | 30.1% 2,763 | 0.1% 12 |
| 1968 | 59.6% 5,532 | 32.2% 2,993 | 8.2% 759 |
| 1964 | 47.7% 4,745 | 52.3% 5,198 | 0.0% 0 |
| 1960 | 62.7% 6,652 | 37.3% 3,954 | 0.1% 9 |
| 1956 | 61.4% 6,286 | 38.5% 3,942 | 0.1% 14 |
| 1952 | 62.3% 6,495 | 37.5% 3,911 | 0.1% 12 |
| 1948 | 54.7% 4,984 | 44.7% 4,070 | 0.7% 60 |
| 1944 | 58.2% 5,683 | 41.2% 4,019 | 0.6% 61 |
| 1940 | 53.8% 6,556 | 45.7% 5,569 | 0.6% 67 |
| 1936 | 48.8% 5,528 | 50.8% 5,752 | 0.4% 50 |
| 1932 | 42.4% 4,097 | 56.8% 5,488 | 0.7% 71 |
| 1928 | 62.0% 5,189 | 37.2% 3,108 | 0.8% 67 |
| 1924 | 52.7% 4,937 | 45.3% 4,247 | 2.0% 184 |
| 1920 | 60.5% 4,908 | 38.7% 3,137 | 0.8% 68 |
| 1916 | 51.0% 5,383 | 46.7% 4,934 | 2.3% 239 |
| 1912 | 25.2% 1,418 | 42.3% 2,378 | 32.6% 1,831 |
| 1908 | 49.6% 2,946 | 47.0% 2,791 | 3.4% 203 |
| 1904 | 52.6% 3,078 | 41.3% 2,416 | 6.1% 354 |
| 1900 | 49.0% 3,117 | 48.1% 3,062 | 2.9% 186 |
| 1896 | 47.8% 2,906 | 51.0% 3,102 | 1.2% 71 |
| 1892 | 43.8% 2,350 | 44.2% 2,372 | 12.1% 649 |
References
- "State & County QuickFacts". United States Census Bureau. Retrieved July 9, 2014.
- "Find a County". National Association of Counties. Retrieved June 7, 2011.
- "Population, Housing Units, Area, and Density: 2010 - County". United States Census Bureau. Archived from the original on February 12, 2020. Retrieved July 12, 2015.
- "Monthly Averages for Fairfield, Illinois". The Weather Channel. Retrieved January 27, 2011.
- "Population and Housing Unit Estimates". Retrieved November 2, 2019.
- "U.S. Decennial Census". United States Census Bureau. Retrieved July 9, 2014.
- "Historical Census Browser". University of Virginia Library. Retrieved July 9, 2014.
- "Population of Counties by Decennial Census: 1900 to 1990". United States Census Bureau. Retrieved July 9, 2014.
- "Census 2000 PHC-T-4. Ranking Tables for Counties: 1990 and 2000" (PDF). United States Census Bureau. Retrieved July 9, 2014.
- "DP-1 Profile of General Population and Housing Characteristics: 2010 Demographic Profile Data". United States Census Bureau. Archived from the original on February 13, 2020. Retrieved July 12, 2015.
- "DP02 SELECTED SOCIAL CHARACTERISTICS IN THE UNITED STATES – 2006-2010 American Community Survey 5-Year Estimates". United States Census Bureau. Archived from the original on February 13, 2020. Retrieved July 12, 2015.
- "DP03 SELECTED ECONOMIC CHARACTERISTICS – 2006-2010 American Community Survey 5-Year Estimates". United States Census Bureau. Archived from the original on February 13, 2020. Retrieved July 12, 2015.
- https://raw.githubusercontent.com/TheUpshot/Military-Surplus-Gear/master/1033-program-foia-may-2014.csv
- Leip, David. "Dave Leip's Atlas of U.S. Presidential Elections". uselectionatlas.org. Retrieved November 13, 2018.
Places adjacent to Wayne County, Illinois | ||||||||||
|---|---|---|---|---|---|---|---|---|---|---|
| ||||||||||
Municipalities and communities of Wayne County, Illinois, United States | ||
|---|---|---|
| Cities | Map of Illinois highlighting Wayne County | |
| Villages | ||
| Townships | ||
| Unincorporated communities | ||
| Footnotes | ‡This populated place also has portions in an adjacent county or counties | |

| Counties | 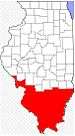 | |
|---|---|---|
| Mid-sized cities (25,000+) | ||
| Small Cities (10,000-25,000) | ||
| Small Cities (5,000-10,000) | ||
| Interstates | ||
| Airports/Military bases |
| |
| Universities | ||
| Colleges | ||
| Sports teams based in the Southern Illinois | ||
| Authority control |
|
|---|